. 2024 Dec 12;15(1):10340.
doi: 10.1038/s41467-024-53901-2.

Membrane potential states gate synaptic consolidation in human neocortical tissue

Affiliations

Membrane potential states gate synaptic consolidation in human neocortical tissue

Franz X Mittermaier et al. Nat Commun. .

Abstract

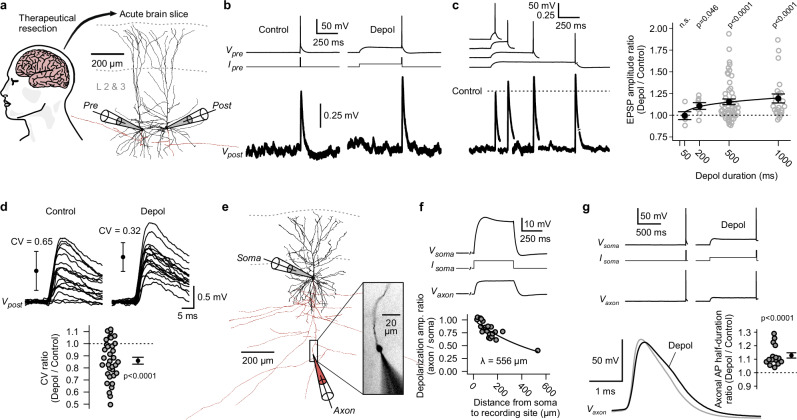
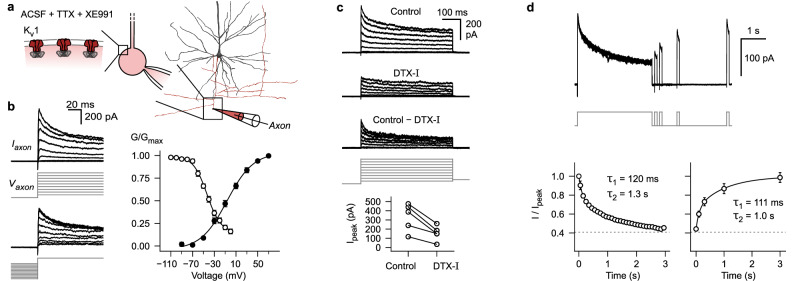
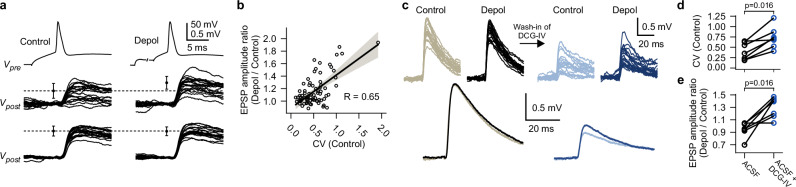
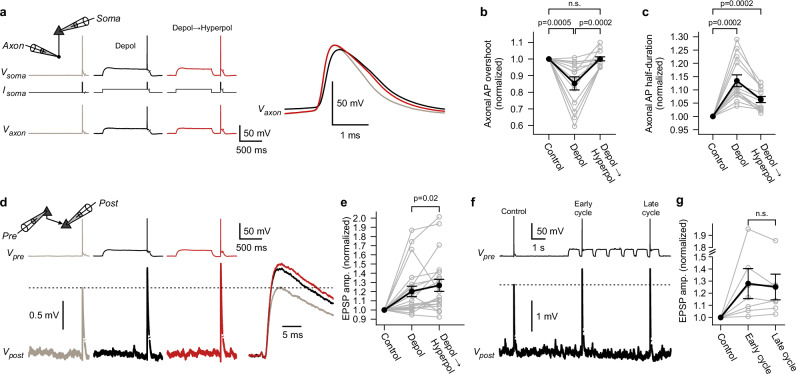
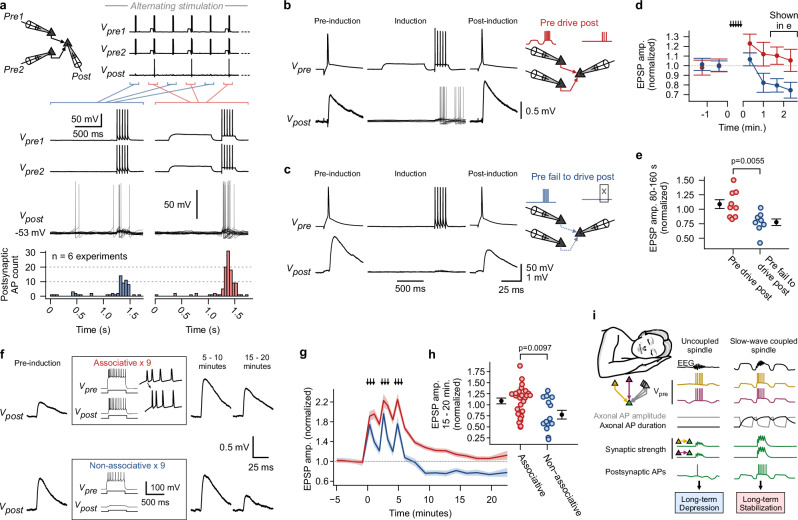
Synaptic mechanisms that contribute to human memory consolidation remain largely unexplored. Consolidation critically relies on sleep. During slow wave sleep, neurons exhibit characteristic membrane potential oscillations known as UP and DOWN states. Coupling of memory reactivation to these slow oscillations promotes consolidation, though the underlying mechanisms remain elusive. Here, we performed axonal and multineuron patch-clamp recordings in acute human brain slices, obtained from neurosurgeries, to show that sleep-like UP and DOWN states modulate axonal action potentials and temporarily enhance synaptic transmission between neocortical pyramidal neurons. Synaptic enhancement by UP and DOWN state sequences facilitates recruitment of postsynaptic action potentials, which in turn results in long-term stabilization of synaptic strength. In contrast, synapses undergo lasting depression if presynaptic neurons fail to recruit postsynaptic action potentials. Our study offers a mechanistic explanation for how coupling of neural activity to slow waves can cause synaptic consolidation, with potential implications for brain stimulation strategies targeting memory performance.


Conflict of interest statement

Competing interests: The authors declare no competing interests.

Figures

Fig. 1
Fig. 1. Presynaptic subthreshold depolarizations increase synaptic strength through broadening of axonal action potentials.
a Schematic of the human neocortex and reconstruction of two pyramidal neurons, which were connected by a unitary synapse (Pre and Post stands for pre- and postsynaptic neuron). b Paired whole-cell patch-clamp recording of neurons shown in panel a. Current was injected into the presynaptic neuron to elicit action potentials (AP) from resting membrane potential (‘Control’) or after a subthreshold depolarization (‘Depol’). Excitatory postsynaptic potentials (EPSP) were averaged over multiple trials. c Four separate recordings with different durations of depolarizations. To visualize relative change of EPSP amplitudes, postsynaptic signals were normalized to the ‘Control’ condition of each recording (dotted line). Right, relative changes of EPSP amplitudes plotted against depolarization durations (p-values were computed using two-sided Wilcoxon signed-rank tests; 50 ms, n = 5 paired recordings; 200 ms, n = 7; 500 ms, n = 53; 1000 ms, n = 23; error bars show mean ± s.e.m; fit line corresponds to bi-exponential function with time-constants for Kv1-inactivation, see Fig. 2d). d Top, single-trial EPSPs of an exemplary synapse (error bars show mean ± s.d. of single-trial amplitudes; traces were smoothed using a moving average with a 1 ms window; CV: coefficient of variation). Bottom, summary plot of relative changes of CVs (experiments with 500 or 1000 ms ‘Depol’-duration and effect > 1.1 in panel c were pooled; n = 34 paired recordings; two-sided Wilcoxon signed-rank test; error bar shows mean ± s.e.m). e Reconstruction of exemplary somato-axonal recording. Inset, axonal ‘bleb’ filled with Alexa Fluor 568 dye during recording. f Somato-axonal recording of the neuron shown in panel e. Current was injected at the soma to cause a subthreshold depolarization, which spread into the axon. Bottom, relationship between distances from soma and attenuation of amplitudes of passively spreading depolarizations (n = 20 somato-axonal recordings; mono-exponential fit). g Somato-axonal recording. APs were elicited at the soma. Bottom left, overlay of ‘Control’ and ‘Depol’ AP recorded in the axon. Bottom right, summary plot of relative changes of axonal AP half-durations (n = 15 somato-axonal recordings; two-sided Wilcoxon signed-rank test; error bar shows mean ± s.e.m). Source data are provided as a Source Data file.
Fig. 2
Fig. 2. Axons of human layer 2 & 3 pyramidal neurons contain Kv1 potassium channels that show slow inactivation in the subthreshold voltage range.
a Reconstruction of biocytin labeled pyramidal neuron (dendrite black, axon red) and schematic of ‘whole-bleb’ recording configuration (see Methods: Axonal voltage-clamp recordings). b Left, K+-currents in response to activation and steady-state inactivation voltage-clamp protocols (see Methods). Right, normalized K+-conductance as a function of test voltage (black data points, activation protocol, n = 9 axonal recordings) or conditioning voltage (white data points, inactivation protocol, n = 5 axonal recordings). Data is displayed as mean ± s.e.m. c K+-currents in response to voltage steps during control period, after local puff-application of dendrotoxin-I (DTX-I), as well as subtraction of the two conditions. Bottom, summary plot showing peak currents in response to +70 mV test pulses before and after DTX-I application (n = 5 axonal recordings). d K+-currents in response to a protocol to determine inactivation and recovery from inactivation kinetics (see Methods). Bottom, summary plots displaying mean ± s.e.m of normalized current amplitudes (n = 5 axonal recordings). Lines correspond to double exponential fits (time constants are shown as insets). ACSF, artificial cerebrospinal fluid; TTX, tetrodotoxin. Source data are provided as a Source Data file.
Fig. 3
Fig. 3. Synaptic reliability determines magnitude of subthreshold modulation.
a Multiple overlaid single-trial excitatory postsynaptic potentials (EPSP) of one unreliable synapse (i.e., large CV of single-trial EPSP amplitudes during ‘Control’ condition, top) and one reliable synapse (i.e., small CV, bottom). Note enhancement of unreliable synapse by ‘Depol’ condition (presynaptic traces are only shown for one of the two synapses; error bars show mean ± s.d. of n = 20 single-trial EPSP amplitudes; traces were smoothed using a moving average with a 1 ms window). b Relative changes of EPSP amplitudes in response to ‘Depol’ conditions plotted against CVs of single trial EPSP amplitudes during ‘Control’ conditions (experiments with 500 and 1000 ms ‘Depol’-duration were pooled; n = 76 paired recordings; line and error band represent regression line and 95% confidence interval of a linear model). c Top, single-trial EPSPs of an exemplary synapse before and after wash-in of 100 nM DCG-IV. Bottom, averaged EPSPs. d, e Summary plots depicting decrease of synaptic reliability and increase of enhancement by subthreshold depolarizations in presence of DCG-IV (n = 7 paired recordings; two-sided Wilcoxon signed-rank tests; ACSF, artificial cerebrospinal fluid). Source data are provided as a Source Data file.
Fig. 4
Fig. 4. Sequences of presynaptic de- and hyperpolarizations recover axonal action potential amplitude and further increase synaptic transmission.
a Exemplary somato-axonal recording. Somatic current injections (Isoma) were used to induce ‘Depol’ and ‘Depol→Hyperpol’ conditions. Right, magnified axonal action potentials (AP). Note the decrease and rescue of axonal AP overshoot in the ‘Depol’ and ‘Depol→Hyperpol’ conditions, respectively. b, c Summary graphs showing relative changes of the axonal AP overshoot and half-duration (n = 13 somato-axonal recordings; two-sided Wilcoxon signed-rank tests; error bars show mean ± s.e.m). d Exemplary paired recording of synaptically connected pyramidal neurons. Excitatory postsynaptic potentials (EPSP) were averaged over multiple trials and are shown on a finer timescale on the right. e Summary graph showing relative changes of EPSP amplitudes (n = 21 paired recordings; two-sided Wilcoxon signed-rank test; error bars show mean ± s.e.m). f Exemplary paired recording. ‘Control’ condition was compared to early and late cycles of multiple de- and hyperpolarizations. g Summary graph showing relative changes of the average EPSP amplitudes (n = 7 paired recordings; two-sided Wilcoxon signed-rank test; error bars show mean ± s.e.m). Source data are provided as a Source Data file.
Fig. 5
Fig. 5. Sequences of presynaptic de- and hyperpolarizations boost recruitment of postsynaptic action potentials, resulting in lasting stabilization of synapses.
a Top: Schematic depicting multineuron patch-clamp recording of convergent synaptic motif. ‘Control’ and ‘Depol→Hyperpol’ conditions followed by trains of action potentials (AP) were induced in an alternating fashion in presynaptic neurons. Bottom: First two rows show exemplary voltage traces of presynaptic neurons. Third row depicts superimposed trials of postsynaptic traces. Fourth row shows summary histogram (n = 6 experiments; 50 ms bins). b Presynaptic AP and averaged excitatory postsynaptic potential (EPSP) of an exemplary synapse before and after ‘Pre drive post’ paradigm, which consisted of synchronous initiation of the ‘Depol→Hyperpol’ protocol in presynaptic neurons of a convergent motif to trigger postsynaptic APs, as shown in superimposed traces (sustained current was injected into postsynaptic neuron during induction; induction was typically repeated 25 times). c ‘Pre fail to drive post’ paradigm, where postsynaptic neurons were held at a more negative membrane potential, so that synapses didn’t trigger postsynaptic APs. d Mean EPSP amplitudes plotted over time for the two paradigms (normalized to pre-induction period; mean ± s.e.m). e EPSP amplitudes for time window 80–160 s after end of induction (normalized to pre-induction period; n = 9 synapses for ‘Pre drive post’, n = 8 synapses for ‘Pre fail to drive post’; two-sided Mann-Whitney U test; mean ± s.e.m). f Averaged EPSPs of two exemplary synapses before induction, as well as 5–10 and 15–20 minutes after start of induction. Paradigms consisted of 500-ms current injections to elicit associated pre- and postsynaptic trains of APs (‘Associative’) or isolated presynaptic trains of APs (‘Non-associative’). The induction was repeated 9 times over a period of 5 minutes (arrows in panel g). g Mean EPSP amplitudes plotted over time for the two paradigms (normalized to pre-induction period; mean ± s.e.m). h EPSP amplitudes for time window 15–20 minutes (normalized to pre-induction period; n = 27 synapses for ‘Associative’, n = 14 synapses for ‘Non-associative’; two-sided Mann-Whitney U test; mean ± s.e.m). i Concept of coupled vs. uncoupled sleep oscillations and their short- and long-term effect on synaptic strength. Source data are provided as a Source Data file.

References

    1. Kitamura, T. et al. Engrams and circuits crucial for systems consolidation of a memory. Science356, 73–78 (2017). - PMC - PubMed
    1. Klinzing, J. G., Niethard, N. & Born, J. Mechanisms of systems memory consolidation during sleep. Nat. Neurosci.22, 1598–1610 (2019). - PubMed
    1. Corkin, S. What’s new with the amnesic patient H.M.? Nat. Rev. Neurosci.3, 153–160 (2002). - PubMed
    1. Frankland, P. W. & Bontempi, B. The organization of recent and remote memories. Nat. Rev. Neurosci.6, 119–130 (2005). - PubMed
    1. Buzsaki, G. The hippocampo-neocortical dialogue. Cereb. Cortex6, 81–92 (1996). - PubMed

Publication types

LinkOut - more resources