. 2025 Feb;22(2):380-385.
doi: 10.1038/s41592-024-02540-y. Epub 2024 Dec 12.

MouseGoggles: an immersive virtual reality headset for mouse neuroscience and behavior

Affiliations

MouseGoggles: an immersive virtual reality headset for mouse neuroscience and behavior

Matthew Isaacson et al. Nat Methods. 2025 Feb.

Abstract

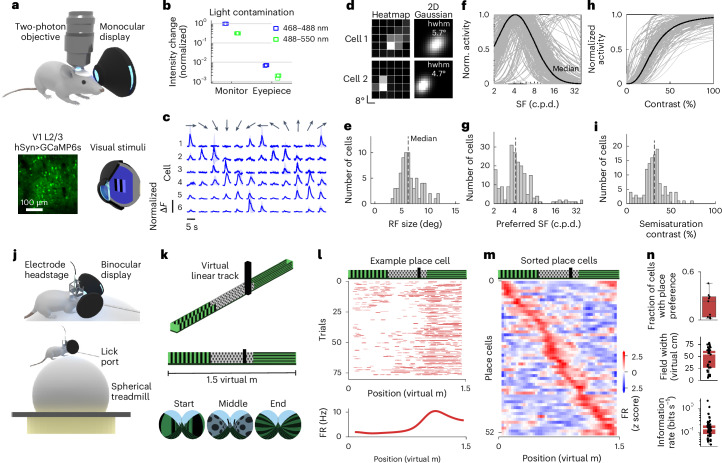
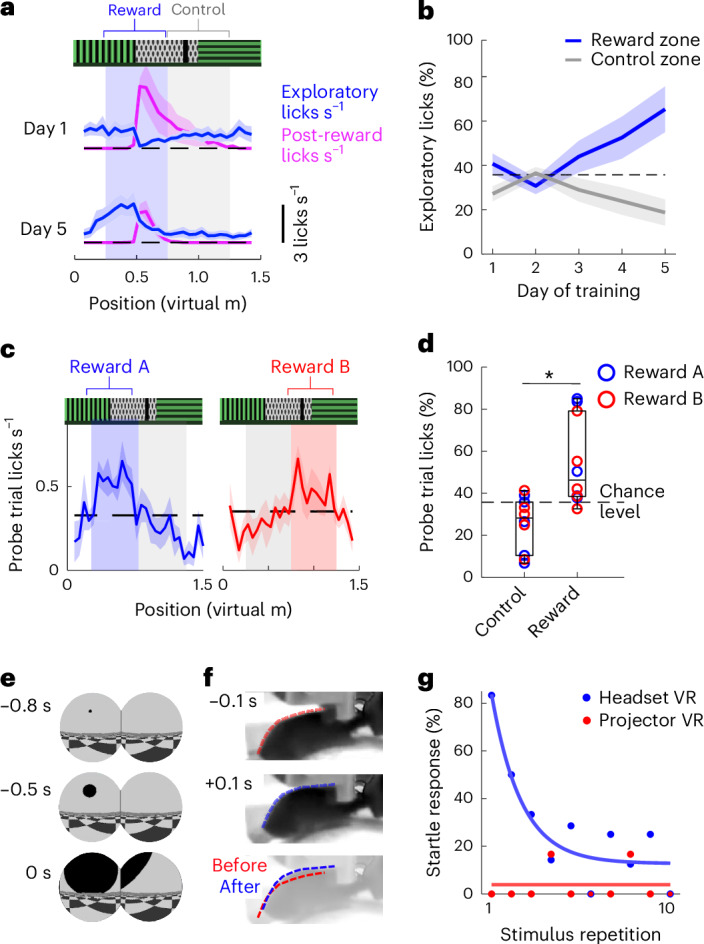
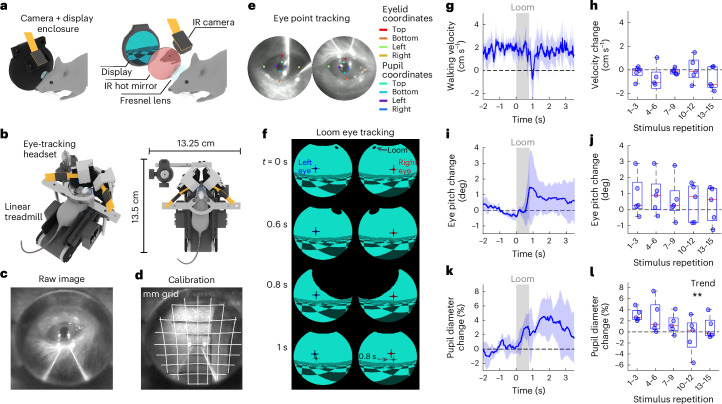
Small-animal virtual reality (VR) systems have become invaluable tools in neuroscience for studying complex behavior during head-fixed neural recording, but they lag behind commercial human VR systems in terms of miniaturization, immersivity and advanced features such as eye tracking. Here we present MouseGoggles, a miniature VR headset for head-fixed mice that delivers independent, binocular visual stimulation over a wide field of view while enabling eye tracking and pupillometry in VR. Neural recordings in the visual cortex validate the quality of image presentation, while hippocampal recordings, associative reward learning and innate fear responses to virtual looming stimuli demonstrate an immersive VR experience. Our open-source system's simplicity and compact size will enable the broader adoption of VR methods in neuroscience.


Conflict of interest statement

Competing interests: The authors declare no competing interests.

Figures

Fig. 1
Fig. 1. Headset-based VR design.
a, Components and orientation of headset eyepieces, each containing a 2.76-cm-diameter circular LED display and 1.27-cm-diameter Fresnel lens housed in a 3D-printed enclosure. b, Optical modeling of display and Fresnel lens for infinity focus, with viewing angles of 0–70° (one half of the 140° total FOV coverage) linearly mapped onto the circular display. c,d, Optical model estimate for the apparent resolution (c) and focal distance (d) as a function of viewing angle. e, A Winkel tripel projection of the mouse’s estimated visual field overlaid with the headset display visual field coverage. f, Communication diagrams of the MouseGoggles Mono monocular display system (left) and MouseGoggles Duo binocular display system (right), with SPI-based display control and additional input/output communication schemes. g, The Godot video game engine-generated 3D environment with split-screen viewports and spherical shaders to map the scene onto the dual-display headset.
Fig. 2
Fig. 2. Neural recording in headset VR.
a, The experimental setup for MouseGoggles Mono visual stimulation with two-photon imaging of mouse V1 layer 2/3 neurons expressing GCaMP6s. b, Light contamination measurements from five repetitions of a maximum-brightness blue flicker stimulus into blue (468–488 nm) and green (488–550 nm) imaging channels, using either a flat LED monitor or the monocular display eyepiece. Raw intensity values were normalized to the maximum intensity from the monitor. c, Direction- and orientation-selective fluorescence change (ΔF) responses from 6 example neurons from 12 directions of drifting grating stimuli (mean ± s.d. of 6 repetitions). d, RF maps for two example cells. Left: inferred spike rate heatmap based on stimulus location. Right: 2D Gaussian fit to the heatmap, with the average half width at half maximum (hwhm) shown. e, A histogram of calculated RF size for all cells well fit by a 2D Gaussian (n = 341 cells). f, The SF tuning of normalized activity for all cells well fit by a log-Gaussian function (n = 124 cells). g, A histogram of preferred SF. h, The contrast frequency tuning of normalized activity for all cells well fit by a Naka–Rushton function (n = 202). i, A histogram of semisaturation contrast. j, The experimental setup for hippocampal electrophysiological recordings during simulated walking on a spherical treadmill with MouseGoggles Duo. k, Rendered view (top) and side view (middle) of the virtual linear track, with headset views at three different positions (bottom). l, An example place cell across the entire virtual linear track session, showing the raster plot of neural activity (top) and tuning curve (bottom; FR, firing rate). m, A position-ordered heatmap of all detected place cells (n = 54 cells), showing binned firing rate (FR, z-scored) over position. n, Place cell characteristics over all recorded sessions: fraction of cells with place selectivity (n = 9 sessions, top), place field width (n = 39 cells within 10–80 virtual cm, middle) and information rate (n = 54 cells, bottom). The box plot displays median and 25th and 75th quartiles, with the whiskers representing the most extreme nonoutliers.
Fig. 3
Fig. 3. Conditioned and innate behaviors in headset VR.
a, Mouse licking behavior during days 1 and 5 of a 5-day virtual linear track place learning protocol using MouseGoggles Duo, separated into an exploratory licking (defined as licks not initiated by a liquid reward delivery) and post-reward licking (mean of all trials ± s.e.m., n = 5 mice). b, The proportion of exploratory licks in reward versus control zone, across days (mean of all trials ± s.e.m., n = 5 mice). c, The exploratory lick rate during unrewarded probe trials on days 4 and 5 as a function of position in the virtual linear track for mice trained for a reward in zone A (left) and zone B (right) (mean lick rate of probe trials ± s.e.m., n = 5 mice each for reward zone). d, The proportion of licking in reward versus control zone on probe trials in which no reward was delivered, pooling mice conditioned to associate reward with zones A and B. The box plots display median and 25th and 75th quartiles, with the whiskers representing the most extreme nonoutliers (n = 10 mice; median 46.3% for reward versus 28.6% for control; P = 0.02, two-tailed Mann–Whitney U test). e, Looming stimuli consisting of a dark circular object approaching at constant velocity before reaching the closest distance at t = 0 s. f, An example ‘startle’ response from a head-fixed mouse from the looming stimulus, characterized by a jump up and arching of the back (see also Supplementary Video 3). g, The proportion of mice that displayed a startle response after presentation of a looming stimulus (as determined from manual behavior scoring) as a function of stimulus repetition and comparing headset or projector-based VR (n = 6–7 mice for all repetitions with headset, n = 4–5 mice with projector). An exponential decay curve is fit to the headset-based VR startle responses.
Fig. 4
Fig. 4. Eye and pupil tracking during VR looming stimuli.
a, The design of combined VR display and eye-tracking camera eyepiece enclosure (left), with an exploded view showing the layout of eyepiece components (right). b, The experimental setup of MouseGoggles EyeTrack for head-fixed mice walking on a linear treadmill (treadmill model adapted from ref. ). c, A raw IR image of the eye-tracking camera during VR. d, An eye-tracking camera image of a grid with calibrated gridlines (millimeter spacing), to correct distortions. e, Eye-tracking camera frames of left and right eyes with Deeplabcut-labeled points on the border of the eyelid and pupil. f, Example frames of a centered looming stimulus, with left and right eye optical axes mapped onto the VR visual field, demonstrating increased eye pitch after the loom (bottom). g, The average treadmill velocity during looming stimuli onset across all 15 repetitions of the stimulus (mean ± s.d. of 5 mice in shaded region). h, A box plot of mean walking velocity change during 0–2 s after looming stimulus onset (relative to baseline), averaged across each set of three looming stimuli (left, right and centered loom), with no significant trend over repeat repetitions (n = 5 mice, one-sided Cuzick’s trend test, P = 0.37). The box plot displays median and 25th and 75th quartiles, with whiskers representing the most extreme nonoutliers. i, The average change in eye pitch angle (relative to baseline) during looming stimuli across all 15 repetitions of the stimulus (mean ± s.d. of 5 mice in shaded region). j, A box plot of the change in eye pitch angle during 0–2 s after looming stimulus onset, averaged across each set of three looming stimuli, with no significant trend over repeat repetitions (n = 5 mice, one-sided Cuzick’s trend test, P = 0.24). The box and whiskers are defined as in h. k, The average change in pupil diameter during looming stimuli onset across the first set of three repetitions of the looming stimulus (mean ± s.d. of five mice in shaded region). l, A box plot of the average change in pupil diameter during 0–3 s after looming stimulus onset, averaged across each set of three looming stimuli, with stars denoting a statistically significant trend (n = 5 mice, one-sided Cuzick’s trend test, P = 0.007). The box and whiskers are defined as in h.
Extended Data Fig. 1
Extended Data Fig. 1. Display projection through an enucleated mouse eye.
a, Schematic layout of a MouseGoggles eyepiece with a mini camera set to infinite focal distance, positioned 1 mm from the eyepiece lens center, with a field of view (FOV) centered on the display. b, Image of the eyepiece display produced from the imaging setup in (a). c, Layout of an enucleated mouse eye positioned on a 3D printed holder 10 cm below a traditional monitor, with a mini camera positioned below the eye. d, Layout of an enucleated mouse eye positioned below a MouseGoggles eyepiece, with a variable eye position relative to the lens center. e, Images produced from the imaging setup in (c), with views of a uniform brightness image (left), horizontal gratings (middle), and vertical gratings (right). Images of the eye during horizontal (middle) and vertical (right) gratings are at 2x zoom relative to the image with uniform brightness (left). f, Images produced from the imaging setup in (d), with eye distance-from-lens values of 0.5, 1, 2, and 3 mm (top to bottom), with views of a uniform image (left), horizontal gratings (middle), and vertical gratings (right). g, Images produced from the imaging setup in (d), with eye distance-from-center values of 0.4, 1.4, 2.2, and 3 mm (top to bottom), with views of a uniform image (left), horizontal gratings (middle), and vertical gratings (right), and with small and large distortions marked for the 2.2 mm and 3 mm positions. All images in this figure were taken using the same enucleated mouse eye, with similar results reproduced using a second eye.
Extended Data Fig. 2
Extended Data Fig. 2. Mouse inter-eye distance.
a, Views of an anesthetized mouse from above for measuring distance between corneal apexes. b, Scatterplot of eye distance measurement as a function of mouse weight, for both male and female mice of different genotypes. c, Scatterplot of the data in (b) plotted alternatively as a function of mouse age. d, Histogram of inter-eye distances of all mice younger than 30 weeks (n = 18 mice, 11–22 weeks).
Extended Data Fig. 3
Extended Data Fig. 3. Designs of monocular and binocular display enclosures.
a, (left) 3D renders of assembled and exploded views of the monocular display, MouseGoggles Mono (version 1.0). (right) CAD designs and overall dimensions (in mm) of the top and bottom halves of the display case as well as the fully assembled case. b, (left) 3D renders and (right) CAD designs of the binocular headset, MouseGoggles Duo (version 1.0). c, (left) 3D renders and (right) CAD designs of the smaller form factor binocular headset (MouseGoggles Duo version 1.1), connecting to a raspberry Pi with a SPI cable. All units are in mm.
Extended Data Fig. 4
Extended Data Fig. 4. Whisker occlusion by headset pitch.
a, Front (top) and side (bottom) views of a head-fixed mouse on a linear treadmill, positioned with a MouseGoggles Duo (version 1.1) headset at three pitch angles: 15 deg (left), 30 deg (middle), and 45 deg (right). b, Estimated visual field coverage of the headset for the three pitch angles in (a). c, Map of whiskers which make constant/full contact, temporary/partial contact, or no contact with the headset at the three pitch angles in (a), measured for three different mice.
Extended Data Fig. 5
Extended Data Fig. 5. Display light pollution measurements for two-photon imaging.
a, 3D renders of a two-photon calcium imaging setup for head-fixed mice with visual stimulation from either a MouseGoggles Mono eyepiece (left) or a fully-shielded flat monitor (right). b, Diagram of brain imaging during visual stimulation with the cranial window unblocked (left) or blocked (right), with pathways indicating both external light detection and internal light detection (light travelling through the pupil and scattering through the brain). c, Scatterplot of raw light intensity increase during 3 repetitions of a maximum brightness blue image flicker (relative to black image baseline), measured in blue (468-488) and green (488–550 nm) imaging channels, from 2 mice. Measurements are compared between a MouseGoggles display and Shielded monitor display, with either the cranial window open (total stray light) or blocked (external pathway stray light only), as well as the raw intensity measurements from GCaMP6s baseline and peak fluorescence during a typical calcium imaging experiment (4 representative GCaMP6s-labeled cells each from 2 mice). d, Scatterplot of data, reproduced from panel (c), zoomed in on the y-axis to show small intensity measurements. Additional columns added for the internal pathway stray light measurements (that is ‘external’ subtracted from ‘total’).
Extended Data Fig. 6
Extended Data Fig. 6. Rewarded linear track protocol and example trajectories.
(left) Description of the 5-day training protocol for virtual linear track spatial-learning. (right) Example mouse trajectories during training days 1, 3, and 5, with detected licks and delivered liquid reward overlayed on the trajectory. Two example trajectories are shown for day 5, including one rewarded trial and one probe trial.
Extended Data Fig. 7
Extended Data Fig. 7. Projector-based VR system for looming reaction comparison.
a, 3D renders of the custom projector-based VR system composed of two HD projectors, a high FOV conical screen, and spherical treadmill. b, Image of a head-fixed mouse running on the spherical treadmill inside the projector-based VR system. c, Communication diagram of the Desktop PC and Unity game engine system for rendering 3D environments onto the dual-projector display. d, Winkel tripel projection of the mouse’s estimated visual field overlayed with the estimated visual field coverage of the projector screen and spherical treadmill.

References

    1. Harvey, C. D., Collman, F., Dombeck, D. A. & Tank, D. W. Intracellular dynamics of hippocampal place cells during virtual navigation. Nature461, 941–946 (2009). - PMC - PubMed
    1. Lasztóczi, B. & Klausberger, T. Hippocampal place cells couple to three different gamma oscillations during place field traversal. Neuron91, 34–40 (2016). - PubMed
    1. Harvey, C. D., Coen, P. & Tank, D. W. Choice-specific sequences in parietal cortex during a virtual-navigation decision task. Nature484, 62–68 (2012). - PMC - PubMed
    1. Keller, G. B., Bonhoeffer, T. & Hübener, M. Sensorimotor mismatch signals in primary visual cortex of the behaving mouse. Neuron74, 809–815 (2012). - PubMed
    1. Sinex, D. G., Burdette, L. J. & Pearlman, A. L. A psychophysical investigation of spatial vision in the normal and reeler mutant mouse. Vis. Res.19, 853–857 (1979). - PubMed

LinkOut - more resources