

Association between platelet-to-red cell distribution width ratio and all-cause mortality in critically ill patients with non-traumatic cerebral hemorrhage: a retrospective cohort study
- PMID: 39669106
- PMCID: PMC11634754
- DOI: 10.3389/fneur.2024.1456884
Association between platelet-to-red cell distribution width ratio and all-cause mortality in critically ill patients with non-traumatic cerebral hemorrhage: a retrospective cohort study
Abstract
Background: The purpose of this study was to investigate the relationship between platelet-to-red cell distribution width ratio (PRR) and all-cause mortality in critically ill patients with non-traumatic cerebral hemorrhage (NCH).
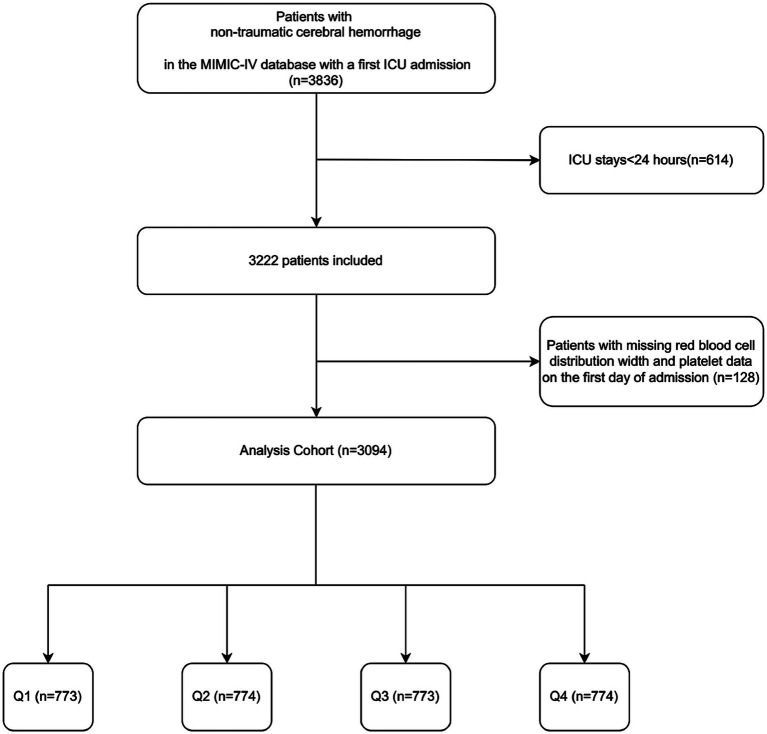
Methods: The Medical Information Mart for Intensive Care (MIMIC-IV) database was used to identify patients with NCH who needed to be admitted to intensive care unit (ICU). The outcomes of the study included both ICU and in-hospital mortality. Restricted cubic splines and Cox proportional hazards regression analysis were used to clarify the relationship between PRR and clinical outcomes in critically ill patients with NCH.
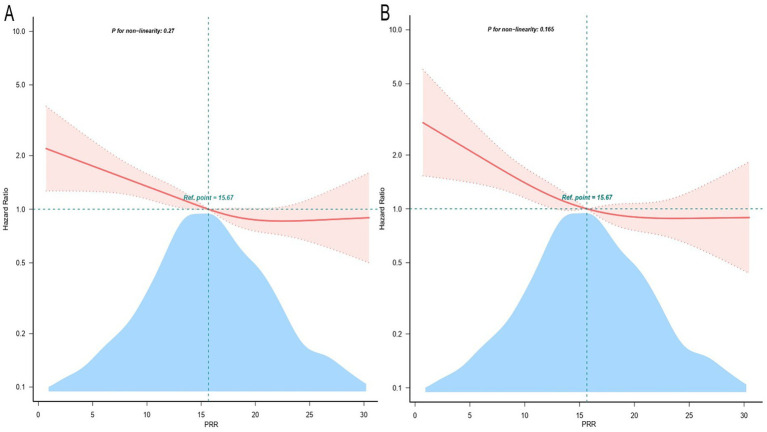
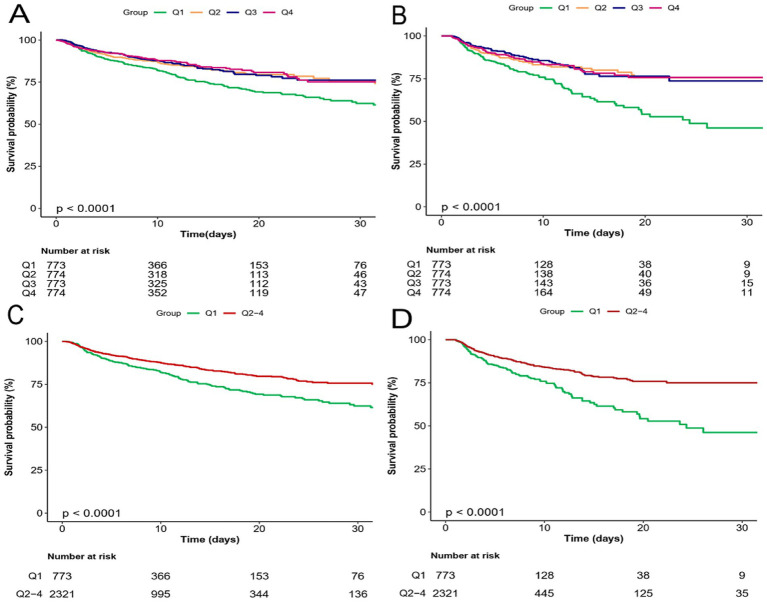
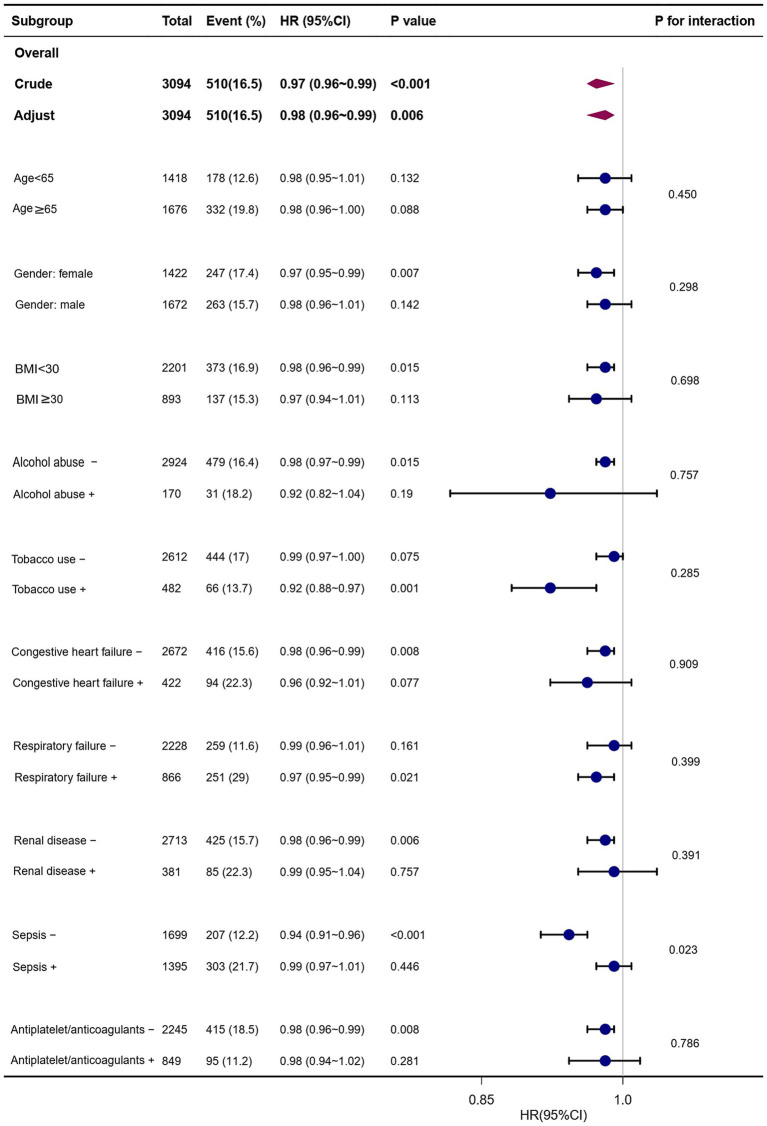
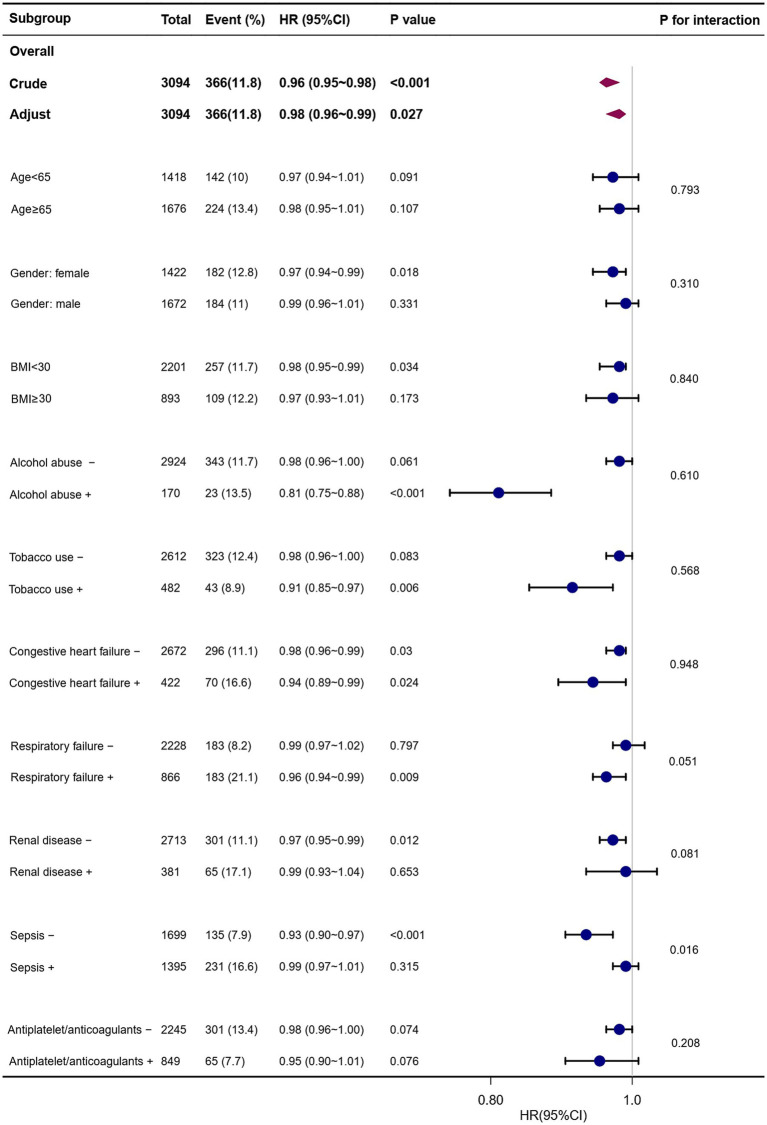
Results: A total of 3,094 patients (54.0% male) were included in the study, with in-hospital mortality and ICU mortality rates of 16.5 and 11.8%, respectively. A substantial correlation was found by multivariate Cox proportional hazards analysis between increased PRR and a lower risk of in-hospital and ICU mortality. Following adjustment for confounding factors, patients with elevated PRR exhibited a significantly decreased risk of in-hospital death (HR, 0.98; 95% CI, 0.96-0.99; p = 0.006) and ICU death (HR, 0.98; 95% CI, 0.96-0.99; p = 0.027). As PRR increased, restrictive cubic splines showed a progressive decrease in the probability of all-cause mortality. Stratified analyses indicated a consistent association between PRR and both in-hospital and ICU mortality.
Conclusion: Among critically ill patients with NCH, lower PRR was substantially correlated with the increased probability of all-cause mortality in both the ICU and hospital. According to this research, PRR might be a valuable indicator for identifying NCH patients at risk of all-cause mortality.
Keywords: MIMIC-IV database; all-cause mortality; critically ill patients; non-traumatic cerebral hemorrhage; platelets to red cell distribution width ratio.
Copyright © 2024 Lu and Wu.
Conflict of interest statement
The authors declare that the research was conducted in the absence of any commercial or financial relationships that could be construed as a potential conflict of interest.
Figures
Similar articles
-
Association between a four-parameter inflammatory index and all-cause mortality in critical ill patients with non-traumatic subarachnoid hemorrhage: a retrospective analysis of the MIMIC-IV database (2012-2019).Front Immunol. 2023 Oct 23;14:1235266. doi: 10.3389/fimmu.2023.1235266. eCollection 2023. Front Immunol. 2023. PMID: 37936706 Free PMC article.
-
The correlation between red cell distribution width to albumin ratio and all-cause mortality in critically ill patients with rheumatic diseases: a population-based retrospective study.Front Med (Lausanne). 2023 Oct 16;10:1199861. doi: 10.3389/fmed.2023.1199861. eCollection 2023. Front Med (Lausanne). 2023. PMID: 37908850 Free PMC article.
-
Association Between High Serum Anion Gap and All-Cause Mortality in Non-Traumatic Subarachnoid Hemorrhage: A Retrospective Analysis of the MIMIC-IV Database.Front Neurol. 2022 Jul 12;13:922099. doi: 10.3389/fneur.2022.922099. eCollection 2022. Front Neurol. 2022. PMID: 35903118 Free PMC article.
-
Association between serum glucose potassium ratio and mortality in critically ill patients with intracerebral hemorrhage.Sci Rep. 2024 Nov 9;14(1):27391. doi: 10.1038/s41598-024-78230-8. Sci Rep. 2024. PMID: 39521806 Free PMC article.
-
Glycemic variability and its association with short and long term clinical outcomes in critically ill patients with cerebral hemorrhage.Sci Rep. 2025 Mar 6;15(1):7820. doi: 10.1038/s41598-025-92415-9. Sci Rep. 2025. PMID: 40050399 Free PMC article.
Cited by
-
The Red Blood Cell Distribution Width to Albumin Ratio Is Associated with in Hospital Mortality and Adverse Outcome in Elderly Chinese Patients with Gastrointestinal Bleeding.J Inflamm Res. 2025 Apr 29;18:5811-5819. doi: 10.2147/JIR.S513844. eCollection 2025. J Inflamm Res. 2025. PMID: 40322531 Free PMC article.
References
-
- Vos T, Lim SS, Afshin A, Alam T, Ashbaugh C, Barthelemy C, et al. . Global burden of 369 diseases and injuries in 204 countries and territories, 1990-2019: a systematic analysis for the global burden of disease study 2019. Lancet. (2020) 396:1204–22. doi: 10.1016/S0140-6736(20)30925-9, PMID: - DOI - PMC - PubMed
-
- Feigin VL, Stark BA, Johnson CO, Roth GA, Bisignano C, Abady GG, et al. . Global, regional, and national burden of stroke and its risk factors, 1990-2019: a systematic analysis for the global burden of disease study 2019. Lancet Neurol. (2021) 20:795–820. doi: 10.1016/S1474-4422(21)00252-0 - DOI - PMC - PubMed
LinkOut - more resources
Full Text Sources
Research Materials