. 2024 Nov 12;1(4):ugae019.
doi: 10.1093/narmme/ugae019. eCollection 2024 Oct.

C9orf72 repeat expansion creates the unstable folate-sensitive fragile site FRA9A

Affiliations

C9orf72 repeat expansion creates the unstable folate-sensitive fragile site FRA9A

Mila Mirceta et al. NAR Mol Med. .

Abstract

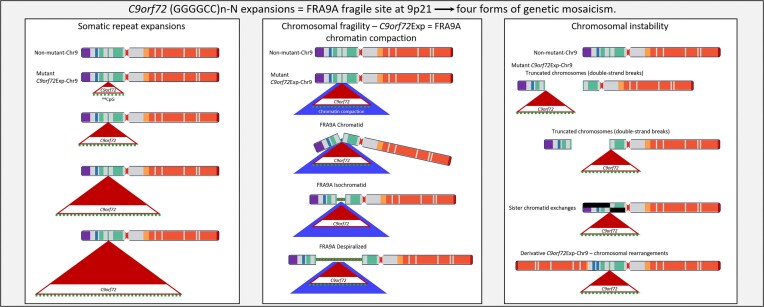
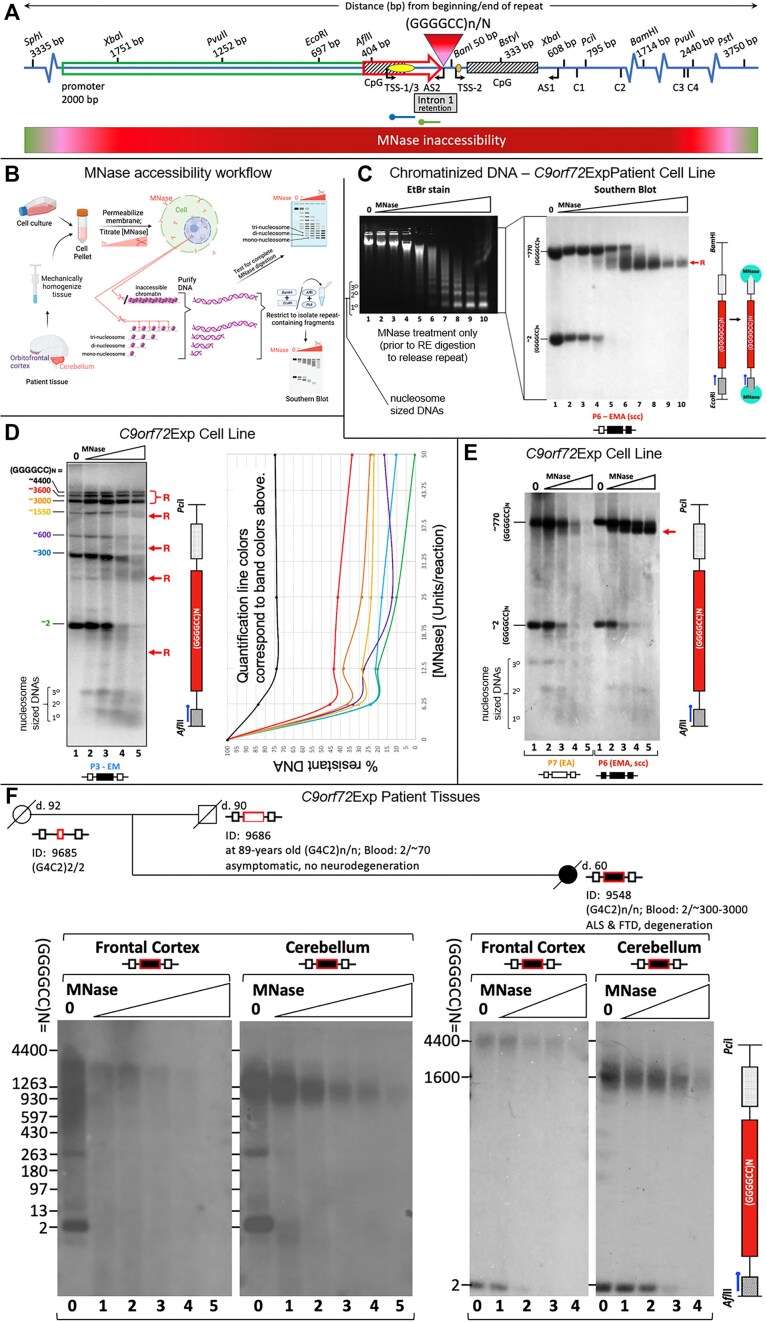
The hyper-unstable Chr9p21 locus, harbouring the interferon gene cluster, oncogenes and C9orf72, is linked to multiple diseases. C9orf72 (GGGGCC)n expansions (C9orf72Exp) are associated with incompletely penetrant amyotrophic lateral sclerosis, frontotemporal dementia and autoimmune disorders. C9orf72Exp patients display hyperactive cGAS-STING-linked interferon immune and DNA damage responses, but the source of immunostimulatory or damaged DNA is unknown. Here, we show C9orf72Exp in pre-symptomatic and amyotrophic lateral sclerosis-frontotemporal dementia patient cells and brains cause the folate-sensitive chromosomal fragile site, FRA9A. FRA9A centers on >33 kb of C9orf72 as highly compacted chromatin embedded in an 8.2 Mb fragility zone spanning 9p21, encompassing 46 genes, making FRA9A one of the largest fragile sites. C9orf72Exp cells show chromosomal instability, heightened global- and Chr9p-enriched sister-chromatid exchanges, truncated-Chr9s, acentric-Chr9s and Chr9-containing micronuclei, providing endogenous sources of damaged and immunostimulatory DNA. Cells from one C9orf72Exp patient contained a highly rearranged FRA9A-expressing Chr9 with Chr9-wide dysregulated gene expression. Somatic C9orf72Exp repeat instability and chromosomal fragility are sensitive to folate deficiency. Age-dependent repeat instability, chromosomal fragility and chromosomal instability can be transferred to CNS and peripheral tissues of transgenic C9orf72Exp mice, implicating C9orf72Exp as the source. Our results highlight unappreciated effects of C9orf72 expansions that trigger vitamin-sensitive chromosome fragility, adding structural variations to the disease-enriched 9p21 locus, and likely elsewhere.


Figures

Graphical Abstract
Graphical Abstract
Figure 1.
Figure 1.
The 9p21 neighborhood, associated genes, diseases and instability hotspots. See the text.
Figure 2.
Figure 2.
DNA sequence, structure, topological-associated domain (TAD), CpG island and Repli-Chip analysis for all 10 CGG-FSFS. (A) Boxplots comparing average %GC, helix twist, propeller twist, major groove width (MGW), SNS-seq (short nascent strand sequencing) signal and number of origins of replication initiation (ORIs) at CGG/CCG-mapped FSFS and C9orf72 versus 944 control genome-wide CGG/GGC repeats, calculated for windows ±50 kb and ±500 kb from the repeat center. Control repeat regions were further separated as genic or non-genic based on overlap with an annotated transcript. Median repeat length for FSFS is 8.7; all FSFS have GC content of 100% (AT = 0 except FRAXF, GC = 0.826). Repeat length req of >4.5 for 944 CGG/CCG control regions yielded a median length of 8.7, same as mapped FSFS. Asterisk denotes significance based on a two-sided Wilcoxon test (*P < 0.05; **P < 0.01). Each individual FSFS is represented as a black dot. The C9orf72 (GGGGCC)n is represented by a red dot. (B and C) Topological domain, DNA replication timing tracks, CpG islands and CTCF sites for the contiguous FRAXA, FRAXE and FRAXF compared to the same for C9orf72. Shown are the contour density plots depicting the number of CTCF sites and CpG-islands in 100 kb windows centered on the repeat, representing boundaries with normal-length, matched repeats. Repli-seq data were obtained in bigwig format (GSE61972). H1 ESC = H1 Embryonic Stem Cells; accession:ENCFF000KUF; NP = Neuronal progenitor cells (BG01 Fibroblast-derived); accession:ENCFF907YXU; LCL = GM06990 lymphoblastoid cells; accession:ENCFF000KUA. Early (positive) and late (negative) replication was determined by subtracting the genome-wide median score from all values. To conserve space, only the FSFS gene is indicated, while other UCSC genes are condensed into one line. (D) Summary of enrichment of each fragile site (indicated in blue fonts) for CpG islands and CTCF sites. Points are colored according to density. For analyses of FRA2A, FRA7A, FRA10A, FRA11A, FRA11B, FRA12A and FRA16A, see Supplementary Figure S1.
Figure 3.
Figure 3.
C9orf72Exp cells, repeat lengths, CpG-methylation and disease state. (A) ALS/FTD families with Southern blot vertically aligned for each individual. Females are represented by circles, males by squares, and disease state is as per the insert legend. Colors of text and boxes around symbols indicate the expansion, methylation and affected status for each sample. Percentages of cells showing FRA9A expression are indicated for each individual in the pedigree. ‘P#’ refers to patient number, ‘E’, ‘M’ and ‘A’ refer to Expanded, Methylated and Affected, is summarized at right, and this coding system is used throughout the text. Southern blot of C9orf72 (GGGGCC)n repeat expansion (‘Materials and methods’ section) used EcoRI/BamHI to release the repeat-containing fragment leaving 697 and 1714 bp upstream and downstream of the (GGGGCC)n/N repeat. (B) Schematic of Southern blot probe location, CpG-methylation status at the GGGGCC repeat and CpG-islands (filled boxes denote methylation). For raw CpG methylation data, see Supplementary Figure S2.
Figure 4.
Figure 4.
C9orf72Exp causes FRA9A folate-sensitive fragile site that maps across 9p21. (A) Fragile site forms (indicated), with examples of non-fragile chromosomes from the same metaphase spreads. Showing DAPI-stained and paired FISH-probed chromosomes from FUdR-treated cells. 9q-arm FISH probe (9q32∼34.11; RP11-696J10) in green. FISH probe #2 at C9orf72 (panel D–F) in red. Magnification is the same for all chromosome images within each panel, facilitating comparison within the panel. Control Chr9 in upper left of panel (A) is from the same metaphase as the leftmost isochromatid Chr9. Full metaphase spreads can be provided upon request. Notably, the control ‘No fragile site’ Chr9 in lower left of panel A is from the same metaphase as the leftmost ‘Despiralized/stretched’ Chr9, revealing the lengthening of the stretched Chr9. (B) Representative example of the same chromosome (same magnification) with or without indicated FISH probes. (C) Two representative examples (same magnification) of isochromatids with FISH signal of C9orf72-containing probe 4 split over the fragile site. (D) 9p21 location of FISH probes with regional summary of fragile site location. (E) Quantification of fragility for formula image100 metaphases under two folate-stressed conditions. (D) Cells were described in Figure 3. (F) Fragile site breakage regions calculated from number of breaks relative to FISH signal found centromeric, telomeric or spanning across probes used. Percentage of telomerically located FISH signal relative to the break is on the bottom row. Frequencies of probes found spanning or on each side of the break were used to calculate the percent breakage within each region in panel (D).
Figure 5.
Figure 5.
C9orf72Exp locus is MNase-inaccessible. (A) Schematic of the region of unusual chromatin organized as determined by MNase accessibility analysis in C9orf72-ALS patient cells and brain regions. C9orf72 (GGGGCC)n-N repeat, CpG-islands (hatched boxes), long-2 kb and intermediate 435 bp promoters (green and red arrows, respectively), exons 1a (yellow dot) and 1b (orange dot), sense and antisense transcription start sites, restriction sites with distances from the beginning and end of the (GGGGCC)N tract, and probes for upstream (green) and downstream (blue) mapping of MNase accessibility. Cryptic splice site transcripts C1-C4 derived from the C9orf72Exp allele are indicated with their distance from the end of the repeat tract (42,45). (B) Workflow for MNase assay. (C) MNase treatment of chromatinized DNA from a cell line (P6) with a large methylated C9orf72Exp that had undergone single-cell cloning (scc) to isolate a single expanded allele, ensuring a single expansion size and facilitating clarity. EtBr staining of the MNase-treated DNA reveals over-digestion of the DNA to mono-, di- and tri-nucleosomal, sized fragments. The same DNA was digested with EcoRI/BamHI, to release the repeat fragment having 697 bp upstream and 1714 bp downstream of the repeat, then assessed by Southern blotting using the blue probe. Resistance of only the expanded allele occurs, even at high concentration of MNase (200U). Red ‘R’ indicates the region with reduced MNase accessibility that is about to lose the probed region indicated in the schematic at right. (D) Sample P3 with a mixture of heterogeneous repeat allele lengths shows that with increasing repeat size, MNase accessibility is decreased, as quantified by densitometric analysis for each allele size (colours coordinate between graph and Southern blot). In panels D–F the repeat was released with AflII/PciI, leaving 404 bp upstream and 689 bp downstream allowing increased resolution. NB, van Blitterswijk uses XbaI/XbaI to release the repeat, leaving 1751 bp upstream and 608 bp downstream of the repeat, the greater amount of flanking sequence reduces electrophoretic resolution. (E) Methylation is associated with increased MNase inaccessibility as assessed in cell lines (P6 [ssc] and P7) containing similar sized repeats but differing methylation status. The non-expanded allele is digested at the same rate in both lines. (F) MNase treatment of post-mortem (orbito)frontal cortex and cerebellum from an asymptomatic 90-year-old father and his ALS-FTD-affected daughter, previously deep-phenotyped for lifestyle choices, clinical, neuropathological and molecular biomarkers (29,70) (summarized in Supplementary Table S2). MNase concentrations are doubled between each lane (2.5U in lane 2 up to 40U). Expanded allele in both tissues is MNase resistant relative to the equimolar non-expanded allele, which serves as an internal control. See Supplementary Figure S4 for MNase controls and mapping experiments.
Figure 6.
Figure 6.
C9orf72Exp cells display chromosomal instability. (A) Quantification of MN and NBuds in binucleated cells without FISH, left, and with C9orf72 and 9q-FISH probes, middle, in WT and C9orf72Exp cells (P6 (ssc) and P7) containing similar sized repeats (∼770) but differing methylation status. Data are means of two independent experiments. Dots show data of each experiment. Statistical analyses using Fisher’s exact test (*P < 0.05, **P < 0.01, ***P < 0.001). Representative images of MN and NBuds in cytokinesis-blocked cells treated with FUdR for 24 h that contain no FISH signal (hollow arrows), a C9orf72-signal (red arrows) or 9q-signal (green arrows). (B) Depending upon site of breakage, C9orf72-FISH probes can have varying interpretations, left. Example of bona fide chromosome breaks in C9orf72Exp line P4 with acentric terminal C9orf72-containing fragment in same metaphase spread as a truncated-Chr9 that is free of C9orf72-signal, middle. Example of truncated-Chr9 with C9orf72-signal, and control Chr9 from same spread, right. (C) Levels of global SCEs in WT and C9orf72Exp cells ± FUdR. Methylation/clinical status is as per Figure 3. Each datapoint represents a single metaphase. At least 100 mitotic cells were analyzed per condition in each experiment. Statistical analyses were performed by Student’s t-test (P < 0.01). NS: not significant. See also Supplementary Figure S6B and D. (D) C9orf7Exp line P8 with complex highly rearranged derivative-Chr9, schematic, see text and Supplementary Figure S7A. (E) Example of FRA9A-expressing derivative-Chr9 and control Chr9 in same spread with C9orf72- (red) and 9q-FISH probes (green) (100% = 100/100 metaphases). (F) Only the derivative-Chr9 expresses FRA9A coincident with the C9orf72-FISH signal, revealing derivative-Chr9 to be the C9orf72Exp-Chr9, (+FUdR, 7% = 7/100, 99% confidence). (G) Breakpoint analysis (top) and gene expression (binned/gene) along Chr9 in each of the C9orf72 Exp cells with trisomic (red dots) and monosomic (blue dots) in duplicated and deleted regions of the derivative-Chr9 (P8). Breakpoint and copy number change analysis in P8 was by whole genome sequencing, see Supplementary Table S3. An interactive html file detailing mis-expressed genes can be accessed here https://data.cyverse.org/dav-anon/iplant/home/ljsznajder/FRA9A/Chromosome9.html), also presented in Supplementary Table S4. See Supplementary Figure S7B–D for statistical significance of differential gene expression.
Figure 7.
Figure 7.
C9orf72 repeat instability, chromosomal fragility and chromosomal instability in C9orf72Exp-Tg-mice. Southern blots for C9orf72 transgene in C9-500 mouse tissues. C9-500 mouse tissues were sized for repeat size via Southern blot in three C9orf72Exp Tg-mice. The tail was the most stable tissue. (A) Somatic repeat instability by Southern blots in tissues of three 5-month-old C9orf72Exp-Transgenic mice harboring a single copy of the human C9orf72 gene with a GGGGCC expansion integrated into murine Chr6 (156). (B) Cells isolated from tissues of the mice shown in panel (A) were grown for 1–4 weeks sufficient for metaphase spreads for fragility analysis with 1 μM FUdR with FISH analysis. A murine-specific green probe identified mouse Chr6, and human-specific red probe identified the C9orf72Exp transgene. Pictured are FSFS in the CNS (i), the periphery (ii) and quantified in panel (iii). (C) Chromosomal instability at the C9orf72Exp transgene was assessed in the same tissues used in panel (C), using the same FISH probes.

Update of

References

    1. Atanasio A., Decman V., White D., Ramos M., Ikiz B., Lee H.-C., Siao C.-J., Brydges S., LaRosa E., Bai Y. et al. C9orf72 ablation causes immune dysregulation characterized by leukocyte expansion, autoantibody production, and glomerulonephropathy in mice. Sci. Rep. 2016; 6:23204. - PMC - PubMed
    1. Breevoort S., Gibson S., Figueroa K., Bromberg M., Pulst S. Expanding clinical spectrum of C9ORF72-related disorders and promising therapeutic strategies: a review. Neurol. Genet. 2022; 8:e670. - PMC - PubMed
    1. Fredi M., Cavazzana I., Biasiotto G., Filosto M., Padovani A., Monti E., Tincani A., Franceschini F., Zanella I. C9orf72 intermediate alleles in patients with amyotrophic lateral sclerosis, systemic lupus erythematosus, and rheumatoid arthritis. Neuromol. Med. 2019; 21:150–159. - PubMed
    1. McCauley M.E., O’Rourke J.G., Yáñez A., Markman J.L., Ho R., Wang X., Chen S., Lall D., Jin M., Muhammad A.K.M.G. et al. C9orf72 in myeloid cells suppresses STING-induced inflammation. Nature. 2020; 585:96–101. - PMC - PubMed
    1. Miller Z.A., Sturm V.E., Camsari G.B., Karydas A., Yokoyama J.S., Grinberg L.T., Boxer A.L., Rosen H.J., Rankin K.P., Gorno-Tempini M.L. et al. Increased prevalence of autoimmune disease within C9 and FTD/MND cohorts: completing the picture. Neurol. Neuroimmunol. Neuroinflamm. 2016; 3:e301. - PMC - PubMed