. 2024 Nov 28:14:1485580.
doi: 10.3389/fonc.2024.1485580. eCollection 2024.

Lactylation-related gene signature accurately predicts prognosis and immunotherapy response in gastric cancer

Affiliations

Lactylation-related gene signature accurately predicts prognosis and immunotherapy response in gastric cancer

Xuezeng Sun et al. Front Oncol. .

Abstract

Background: Gastric cancer (GC) is a malignant tumor associated with significant rates of morbidity and mortality. Hence, developing efficient predictive models and directing clinical interventions in GC is crucial. Lactylation of proteins is detected in gastric cancer tumors and is linked to the advancement of gastric cancer.

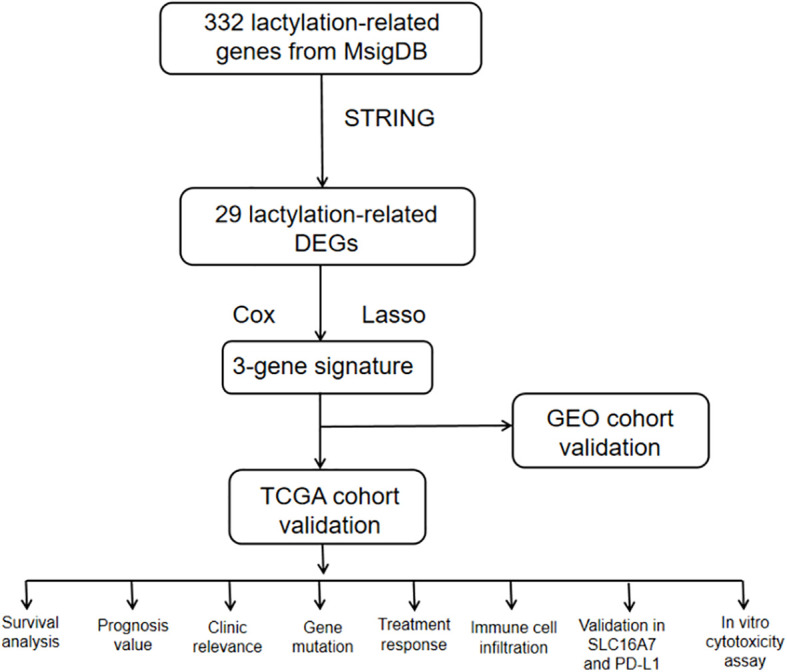
Methods: The The Cancer Genome Atlas (TCGA) was utilized to analyze the gene expression levels associated with lactylation. A genetic pattern linked to lactylation was created using Univariate Cox regression and least absolute shrinkage and selection operator (LASSO) regression. The predictive ability of the model was evaluated and confirmed in the Gene Expression Omnibus (GEO) cohort, where patients were divided into two risk groups based on their scores. The study examined the relationship between gene expression and the presence of immune cells in the context of immunotherapy treatment. In vitro cytotoxicity assays, ELISA and PD-1 and PD-L1interaction assays were used to assess the expression of PD-L1 while knocking down SLC16A7.

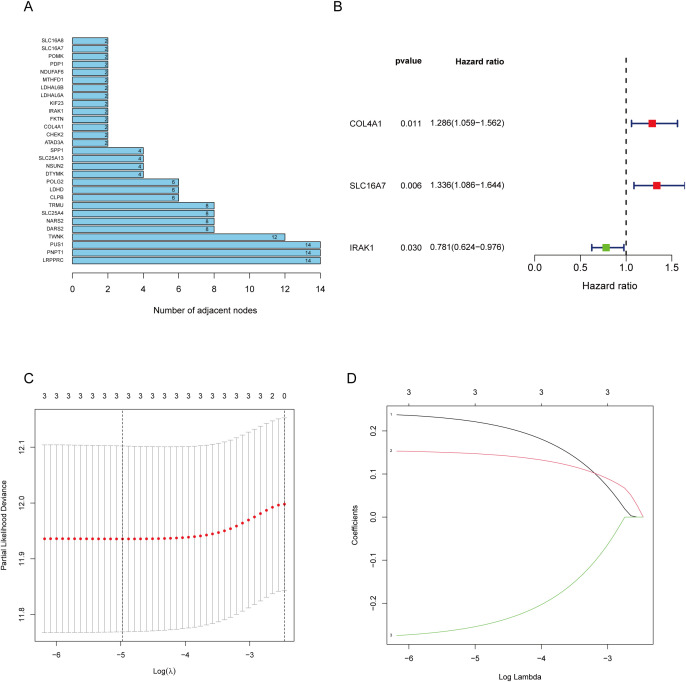
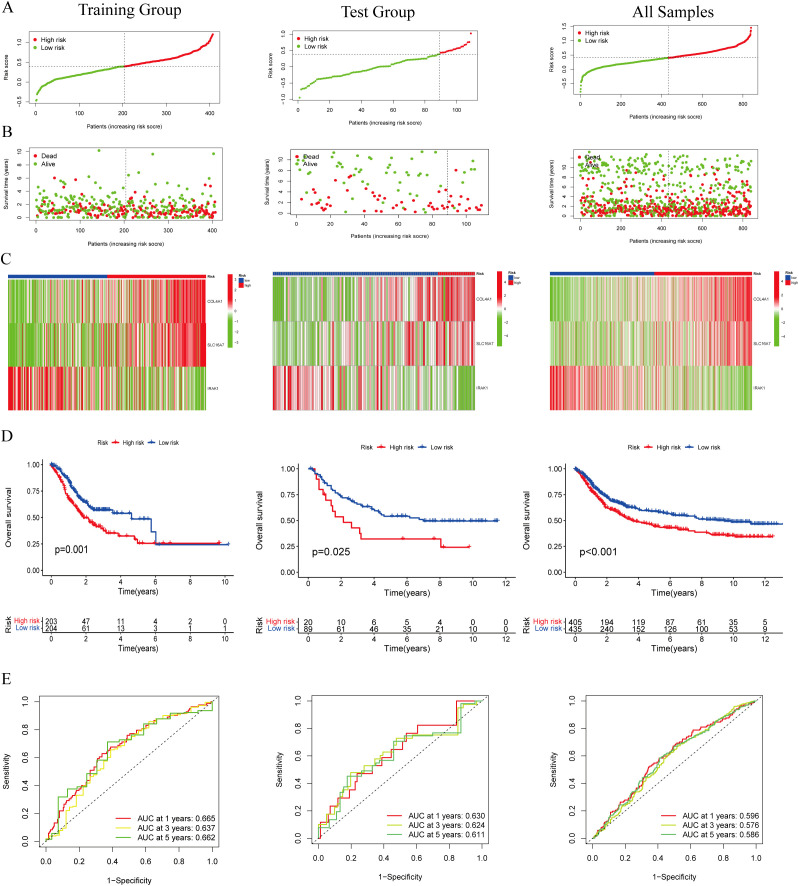
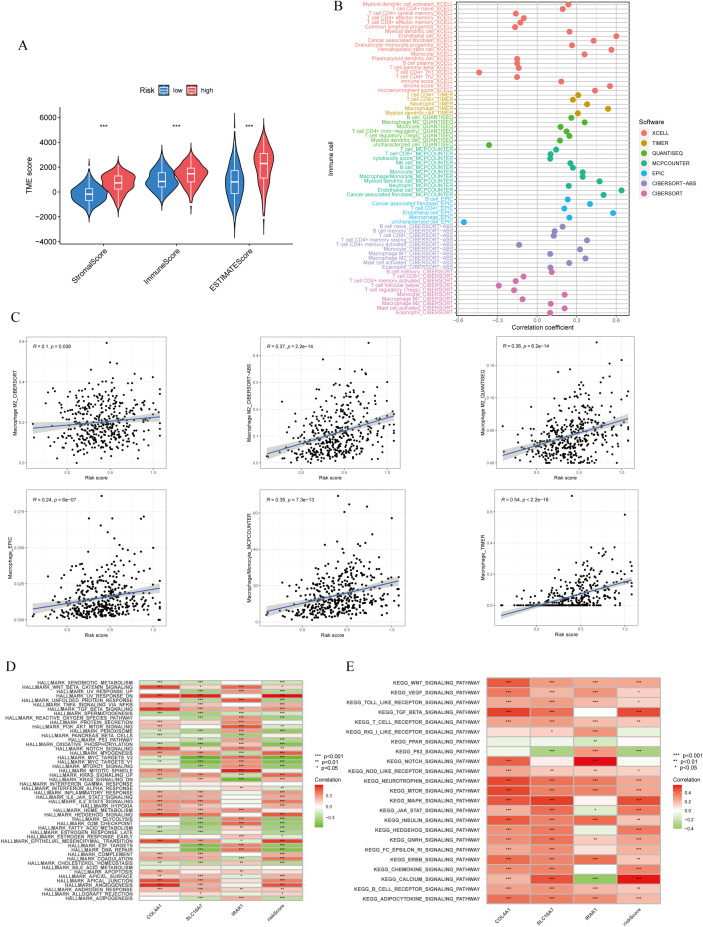
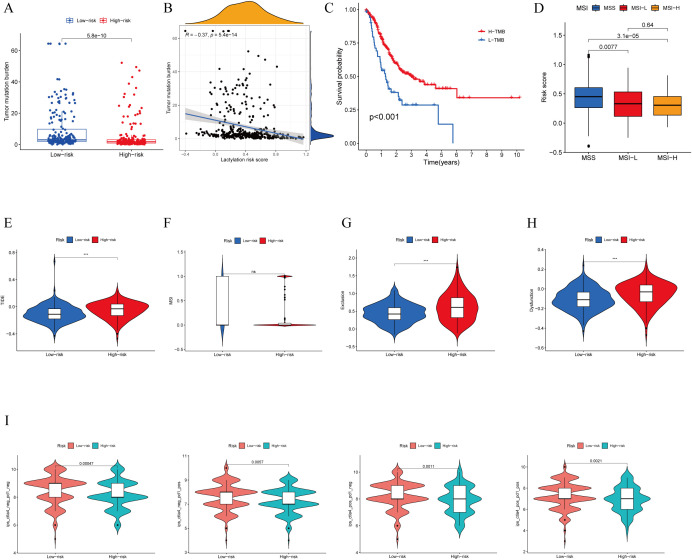
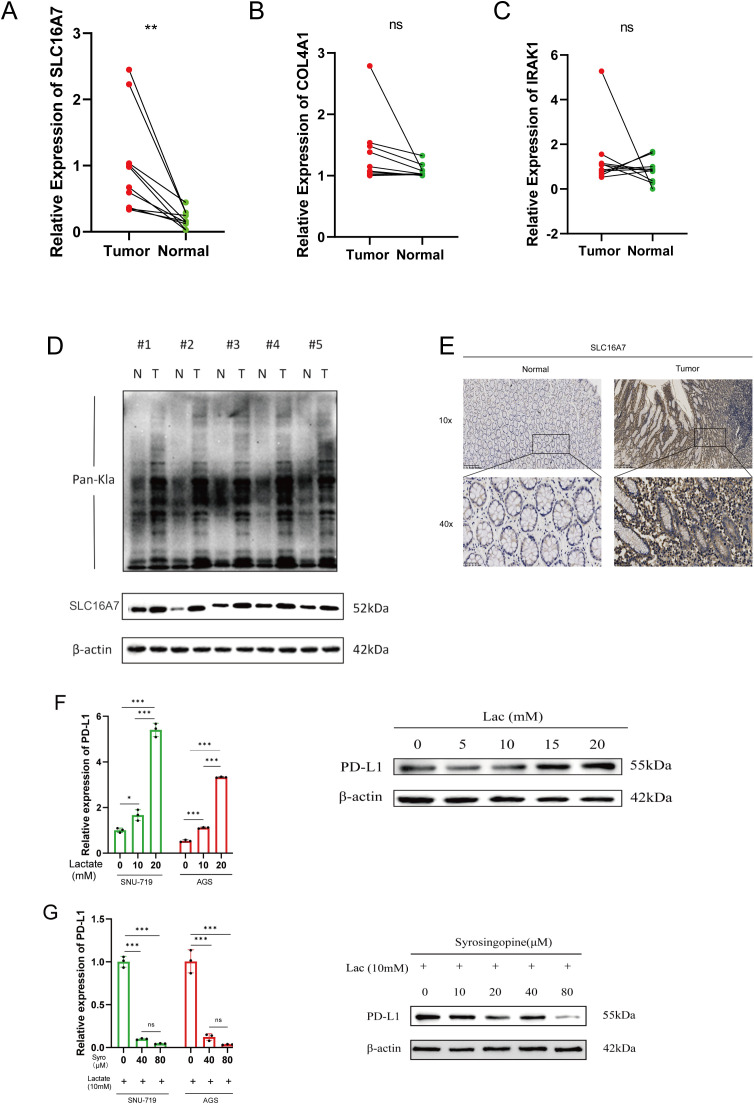
Results: 29 predictive lactylation-related genes with differential expression were discovered. A signature consisting of three genes was developed and confirmed. Patients who had higher risk scores experienced worse clinical results. The group with lower risk showed increased Tumor Immune Dysfunction and Exclusion (TIDE) score and greater responsiveness to immunotherapy. The tumor tissues secrete more lactate acid than normal tissues and express more PD-L1 than normal tissues, that is, lactate acid promotes the immune evasion of tumor cells. In GC, the lactylation-related signature showed strong predictive accuracy. Utilizing both anti-lactylation and anti-PD-L1 may prove to be an effective approach for treating GC in clinical settings. We further proved that one of the lactate metabolism related genes, SCL16A7 could promote the expression of PD-L1 in GC cells.

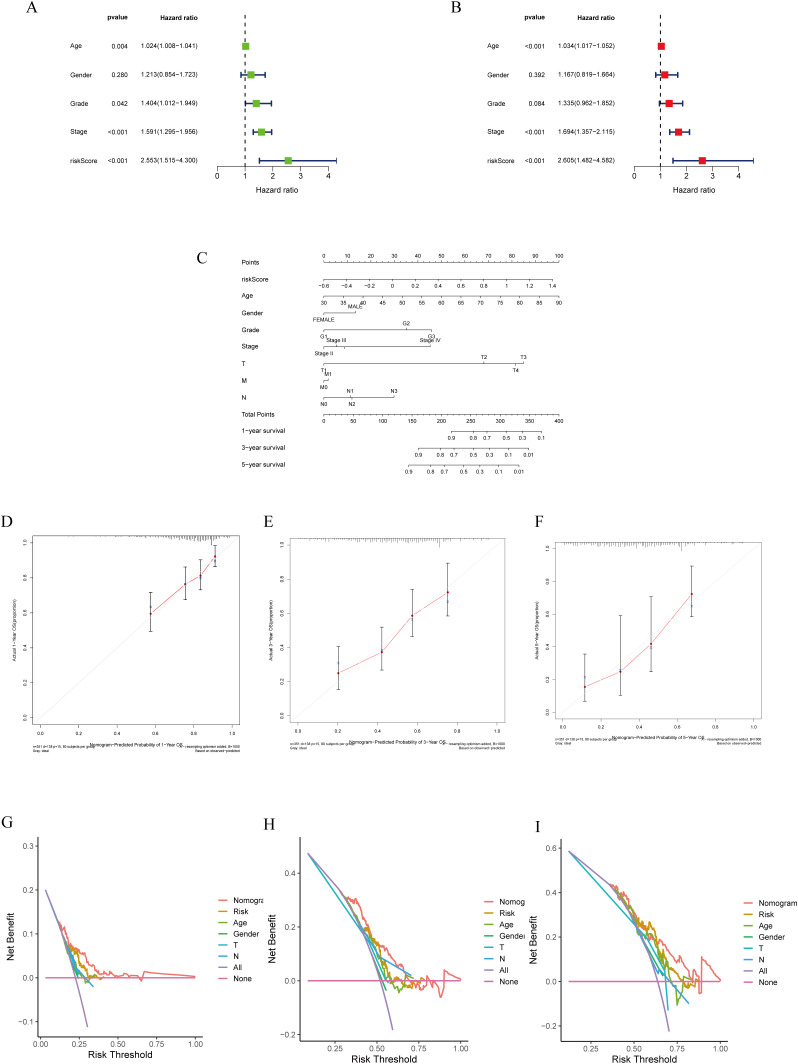
Conclusion: The risk model not only provides a basis for better prognosis in GC patients, but also is a potential prognostic indicator to distinguish the molecular and immune characteristics, and the response from Immune checkpoint inhibitors (ICI) therapy and chemotherapy in GC.

Keywords: PD-L1; gastric cancer; immunotherapy; lactylation-related genes; prognostic signature.


Conflict of interest statement

The authors declare that the research was conducted in the absence of any commercial or financial relationships that could be construed as a potential conflict of interest.

Figures

Figure 1
Figure 1
The workflow of study.
Figure 2
Figure 2
Screening of genes via STRING and filtrating lactylation-related genes. (A) 229 genes selected by STRING and their relationships. (B) Univariate Cox regression analysis to screen 29 prognosis-related genes. (C, D) LASSO coefficient curves of prognosis-related genes.
Figure 3
Figure 3
Evaluation of the lactylation-related genes signature in the TCGA-STAD and GEO cohort. (A, B) The distribution of the risk scores and scatter plots of survival in patients in the training group, text group, and all samples. (C) Prognostic signature signal heatmaps in the different group (D) The Kaplan-Meter curve analysis of the low-and –high-risk groups in the different group. (E) Receiver operating characteristics (ROC) curve analysis of the signature in the different group.
Figure 4
Figure 4
Construction of a nomogram model integrated with the risk score. (A, B) Univariate and multivariate Cox analyses included different clinicopathologic features. (C) Nomogram model for predicting the 1-, 3-, and 5 –year OS of GC patients. (D–F) The calibration plots for 1-, 3- and 5 years in the TCGA-STAD. (G–I) Decision curve for nomogram 1-, 3- and 5- years in the TCGA-STAD.
Figure 5
Figure 5
Immune cells infiltration and function enrichment analysis. (A) Correlation between lactylationscore and the tumor microenvironment of gastric cancer assessed using the ESTIMATE algorithm. (B, C) The correlation between lactylation score and immune cell infiltration by various immunocytes analysis methods. (D, E) GSVA analysis of lactylation score and lactylation-related genes. *p<0.05; **p<0.01;***p<0.001.
Figure 6
Figure 6
TMB, immune evasion and ICIs. (A) TMB score in different lactylation score subgroups and (B) the correlation between TMB, high-/low-risk groups (C) Kaplan-Meier curve and log-rank test comparethe OS of patients with low or high TMB score. (D) Relationship between lactylation score and MSI. (E–H) TIDE, MSI, T cell exclusion, and T cell dysfunction, in different lactylation score subgroups,respectively. (I) The vioplot of the different expressions of CTLA4 and PD-1 between different lactylation-score groups. ***p<0.001 ns: no significance.
Figure 7
Figure 7
Validation of differentialy expressed genes. (A–C) Evaluation of the expression of lactylation-related genes in GC tissues. (D) Evaluation of the lactylation levels of paired tumor and normal samples, as well as the expression of SLC16A7 within them. (E) SLC16A7 IHC staining in normal and tumor tissues. (F) The expression of PD-L1 in gastric cancer cell lines after adding gradient concentration of exogenous lactate acid. (G) The expression of PD-L1 in gastric cancer cels after adding 10mM lactate acid and gradient concentration of syrosingopine. *p<0.05;** p<0.01***p<0.001,ns, no significance; Lac, lactate acid; mM, mmol/L; μM, μmol/L.
Figure 8
Figure 8
SLC16A7 regulates PD-L1 and in vitro cytotoxicity assay. (A) Western blot of SLC16A7 knockdown SNU-719 and AGS cells. (B, C) T cell-mediated tumor cell killing assay in SLC16A7 knockdown SNU-719 and AGS cells. Representative phase, red fluorescence (dead cells), and green fluorescence (GFP/live cells) merged images are shown. (D) Fluorescence microscopy showing the interaction between PD-L1 and PD-1. Representative phase, blue fluorescence (nucleus), and green fluorescence (green fluorescent-labeled PD-1/Fc protein) merged images of SLC16A knockdown in the SNU-719 and AGS cell. (E) ELISA analysis on IFN-γ, TNF-α and GzmB of supernatant after co-culture T cells with SNU-719 and AGS cell. **p<0.01; ***p<0.001; **** p<0.0001.

References

    1. Bray F, Ferlay J, Soerjomataram I, Siegel RL, Torre LA, Jemal A, et al. . Global cancer statistics 2018: GLOBOCAN estimates of incidence and mortality worldwide for 36 cancers in 185 countries. CA Cancer J Clin. (2018) 68:394–424. doi: 10.3322/caac.21492 - DOI - PubMed
    1. Siegel RL, Miller KD, Fuchs HE, Jemal A. Cancer statistics. Ca-a Cancer J Clin. (2021) 71:7–33. doi: 10.3322/caac.21654 - DOI - PubMed
    1. Allemani C, Matsuda T, Di Carlo V, Harewood R, Matz M, Niksic M, et al. . Global surveillance of trends in cancer survival 2000-14 (CONCORD-3): analysis of individual records for 37 513 025 patients diagnosed with one of 18 cancers from 322 population-based registries in 71 countries. Lancet. (2018) 391:1023–75. doi: 10.1016/s0140-6736(17)33326-3 - DOI - PMC - PubMed
    1. Feng F, Tian Y, Xu G, Liu Z, Liu S, Zheng G, et al. . Diagnostic and prognostic value of CEA, CA19-9, AFP and CA125 for early gastric cancer. BMC Cancer. (2017) 17(1):737. doi: 10.1186/s12885-017-3738-y - DOI - PMC - PubMed
    1. Xiao S, Zhou L. Gastric cancer: Metabolic and metabolomics perspectives. Int J Oncol. (2017) 51:5–17. doi: 10.3892/ijo.2017.4000 - DOI - PubMed

LinkOut - more resources