. 2024 Oct 15;27(12):111128.
doi: 10.1016/j.isci.2024.111128. eCollection 2024 Dec 20.

Humoral correlates of protection against Mycobacterium tuberculosis following intravenous BCG vaccination in rhesus macaques

Affiliations

Humoral correlates of protection against Mycobacterium tuberculosis following intravenous BCG vaccination in rhesus macaques

Edward B Irvine et al. iScience. .

Abstract

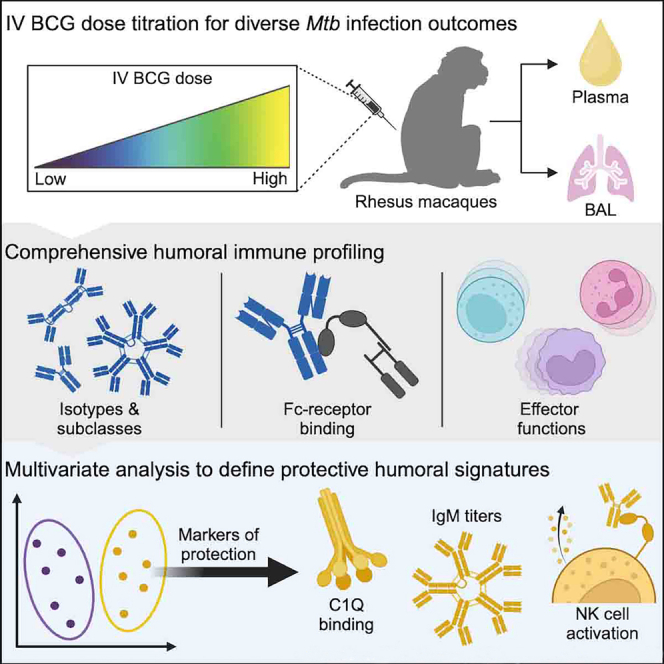
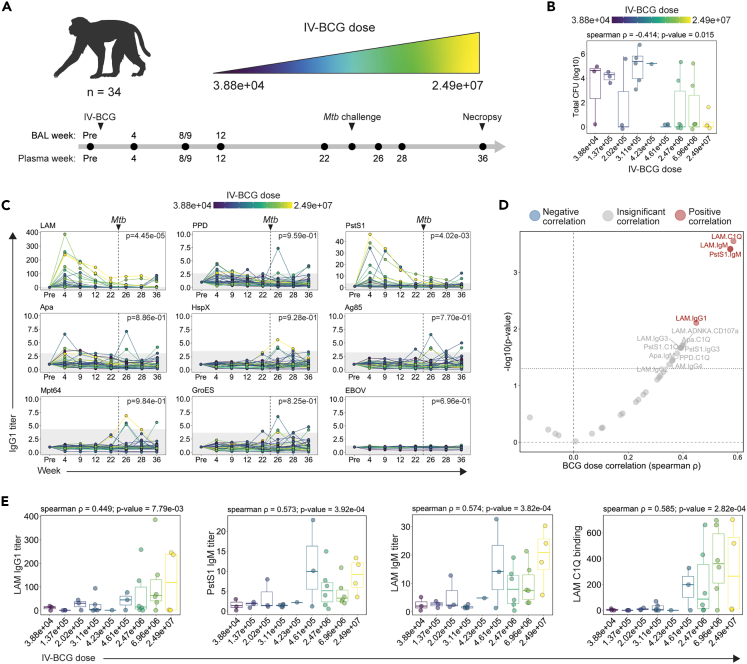
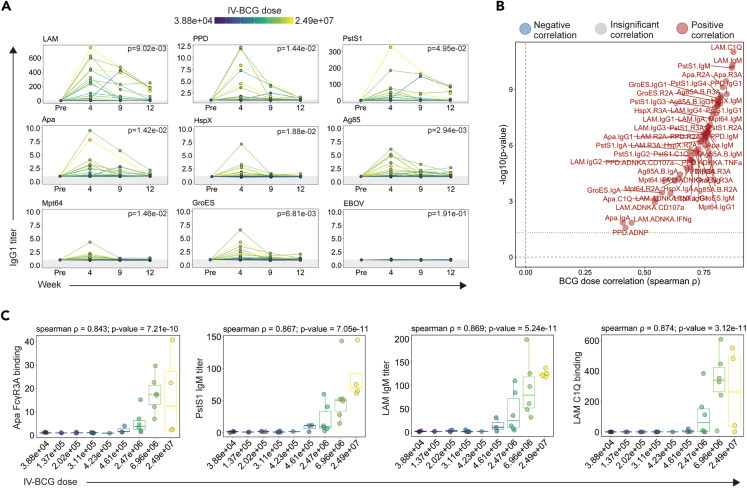
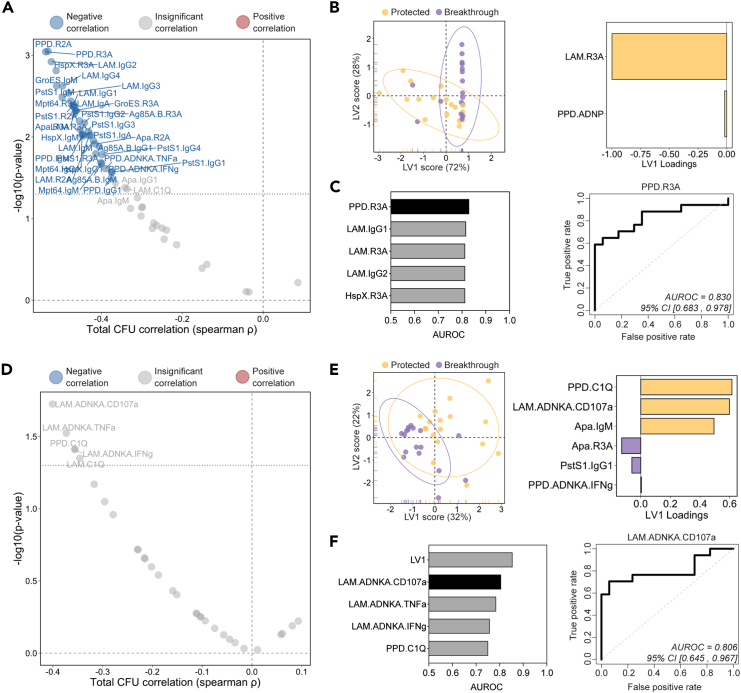
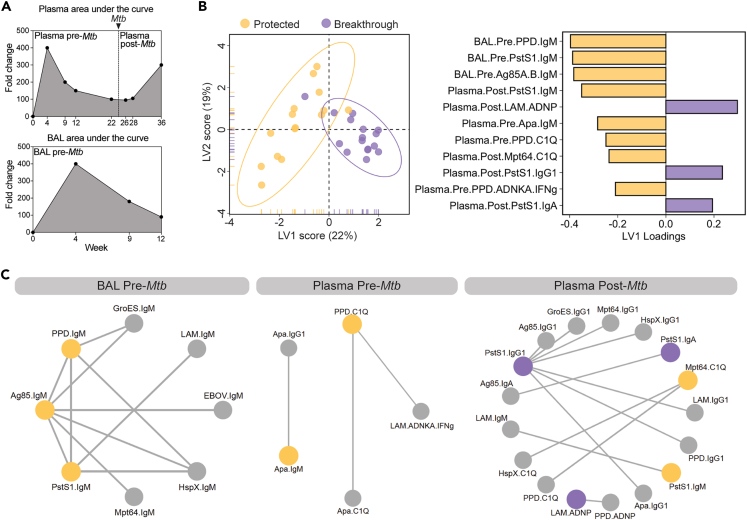
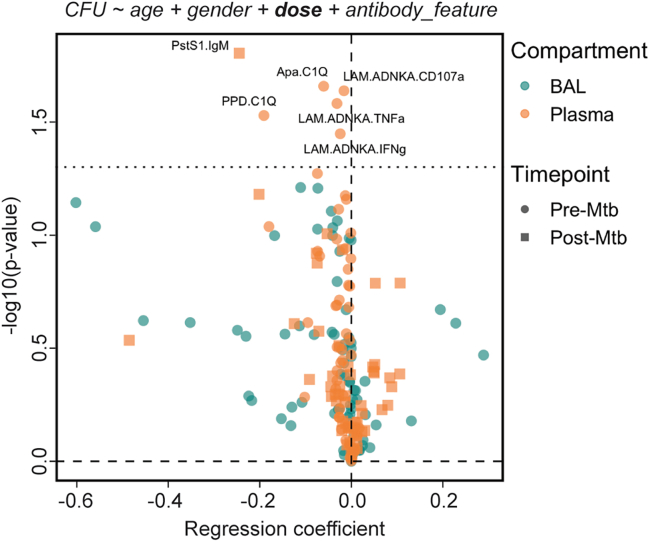
Altering Bacille Calmette-Guérin (BCG) immunization from low-dose intradermal (i.d.) to high-dose intravenous (i.v.) vaccination provides a high level of protection against Mycobacterium tuberculosis (Mtb). In addition to strong T cell immunity, i.v. BCG drives robust humoral immune responses that track with bacterial control. However, given the near-complete protection afforded by high-dose i.v. BCG immunization, a precise correlate of protection was difficult to define. Here we leveraged plasma and bronchoalveolar lavage fluid (BAL) from a cohort of rhesus macaques that received decreasing doses of i.v. BCG and aimed to define correlates of immunity following Mtb challenge. We show an i.v. BCG dose-dependent induction of mycobacterial-specific humoral immune responses. Antibody responses at peak immunogenicity predicted bacterial control post-challenge. Multivariate analyses revealed antibody-mediated complement and natural killer (NK) cell-activating humoral networks as key signatures of protective immunity. This work extends our understanding of humoral biomarkers and potential mechanisms of i.v. BCG-mediated protection against Mtb.

Keywords: Health sciences; Immunology; Pathophysiology.


Conflict of interest statement

G.A. is an employee of Moderna Therapeutics and an equity holder in SeromYx Systems and Leyden Labs.

Figures

None
Graphical abstract
Figure 1
Figure 1
Study design and impact of i.v. BCG dose on plasma antibody responses (A) 34 rhesus macaques were vaccinated with i.v. BCG at doses ranging from 3.88 × 104 to 2.49 × 107 CFUs. Macaques were challenged with 4–17 CFUs of Mtb Erdman 24 weeks following vaccination. Plasma and bronchoalveolar lavage fluid (BAL) were collected at multiple time points during the vaccination and infection phase for analysis. Week 8/9 indicates that samples were collected either 8 or 9 weeks following vaccination. Week 9 is used in future figures for simplicity. Figure created using BioRender.com. (B) Total Mtb CFU measured at necropsy in each macaque. Boxes represent the interquartile range. The whiskers extend to the smallest and largest values within 1.5 times of the interquartile range. Spearman correlation between log10(total Mtb CFU) and i.v. BCG dose indicated. (C) Fold change in IgG1 titers to various antigens in the plasma following i.v. BCG vaccination. Fold changes were calculated as fold change in Luminex median fluorescence intensity (MFI) over the pre-vaccination level for each macaque. Macaques are colored by i.v. BCG dose, and each point represents the duplicate average from a single macaque. Dashed vertical line indicates the time of Mtb challenge. Gray shaded area is the background level set to 2 standard deviations above the mean MFI of the pre-vaccination samples. A mixed-effects model was applied to assess the impact of vaccine dose on antibody titers over time. The model p values, indicating the significance of the dose effect, are displayed in the top right corner. (D) Spearman correlations between i.v. BCG dose and each plasma antibody measurement collected at peak immunogenicity (week 4). Antibody features with low signal (average fold change less than 1.25) were removed prior to i.v. BCG dose correlation analysis. Black dotted horizontal line indicates unadjusted p value of 0.05. Red and blue dots represent antibody features with a significant positive or negative correlation with i.v. BCG dose, respectively, following multiple testing correction (Benjamini-Hochberg adjusted p value <0.05). (E) Spearman correlations between selected plasma antibody features at peak immunogenicity (week 4) and i.v. BCG dose. Boxes represent the interquartile range. The whiskers extend to the smallest and largest values within 1.5 times of the interquartile range.
Figure 2
Figure 2
Impact of i.v. BCG dose on BAL antibody responses (A) Fold change in IgG1 titers to various antigens in the BAL following i.v. BCG vaccination. Fold changes were calculated as fold change in Luminex MFI over the pre-vaccination level for each macaque. Macaques are colored by i.v. BCG dose, and each point represents the duplicate average from a single macaque. Gray shaded area is the background level set to 2 standard deviations above the mean MFI of the pre-vaccination samples. A mixed-effects model was applied to assess the impact of vaccine dose on antibody titers over time. The model p values, indicating the significance of the dose effect, are displayed in the top right corner. (B) Spearman correlations between i.v. BCG dose and each plasma antibody measurement collected at peak immunogenicity (week 4). Antibody features with low signal (average fold change less than 1.25) were removed prior to i.v. BCG dose correlation analysis. Black dotted horizontal line indicates unadjusted p value of 0.05. Red and blue dots represent antibody features with a significant positive or negative correlation with i.v. BCG dose, respectively, following multiple testing correction (Benjamini-Hochberg adjusted p value <0.05). (C) Spearman correlations between selected BAL antibody features at peak immunogenicity (week 4) and i.v. BCG dose. Boxes represent the interquartile range. The whiskers extend to the smallest and largest values within 1.5 times of the interquartile range.
Figure 3
Figure 3
Early BAL and plasma antibody features predict Mtb control at necropsy (A and D) Spearman correlations between total Mtb CFU measured at necropsy and each (A) BAL and (D) plasma antibody measurement collected at peak immunogenicity (week 4). Antibody features with low signal (average fold change less than 1.25) were removed prior to correlation analysis. Black dotted horizontal line indicates an unadjusted p value of 0.05. Red and blue dots represent antibody features with a significant positive or negative correlation with total Mtb CFU, respectively, following multiple testing correction (Benjamini-Hochberg adjusted p value <0.05). (B and E) PLS-DA model fit using LASSO-selected antibody features in the (B) BAL and (E) plasma. Left: plot of latent variable (LV) 1 and 2. Ellipses represent 95-percentile normal level sets. Right: LV1 loadings. (C and F) Area under the receiver operating characteristic curve (AUROC) analysis using individual antibody features in the (C) BAL and (F) plasma. Left: AUROC of the five most predictive features. Top individual antibody predictor in black, remaining features in gray. Right: receiver operating characteristic plot of the top individual antibody predictor in the (C) BAL and (F) plasma. 95% confidence intervals of the AUROC are shown in brackets.
Figure 4
Figure 4
Convergent humoral signatures of protection across compartments pre- and post-Mtb challenge (A) Fictitious data demonstrating how each antibody feature was transformed into 3 integrated variables by area under the curve computation: plasma pre-Mtb challenge, plasma post-Mtb challenge, and BAL pre-Mtb challenge. (B) PLS-DA model fit using LASSO-selected antibody features in the combined dataset. Left: plot of LV 1 and 2. Ellipses represent 95-percentile normal level sets. Right: LV1 loadings. (C) Co-correlate networks based on the pairwise correlation between the LASSO-selected antibody features, and the remaining antibody features evaluated. Networks were constructed separately for BAL pre-Mtb challenge features (left), plasma pre-Mtb challenge features (center), and plasma post-Mtb challenge features (right). Nodes of the LASSO-selected features enriched in protected and breakthrough macaques are yellow and purple, respectively. Nodes of significant co-correlates are gray. Spearman correlations with a coefficient greater than an arbitrary threshold (pre-plasma threshold = 0.6; pre-BAL threshold = 0.9; post-plasma threshold = 0.7) and an adjusted p value less than 0.01 after multiple testing correction are indicated by the edges.
Figure 5
Figure 5
Humoral biomarkers of protection after controlling for i.v. BCG dose Logistic regression to predict Mtb infection outcome using individual antibody features in the BAL and plasma. Each antibody feature was transformed into 3 integrated variables by area under the curve computation: plasma pre-Mtb challenge, plasma post-Mtb challenge, and BAL pre-Mtb challenge. Black dotted horizontal line indicates an unadjusted p value of 0.05.

Update of

References

    1. World Health Organization . World Health Organization; 2023. Global Tuberculosis Report; pp. 1–39.
    1. Fine P.E. Variation in protection by BCG: implications of and for heterologous immunity. Lancet. 1995;346:1339–1345. - PubMed
    1. Darrah P.A., Zeppa J.J., Maiello P., Hackney J.A., Wadsworth M.H., 2nd, Hughes T.K., Pokkali S., Swanson P.A., 2nd, Grant N.L., Rodgers M.A., et al. Prevention of tuberculosis in macaques after intravenous BCG immunization. Nature. 2020;577:95–102. - PMC - PubMed
    1. Peters J.M., Irvine E.B., Rosenberg J.M., Wadsworth M.H., Hughes T.K., Sutton M., Nyquist S.K., Bromley J.D., Mondal R., Roederer M., et al. Protective intravenous BCG vaccination induces enhanced immune signaling in the airways. bioRxiv. 2023 doi: 10.1101/2023.07.16.549208. Preprint at. - DOI
    1. Irvine E.B., O’Neil A., Darrah P.A., Shin S., Choudhary A., Li W., Honnen W., Mehra S., Kaushal D., Gideon H.P., et al. Robust IgM responses following intravenous vaccination with Bacille Calmette-Guérin associate with prevention of Mycobacterium tuberculosis infection in macaques. Nat. Immunol. 2021;22:1515–1523. - PMC - PubMed

LinkOut - more resources