. 2024 Dec 12;14(12):e70701.
doi: 10.1002/ece3.70701. eCollection 2024 Dec.

Earth's Climate History Explains Life's Temperature Optima

Affiliations

Earth's Climate History Explains Life's Temperature Optima

Louis A Schipper et al. Ecol Evol. .

Abstract

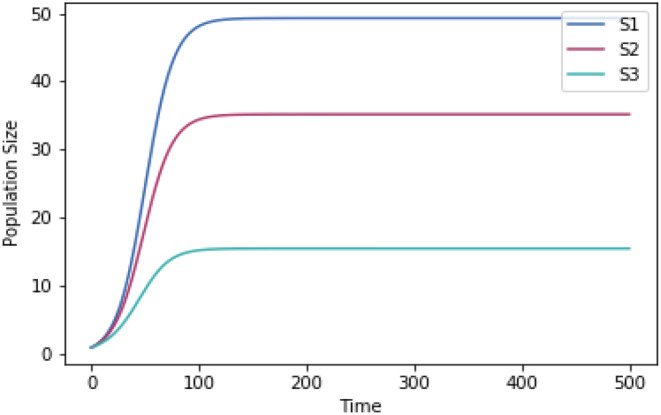
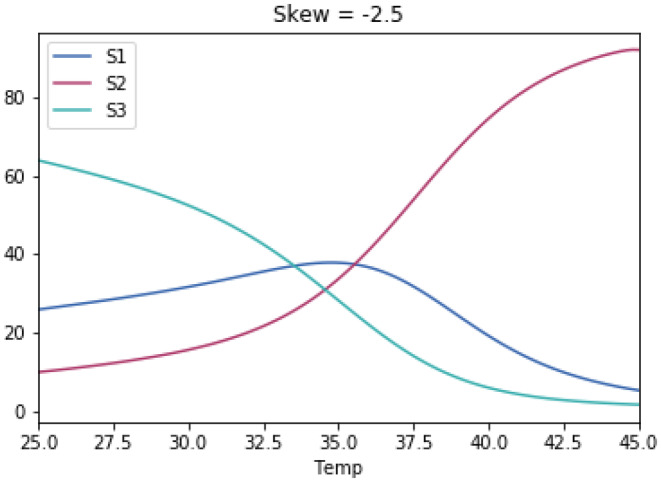
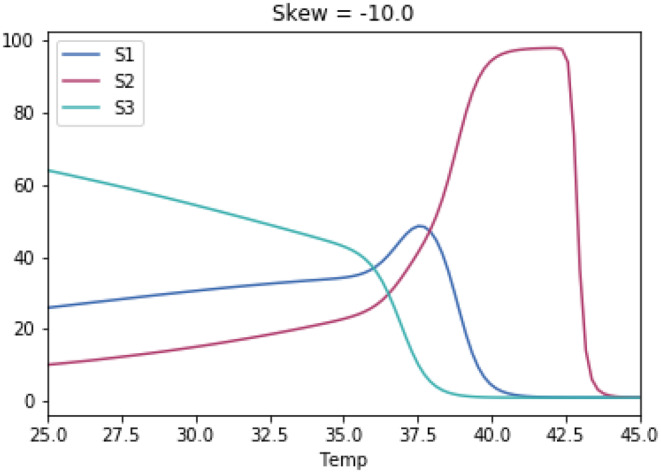
Why does the growth of most life forms exhibit a narrow range of optimal temperatures below 40°C? We hypothesize that the recently identified stable range of oceanic temperatures of ~5 to 37°C for more than two billion years of Earth history tightly constrained the evolution of prokaryotic thermal performance curves to optimal temperatures for growth to less than 40°C. We tested whether competitive mechanisms reproduced the observed upper limits of life's temperature optima using simple Lotka-Volterra models of interspecific competition between organisms with different temperature optima. Model results supported our proposition whereby organisms with temperature optima up to 37°C were most competitive. Model results were highly robust to a wide range of reasonable variations in temperature response curves of modeled species. We further propose that inheritance of prokaryotic genes and subsequent co-evolution with microbial partners may have resulted in eukaryotes also fixing their temperature optima within this narrow temperature range. We hope this hypothesis will motivate considerable discussion and future work to advance our understanding of the remarkable consistency of the temperature dependence of life.

Keywords: early evolution; selection pressure; temperature optima.


Conflict of interest statement

The authors declare no conflicts of interest.

Figures

FIGURE 1
FIGURE 1
Earth's temperature history determined life's thermal optima. We propose that stable ocean temperatures with an upper limit of ~37°C since the Archean (T maxE) imposed strong selection pressures on the temperature optima of early life via thermal constraints on cell structure, metabolism, and resource acquisition. These macroevolutionary pressures likely gave rise to the observed universal upper limit of temperature optima (T opt) in modern lifeforms.
FIGURE 2
FIGURE 2
Organisms receive a competitive advantage when optimizing growth rates to local environmental temperatures. We propose that selection was driven by competitive advantages of increased growth rates for organisms with T opt that closely match environmental temperatures due to opposing upward and downward selection pressures on organismal temperature optima (A). Simple competition models (B) suggest organisms with lower T opt mainly face competitive constraints, whereas organisms with the highest T opt only escape competition at warmer extremes but eventually face strong maintenance costs and death as they approach upper critical temperatures for growth (T max). Inset in (B) shows the competitive dynamics of three model species at an environmental temperature of 37°C.
FIGURE A1
FIGURE A1
Growth rate–temperature relationships used for the competition model in Figure 1.3.
FIGURE A2
FIGURE A2
Competition of all three species at 37°C.
FIGURE A3
FIGURE A3
Competition of S1 and S2 at 37°C.
FIGURE A4
FIGURE A4
Competition of S1 and S2 across 25.0°C–45.0°C.
FIGURE A5
FIGURE A5
Competition of S1 and S3 at 37°C.
FIGURE A6
FIGURE A6
Competition of S1 and S3 across 25.0°C–45.0°C.
FIGURE A7
FIGURE A7
Growth rate–temperature relationships without normalization.
FIGURE A8
FIGURE A8
Competition of species at 37°C without normalization of the growth rate–temperature relationships.
FIGURE A9
FIGURE A9
Competition of species across 25.0°C–45.0°C without normalization of the growth rate‐temperature relationships.
FIGURE A10
FIGURE A10
Growth rate–temperature relationships without differences in skew.
FIGURE A11
FIGURE A11
Competition of species at 37°C without differences in the skew of the growth rate–temperature relationships.
FIGURE A12
FIGURE A12
Competition of species across 25.0°C–45.0°C without differences in skew of the growth rate–temperature relationships.
FIGURE A13
FIGURE A13
Competition of species across 25.0°C–45.0°C with skewedness of 0.0 for all of the growth rate–temperature relationships.
FIGURE A14
FIGURE A14
Competition of species across 25.0°C–45.0°C with skewedness of −2.5 for all of the growth rate–temperature relationships.
FIGURE A15
FIGURE A15
Competition of species across 25.0°C–45.0°C with skewedness of −5.0 for all of the growth rate–temperature relationships.
FIGURE A16
FIGURE A16
Competition of species across 25.0°C–45.0°C with skewedness of −7.5 for all of the growth rate–temperature relationships.
FIGURE A17
FIGURE A17
Competition of species across 25.0°C–45.0°C with skewedness of −10.0 for all of the growth rate–temperature relationships.
FIGURE A18
FIGURE A18
Competition of species across 25.0°C–45.0°C with skewedness of −15.0 for all of the growth rate–temperature relationships.
FIGURE A19
FIGURE A19
Competition of species across 25.0°C–45.0°C with skewedness of −20.0 for all of the growth rate–temperature relationships.
FIGURE A20
FIGURE A20
Competition of species across 25.0°C–45.0°C with differences in the temperature optimum of 0.1°C.
FIGURE A21
FIGURE A21
Competition of species across 25.0°C–45.0°C with differences in the temperature optimum of 0.5°C.
FIGURE A22
FIGURE A22
Competition of species across 25.0°C–45.0°C with differences in the temperature optimum of 1.0°C.
FIGURE A23
FIGURE A23
Competition of species across 25.0°C–45.0°C with differences in the temperature optimum of 2.0°C.
FIGURE A24
FIGURE A24
Competition of species across 25.0°C–45.0°C with differences in the temperature optimum of 5.0°C.
FIGURE A25
FIGURE A25
Competition of species across 25.0°C–45.0°C with differences in the temperature optimum of 10.0°C.

References

    1. Araújo, M. B. , Ferri‐Yáñez F., Bozinovic F., Marquet P. A., Valladares F., and Chown S. L.. 2013. “Heat Freezes Niche Evolution.” Ecology Letters 16: 1206–1219. 10.1111/ele.12155. - DOI - PubMed
    1. Arroyo, J. I. , Díez B., Kempes C. P., West G. B., and Marquet P. A.. 2022. “A General Theory for Temperature Dependence in Biology.” Proceedings of the National Academy of Sciences 119: e2119872119. 10.1073/pnas.2119872119. - DOI - PMC - PubMed
    1. Bennett, J. M. , Sunday J., Calosi P., et al. 2021. “The Evolution of Critical Thermal Limits of Life on Earth.” Nature Communications 12: 1198. 10.1038/s41467-021-21263-8. - DOI - PMC - PubMed
    1. Comeault, A. A. , and Matute D. R.. 2021. “Temperature‐Dependent Competitive Outcomes Between the Fruit Flies Drosophila Santomea and Drosophila Yakuba.” American Naturalist 197: 312–323. 10.1086/712781. - DOI - PubMed
    1. Dell, A. I. , Pawar S., and Savage V. M.. 2011. “Systematic Variation in the Temperature Dependence of Physiological and Ecological Traits.” Proceedings of the National Academy of Sciences 108: 10591–10596. 10.1073/pnas.1015178108. - DOI - PMC - PubMed

LinkOut - more resources