. 2024 Nov 28:15:1489235.
doi: 10.3389/fimmu.2024.1489235. eCollection 2024.

Integrated immunogenomic analyses of high-grade serous ovarian cancer reveal vulnerability to combination immunotherapy

Affiliations

Integrated immunogenomic analyses of high-grade serous ovarian cancer reveal vulnerability to combination immunotherapy

Raphael Gronauer et al. Front Immunol. .

Abstract

Background: The efficacy of immunotherapies in high-grade serous ovarian cancer (HGSOC) is limited, but clinical trials investigating the potential of combination immunotherapy including poly-ADP-ribose polymerase inhibitors (PARPis) are ongoing. Homologous recombination repair deficiency or BRCAness and the composition of the tumor microenvironment appear to play a critical role in determining the therapeutic response.

Methods: We conducted comprehensive immunogenomic analyses of HGSOC using data from several patient cohorts. Machine learning methods were used to develop a classification model for BRCAness from gene expression data. Integrated analysis of bulk and single-cell RNA sequencing data was used to delineate the tumor immune microenvironment and was validated by immunohistochemistry. The impact of PARPi and BRCA1 mutations on the activation of immune-related pathways was studied using ovarian cancer cell lines, RNA sequencing, and immunofluorescence analysis.

Results: We identified a 24-gene signature that predicts BRCAness. Comprehensive immunogenomic analyses across patient cohorts identified samples with BRCAness and high immune infiltration. Further characterization of these samples revealed increased infiltration of immunosuppressive cells, including tumor-associated macrophages expressing TREM2, C1QA, and LILRB4, as specified by single-cell RNA sequencing data and gene expression analysis of samples from patients receiving combination therapy with PARPi and anti-PD-1. Our findings show also that genomic instability and PARPi activated the cGAS-STING signaling pathway in vitro and the downstream innate immune response in a similar manner to HGSOC patients with BRCAness status. Finally, we have developed a web application (https://ovrseq.icbi.at) and an associated R package OvRSeq, which allow for comprehensive characterization of ovarian cancer patient samples and assessment of a vulnerability score that enables stratification of patients to predict response to the combination immunotherapy.

Conclusions: Genomic instability in HGSOC affects the tumor immune environment, and TAMs play a crucial role in modulating the immune response. Based on various datasets, we have developed a diagnostic application that uses RNA sequencing data not only to comprehensively characterize HGSOC but also to predict vulnerability and response to combination immunotherapy.

Keywords: BRCAness; PARP inhibitor; high-grade serous ovarian cancer; immunotherapy; precision oncology; tumor immune microenvironment; tumor-associated macrophages.


Conflict of interest statement

SS was employed by Innpath GmbH. AZ reports consulting fees from Amgen, Astra Zeneca, GSK, MSD, Novartis, PharmaMar, Roche, Seagen; honoraria from Amgen, Astra Zeneca, GSK, MSD, Novartis, PharmaMar, Roche, Seagen; travel expenses from Astra Zeneca, Gilead, Roche; participation on advisory boards from Amgen, Astra Zeneca, GSK, MSD, Novartis, Pfizer, PharmaMar, Roche, Seagen. CM reports consulting fees and honoraria from Roche, Novartis, Amgen, MSD, PharmaMar, Astra Zeneca, GSK, Seagen; travel expenses from Roche, Astra Zeneca; participation on advisory boards from Roche, Novartis, Amgen, MSD, Astra Zeneca, Pfizer, PharmaMar, GSK, Seagen. HH has received research funding via Catalym and Secarna. The remaining authors declare that they have no known competing financial interests or personal relationships that could have appeared to influence the work reported in this paper.

Figures

Figure 1
Figure 1
BRCAness classification based on the expression of 24 genes. (A) Determination of BRCAness in the TCGA-OV cohort and the development of a gene expression-based BRCAness classifier. (B) Different BRCAness parameters in the TCGA cohort compared between the HRD score and the mutation signature 3 ratio. Samples with mutated homologous recombination repair pathway genes are marked in red, BRCA1/2 promoter methylation in blue and samples with an HRD score > 63 and/or a signature 3 ratio > 0.25 but no mutation or BRCA1/2 promoter methylation are marked in yellow. Samples without BRCAness are marked in white. (C) Mean ROC curve with 10-fold cross-validation of the classifier tested on the TCGA dataset. (D) Confusion matrices with correctly and incorrectly classified instances when the classifier was tested in independent test cohorts of single-cell RNA sequencing and bulk RNA sequencing data. (E) Z scores of log2(TPM+1) normalized expression of the 24 genes of the BRCAness signature in the TCGA cohort as a heatmap clustered by BRCAness and non-BRCAness samples.
Figure 2
Figure 2
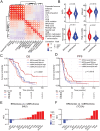
Association between BRCAness and immune parameters. (A) Results of correlation analysis of selected immune signatures and BRCAness parameters in the TCGA-HGSOC cohort (CYT, cytolytic activity; CTL, cytotoxic T lymphocytes; IFNG, interferon gamma signature; HRR mutations, mutations in the homologous recombination repair pathway; NeoAG load, neoantigen load; TMB, tumor mutational burden); white dots indicate significance (FDR<0.1). (B) Direct comparison of selected immune parameters between BRCAness and noBRCAness samples with significant differences, Wilcoxon rank-sum test (FDR<0.1) in the TCGA cohort (n=226). (C) Kaplan−Meier curves according to overall survival (OS) and for 4 patient groups of the TCGA dataset (n=226) based on BRCAness information and median dichotomized estimated CD8 T cell fraction (quanTIseq): patients with 1) BRCAness and high estimated CD8 T cell fraction, 2) BRCAness and low estimated CD8 T cell fraction, 3) noBRCAness and high estimated CD8 T cell fraction, and 4) noBRCAness and high estimated CD8 T cell fraction (p-value is from logrank test). (D) Kaplan−Meier curves according to progression free survival (PFS) for the same groups of patients from the TCGA cohort (n=226) as in (C). (E, F) Waterfall plot of normalized enrichment scores (NES) for the footprint analysis of immune-related pathways with PROGENy between BRCAness and non-BRCAness samples in the MUI (n=60) and TCGA (n=226) cohort.
Figure 3
Figure 3
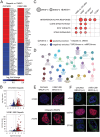
Results from cell line experiments with olaparib treatment (A) Top up- and downregulated genes for the cell lines OVCAR3 and UWB1.289 under olaparib treatment when compared to DMSO control. (B) General distribution of up- and downregulated genes after olaparib treatment compared to the DMSO control in both cell lines as volcano plots. Red indicates significantly upregulated genes (FDR<0.1, log2-fold change>1), and blue indicates significantly downregulated genes (FDR<0.1, log2-fold change<-1). (C) Normalized enrichment score of pathways associated with activation of the cGAS STING pathway in BRCA1 mutated (cell lines) and BRCAness samples (cohorts) as well as olaparib-treated cell lines. (D) ClueGO network indicating overrepresented biological processes in the olaparib-treated UWB1.289 cell line. (E) Immunofluorescence staining of the DNA damage marker γH2AX in OVCAR3 and UWB1.289 cell lines with and without olaparib treatment. Comparing the different response to PARPi treatment between BRCA1 mutation and wild type BRCA1 (F) Immunofluorescence staining of cGAS, double stranded DNA (dsDNA) and STING in the OVCAR3 and UWB1.289 cell line comparing the difference between BRCA1 mutation and wild type BRCA1.
Figure 4
Figure 4
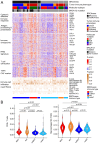
Profiles of immune parameters in the TCGA HGSOC cohort (n=226) (A) Heatmap of z scores of log2(TPM+1) expression of immune-related genes and fraction of tumor infiltrating immune cells assessed with quanTIseq and patient samples categorized by BRCAness, tumor-immune phenotype, molecular subtype and BRCA1/2 mutation. Furthermore, samples are stratified into four different tumor subtypes 1) BRCAness immune type samples (BRIT), which show an immunoreactive molecular subtype and an infiltrated tumor-immune phenotype, 2) noBRIT samples, which only have BRCAness but do not fulfill the other two requirements, 3) samples with an immune type (IMT) including an immunoreactive molecular subtype and an infiltrated tumor-immune phenotype but noBRCAness, and 4) remaining noIMT samples. (B) Distribution of estimated CD8 T cell fractions and estimated M2 macrophage fraction (from quanTIseq analyses) in the four different tumor subtypes. Benjamini-Hochberg adjusted p-values from pair-wise two-sided Dunn’s posthoc test are indicated.
Figure 5
Figure 5
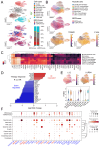
Single cell analysis of ovarian cancer adnexal samples from the MSK dataset (n=29) (A) UMAP showing the different cell types in of the ovarian cancer samples and which cells and cell types are associated with BRCAness samples. Distribution of major cell types in the BRCAness and noBRCAness are summarized as stacked bar plots. (B) UMAP plots of the myeloid cell compartment showing the association of macrophages with BRCAness cells and the expression of the macrophage marker gene C1QA and the TAM marker gene TREM2 especially in cell clusters associated with BRCAness. (C) Heatmap of expression of macrophage associated marker genes in the different cell types in the myeloid cell compartment. (D) Log2 fold changes of differentially expressed genes between responder [R] and non-responder [NR] to PARPi-immune checkpoint inhibition combination therapy (niraparib and pembrolizumab) from the TOPACIO clinical trial (n=22) (p<0.05) (E) Distribution of expression visualized by UMAP and violin plots indicating in which (myeloid) cell types LYZ, LILRB, or ITGB2 are expressed (F) Dotplot indicating the distribution of expression and fraction of cells in various cell type for genes up-regulated (red) or down-regulated (blue) in responders vs non-responders to combination therapy as indicated in (D).
Figure 6
Figure 6
Expression profiles in the MUI cohort, immunohistochemistry validation, and vulnerability map (A) Heatmap of z-scores log2(TPM+1) expression of immune related genes and fraction of tumor infiltrating immune cells assessed with quanTIseq in all samples (n=60) from the MUI cohort categorized by BRCAness, tumor-immune phenotype, molecular subtype and BRCA1/2 mutation. (B) Immunohistochemistry images stained for CD8, CD4, CD163, γH2AX, and STING for three selected patients from the MUI cohort. Two BRIT samples one with a BRCA1 mutation and one without and one other sample without BRCAness, a deserted tumor-immune phenotype and a differentiated molecular subtype. (C) Vulnerability map showing the ratio between cytolytic activity CYT and C1QA (C2C) on the x-axis and the BRCAness score on the y-axis colored by the vulnerability score. The three selected samples were mapped to the vulnerability map based on their CYT to C1QA ratio (C2C) and BRCAness score.

References

    1. Siegel RL, Miller KD, Wagle NS, Jemal A. Cancer statistics, 2023. CA A Cancer J Clin. (2023) 73:17–48. doi: 10.3322/caac.21763 - DOI - PubMed
    1. Le DT, Durham JN, Smith KN, Wang H, Bartlett BR, Aulakh LK, et al. . Mismatch repair deficiency predicts response of solid tumors to PD-1 blockade. Science. (2017) 357:409–13. doi: 10.1126/science.aan6733 - DOI - PMC - PubMed
    1. Disis ML, Taylor MH, Kelly K, Beck JT, Gordon M, Moore KM, et al. . Efficacy and safety of avelumab for patients with recurrent or refractory ovarian cancer: phase 1b results from the JAVELIN solid tumor trial. JAMA Oncol. (2019) 5:393. doi: 10.1001/jamaoncol.2018.6258 - DOI - PMC - PubMed
    1. Varga A, Piha-Paul S, Ott PA, Mehnert JM, Berton-Rigaud D, Morosky A, et al. . Pembrolizumab in patients with programmed death ligand 1–positive advanced ovarian cancer: Analysis of KEYNOTE-028. Gynecol Oncol. (2019) 152:243–50. doi: 10.1016/j.ygyno.2018.11.017 - DOI - PubMed
    1. Konstantinopoulos PA, Cannistra SA. Immune checkpoint inhibitors in ovarian cancer: can we bridge the gap between IMagynation and reality? JCO. (2021) 39:1833–8. doi: 10.1200/JCO.21.00571 - DOI - PubMed

MeSH terms