. 2024 Nov 30;13(11):2987-2997.
doi: 10.21037/tlcr-24-570. Epub 2024 Nov 28.

Characterization of the BH1406 non-small cell lung cancer (NSCLC) cell line carrying an activating SOS1 mutation

Affiliations

Characterization of the BH1406 non-small cell lung cancer (NSCLC) cell line carrying an activating SOS1 mutation

Gerhard Hamilton et al. Transl Lung Cancer Res. .

Abstract

Background: Approximately 30% of the non-small cell lung cancer (NSCLC) patients which harbor no recognizable oncogenic driver mutation are not eligible for targeted therapy. Functional drug screening of tumor cells helps to identify susceptible drug targets not recognized by gene panels for targeted mutation analysis. The aim of this study is to characterize the BH1406 cell line carrying an activating SOS1 mutation and to check its sensitivity to cognate inhibitors.

Methods: The NSCLC cell line BH1406 was established from a pleural effusion and found to be sensitive to the SOS1 inhibitor BAY-293 in initial viability screenings. Since in a limited next-generation sequencing (NGS) lung cancer mutation panel no driver could be detected, the patient underwent chemotherapy with poor outcome. This cell line was further characterized by exome sequencing, SOS1 Western blotting, comparison of two-dimensional (2D) and three-dimensional (3D) chemosensitivity assays and phosphoprotein arrays.

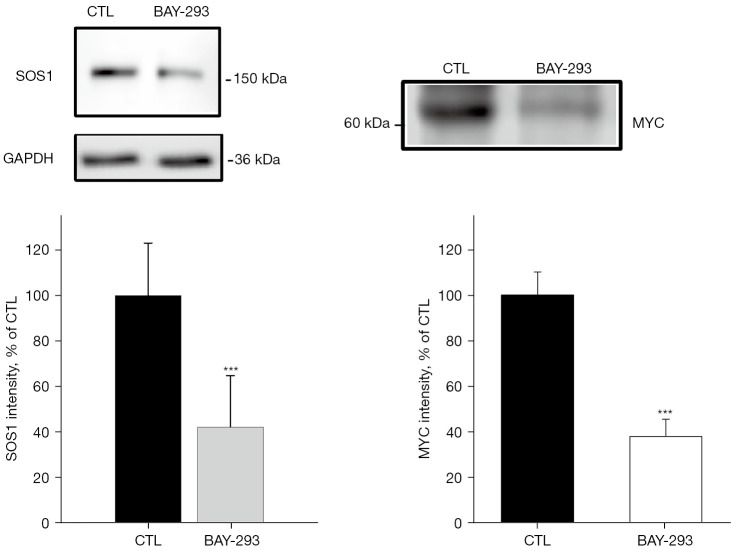
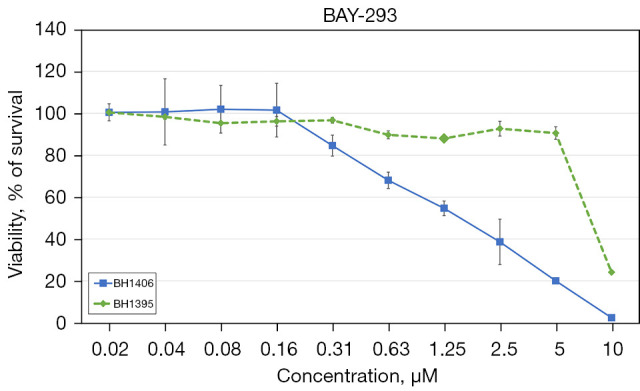
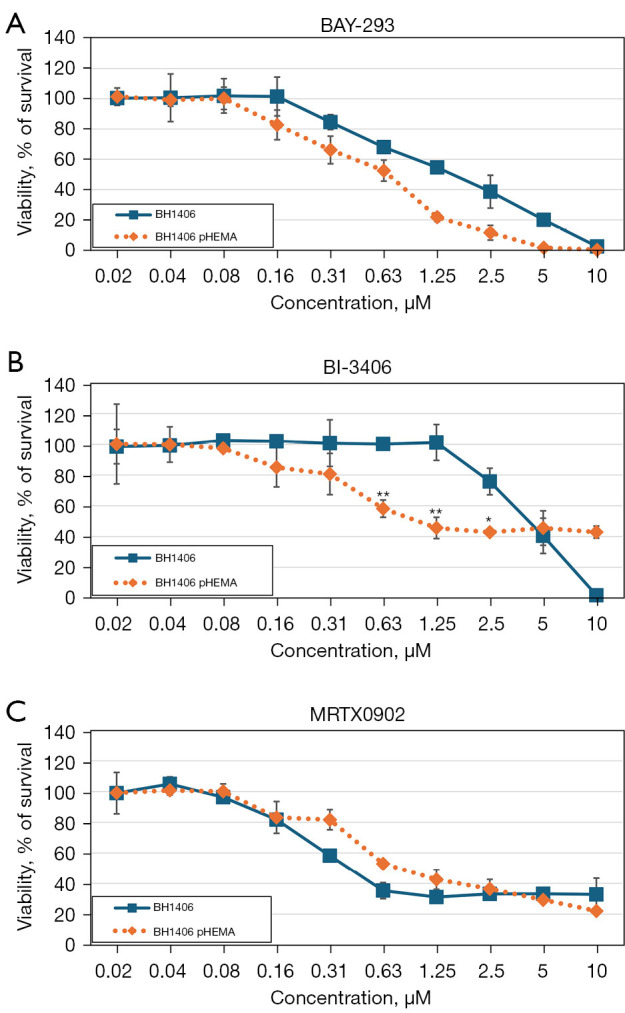
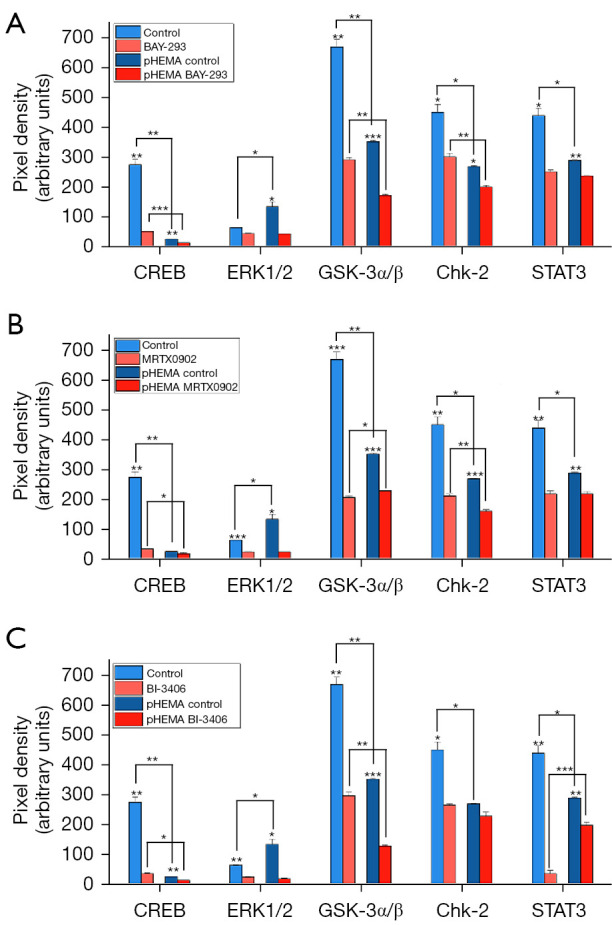
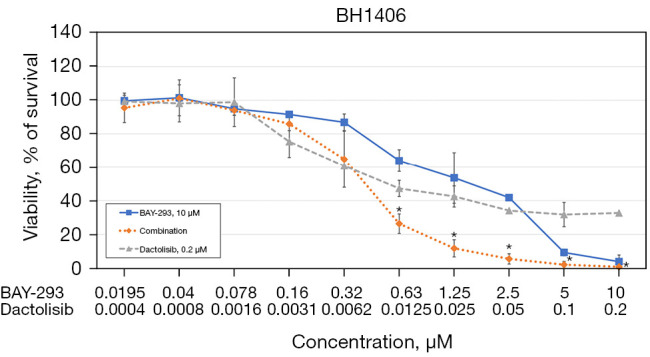
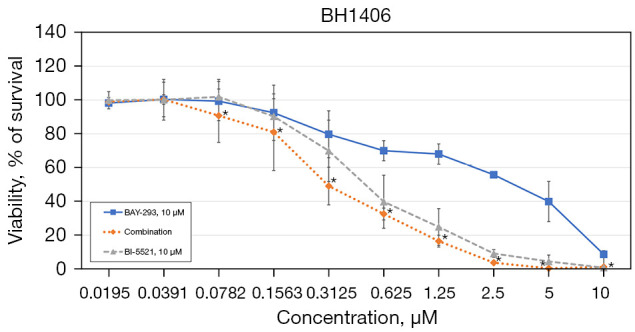
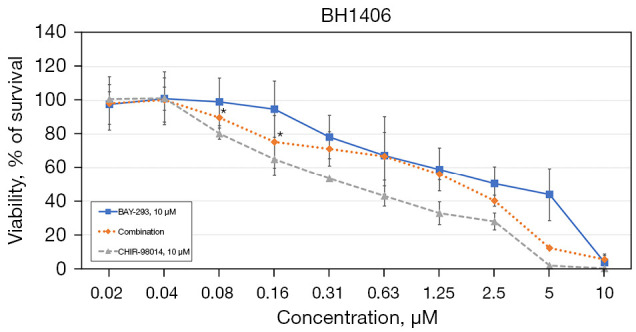
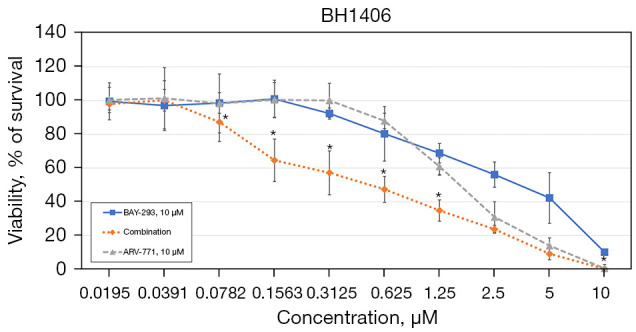
Results: In whole-exome sequencing (WES) the SOS1 mutation P481delinsLFFL, positioned near the known P478L activating mutation was detected. Besides BAY-293, BH1406 cells proved to be sensitive to the SOS1 inhibitors MRTX0902 and BI-3406. The sensitivity of BH1406 cells to BI-3406 was increased under 3D conditions compared to 2D cultures. Western blot phosphoprotein arrays revealed reduced phosphorylation of CREB, GSK3, CHK-2 and STAT3 in BH1406 by BAY-293 treatment in 2D culture. In 3D conditions, cells switched from GSK3α to elevated ERK1/2 signaling, again blocked by the SOS1 inhibitor BAY-293. Similar results were obtained for the SOS1 inhibitors MRTX0902 and BI3406. Additionally, the PI3K inhibitor dactolisib, the GSK-3 inhibitor BI-5521 as well as the bromodomain protein-directed PROTAC ARV-771 inhibited the growth of BH1406 cells significantly and showed synergistic interaction with BAY-293. Furthermore, Western blots demonstrated reduced expression of SOS1 and MYC proteins in response to BAY-293 treatment.

Conclusions: The rare SOS1 P481delinsLFFL mutation in lung cancer may be targetable with corresponding inhibitors, alone or in combination with GSK3/PI3K/BET inhibitors. BH1406 cells represent a novel cellular model suitable for the molecular characterization of SOS1 druggability. Such rare oncogenic driver genes are not included in standard NGS panels and need to be detected by expanded assays like WES.

Keywords: Non-small cell lung cancer (NSCLC); SOS1; SOS1 inhibitors; cell signaling; mutation.


Conflict of interest statement

Conflicts of Interest: All authors have completed the ICMJE uniform disclosure form (available at https://tlcr.amegroups.com/article/view/10.21037/tlcr-24-570/coif). G.H. serves as an unpaid editorial board member of Translational Lung Cancer Research from September 2023 to August 2025. The other authors have no conflicts of interest to declare.

Figures

Figure 1
Figure 1
SOS1 (left) and MYC (right) reduction by BAY-293 treatment in BH1406 lung cancer cells. Representative Western blots from BH1406 lung cancer cells (CTL) treated with 0.5 µM BAY-293 for 72 hours are depicted, using specific antibodies for SOS1 and GAPDH as a loading control. Six Western blots were quantified, and intensities normalized to the controls. The bar diagram shows the mean ± SD (***, P<0.001 versus control; Student’s t-test). CTL, control; SD, standard deviation.
Figure 2
Figure 2
Cytotoxicity assays using an initial concentration of 10 µM BAY-293 against BH1406 and KRAS wildtype BH1395. Data shown are mean values ± SD for 10 two-fold dilutions of the compounds. The IC50-value for BH1406 treated with BAY-293 is 1.12 µM, and BH1395 is 8.06 µM. SD, standard deviation; IC50, half maximal inhibitory concentration.
Figure 3
Figure 3
Cytotoxicity assays using an initial concentration of 10 µM (A) BAY-293, (B) BI-3406 and (C) MRTX0902 against BH1406 and BH1406 pre-cultured on 6-well plates coated with pHEMA. Data shown are mean values ± SD for 10 two-fold dilutions of the compounds. SD, standard deviation.
Figure 4
Figure 4
Comparison of the relative phosphorylation of proteins in BH1406 and BH1406 treated with 0.5 µM (A) BAY-293, (B) MRTX0902 and 0.2 µM (C) BI-3406 in addition to comparison between BH1406 and BH1406 pre-cultured on 6-well plates coated with pHEMA. Relative phosphorylation was determined by a Proteome Profiler Human Phospho-Kinase Array Kit (ARY003C, R&D Systems, Minneapolis, MN, USA). Data shown are mean values ± SD (*, P<0.05; **, P<0.01; ***, P<0.001). This figure shows CREB, ERK 1/2, GSK-3α/β, Chk-2 and STAT3.
Figure 5
Figure 5
Cytotoxicity of BAY-293 (10 µM), dactolisib (0.2 µM) and their combination against 2D BH1406 evaluated via cytotoxicity assays. Data shown are mean values ± SD for 10 two-fold dilutions of the compounds and their combination. IC50-values are 1.53 µM for BAY-293, 0.54 µM for dactolisib and 0.42 µM for their combination. A combination of BAY-293 and dactolisib shows synergism from 10 to 0.63 µM, marked by an *. SD, standard deviation; IC50, half maximal inhibitory concentration.
Figure 6
Figure 6
Cytotoxicity of BAY-293 (10 µM), BI-5521 (10 µM) and their combination against 2D BH1406 evaluated via cytotoxicity assays. Data shown are mean values ± SD for 10 two-fold dilutions of the compounds and their combination. IC50-values are 3.41 µM for BAY-293, 0.8 µM for BI-5521 and 0.31 µM for their combination. A combination of BAY-293 and BI-5521 shows synergism from 10 to 0.0782 µM, marked by an *. SD, standard deviation; IC50, half maximal inhibitory concentration.
Figure 7
Figure 7
Cytotoxicity of BAY-293 (10 µM), CHIR-98014 (10 µM) and their combination against 2D BH1406 evaluated via cytotoxicity assays. Data shown are mean values ± SD for 10 two-fold dilutions of the compounds and their combination. IC50-values are 2.5 µM for BAY-293, 0.4 µM for CHIR-98014 and 1.71 µM for their combination. A combination of BAY-293 and CHIR-98014 shows synergism from 0.16 to 0.08 µM, marked by an *. SD, standard deviation; IC50, half maximal inhibitory concentration.
Figure 8
Figure 8
Cytotoxicity of BAY-293 (10 µM), ARV-771 (10 µM) and their combination against 2D BH1406 evaluated via cytotoxicity assays. Data shown are mean values ± SD for 10 two-fold dilutions of the compounds and their combination. IC50-values are 3.57 µM for BAY-293, 1.67 µM for ARV-771 and 0.53 µM for their combination. A combination of BAY-293 and ARV-771 shows synergism from 1.25 to 0.078 µM, marked by an *. SD, standard deviation; IC50, half maximal inhibitory concentration.

Similar articles

References

    1. Chevallier M, Borgeaud M, Addeo A, et al. Oncogenic driver mutations in non-small cell lung cancer: Past, present and future. World J Clin Oncol 2021;12:217-37. 10.5306/wjco.v12.i4.217 - DOI - PMC - PubMed
    1. Cai D, Choi PS, Gelbard M, et al. Identification and Characterization of Oncogenic SOS1 Mutations in Lung Adenocarcinoma. Mol Cancer Res 2019;17:1002-12. 10.1158/1541-7786.MCR-18-0316 - DOI - PMC - PubMed
    1. Campbell JD, Alexandrov A, Kim J, et al. Distinct patterns of somatic genome alterations in lung adenocarcinomas and squamous cell carcinomas. Nat Genet 2016;48:607-16. 10.1038/ng.3564 - DOI - PMC - PubMed
    1. Sanchez-Vega F, Mina M, Armenia J, et al. Oncogenic Signaling Pathways in The Cancer Genome Atlas. Cell 2018;173:321-337.e10. 10.1016/j.cell.2018.03.035 - DOI - PMC - PubMed
    1. Rogge RD, Karlovich CA, Banerjee U. Genetic dissection of a neurodevelopmental pathway: Son of sevenless functions downstream of the sevenless and EGF receptor tyrosine kinases. Cell 1991;64:39-48. 10.1016/0092-8674(91)90207-f - DOI - PubMed

LinkOut - more resources