

Contribution of infection to mortality in people with type 2 diabetes: a population-based cohort study using electronic records
- PMID: 39670170
- PMCID: PMC11634975
- DOI: 10.1016/j.lanepe.2024.101147
Contribution of infection to mortality in people with type 2 diabetes: a population-based cohort study using electronic records
Abstract
Background: While people with type 2 diabetes (T2D) are more susceptible to infections, studies potentially underestimate the true burden of infection-related mortality since they rely on clinical coding systems primarily structured by body system, and by only focusing on underlying cause. This study examined cause-specific mortality in people with T2D compared to the general population during 2015-2019, focusing on infections.
Methods: 509,403 people aged 41-90 years with T2D alive on 1/1/2015 in Clinical Practice Research Datalink were matched to 976,431 without diabetes on age, sex, and ethnicity. Recorded underlying cause of death was identified through national linked mortality data; infection-related deaths were counted across all ICD-10 (10th revision of the International Classification of Diseases) chapters, not just infection chapters A00-B99. All-cause and cause-specific hazard ratios (HR) for mortality during 2015-2019 compared people with T2D to people without diabetes and were estimated using Cox models adjusting for region. Additional analyses for sepsis related mortality considered the impact of including any mention of sepsis on the death certificate.
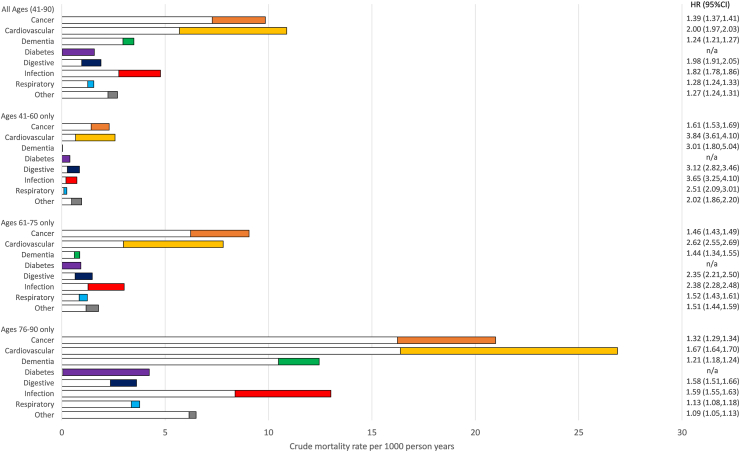
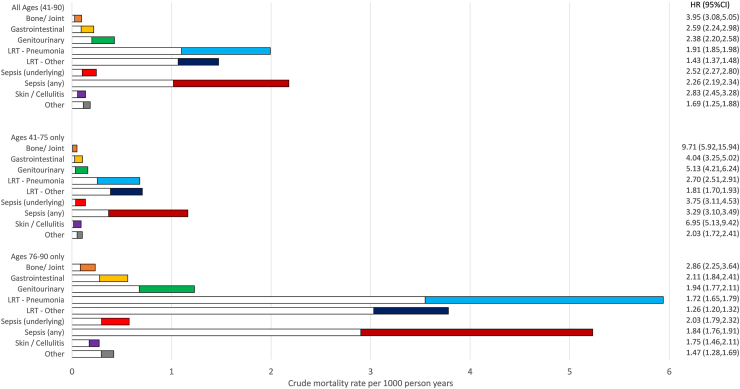
Findings: 85,367/509,403 (16.8%) people with T2D died during 2015-2019 compared to 106,824/976,431 (10.9%) of people without diabetes of the same sex, age and ethnicity. All infections (11,128/85,367 = 13.0%) represented the third highest underlying cause of death among people with T2D after cardiovascular disease and cancer; a much higher contribution than counting only from specific infection chapters (1046/85,367 = 1.2%). The HR for people with T2D vs non-diabetes for all infection mortality (1.82, 95% CI 1.78-1.86) was higher than that estimated for all-cause (HR = 1.65, 95% CI 1.64-1.66). The estimated mortality rate associated with sepsis among people with T2D was highly dependent on whether any mention was included (2.2 per 1000 person-years) or only underlying cause (0.2 per 1000 person-years); but the HR for people with T2D vs non-diabetes was similar (any mention HR = 2.26, 95% CI 2.19-2.34 vs underlying cause only HR = 2.52, 95% CI 2.27-2.80).
Interpretation: People with T2D die from infections at a higher rate than similar people without diabetes, and the overall burden is greater than previously reported. Routine statistics concentrating on underlying cause of death may somewhat under-estimate the importance of infections as causes of death among people with T2D. These findings emphasise the potential importance of awareness, earlier diagnosis and treatment of infections to prevent premature deaths.
Funding: National Institute for Health and Care Research.
Keywords: Cause of death; Infections; Mortality; Sepsis; Type 2 diabetes.
© 2024 The Author(s).
Conflict of interest statement
NS has consulted for and/or received speaker honoraria from Abbott Laboratories, AbbVie, Amgen, AstraZeneca, Boehringer Ingelheim, Eli Lilly, Hanmi Pharmaceuticals, Janssen, Menarini-Ricerche, Novartis, Novo Nordisk, Pfizer, Roche Diagnostics, and Sanofi; and received grant support paid to his University from AstraZeneca, Boehringer Ingelheim, Novartis, and Roche Diagnostics outside the submitted work.
Figures
References
-
- Zghebi S.S., Steinke D.T., Carr M.J., Rutter M.K., Emsley R.A., Ashcroft D.M. Examining trends in type 2 diabetes incidence, prevalence and mortality in the UK between 2004 and 2014. Diabetes Obes Metab. 2017;19(11):1537–1545. - PubMed
-
- Bertoni A.G., Saydah S., Brancati F.L. Diabetes and the risk of infection-related mortality in the US. Diabetes Care. 2001;24(6):1044–1049. - PubMed
-
- Magliano D.J., Harding J.L., Cohen K., Huxley R.R., Davis W.A., Shaw J.E. Excess risk of dying from infectious causes in those with type 1 and type 2 diabetes. Diabetes Care. 2015;38(7):1274–1280. - PubMed
LinkOut - more resources
Full Text Sources
