. 2024 Dec 24;18(51):34646-34655.
doi: 10.1021/acsnano.4c09753. Epub 2024 Dec 13.

Automated Gold Nanorod Spectral Morphology Analysis Pipeline

Affiliations

Automated Gold Nanorod Spectral Morphology Analysis Pipeline

Samuel P Gleason et al. ACS Nano. .

Abstract

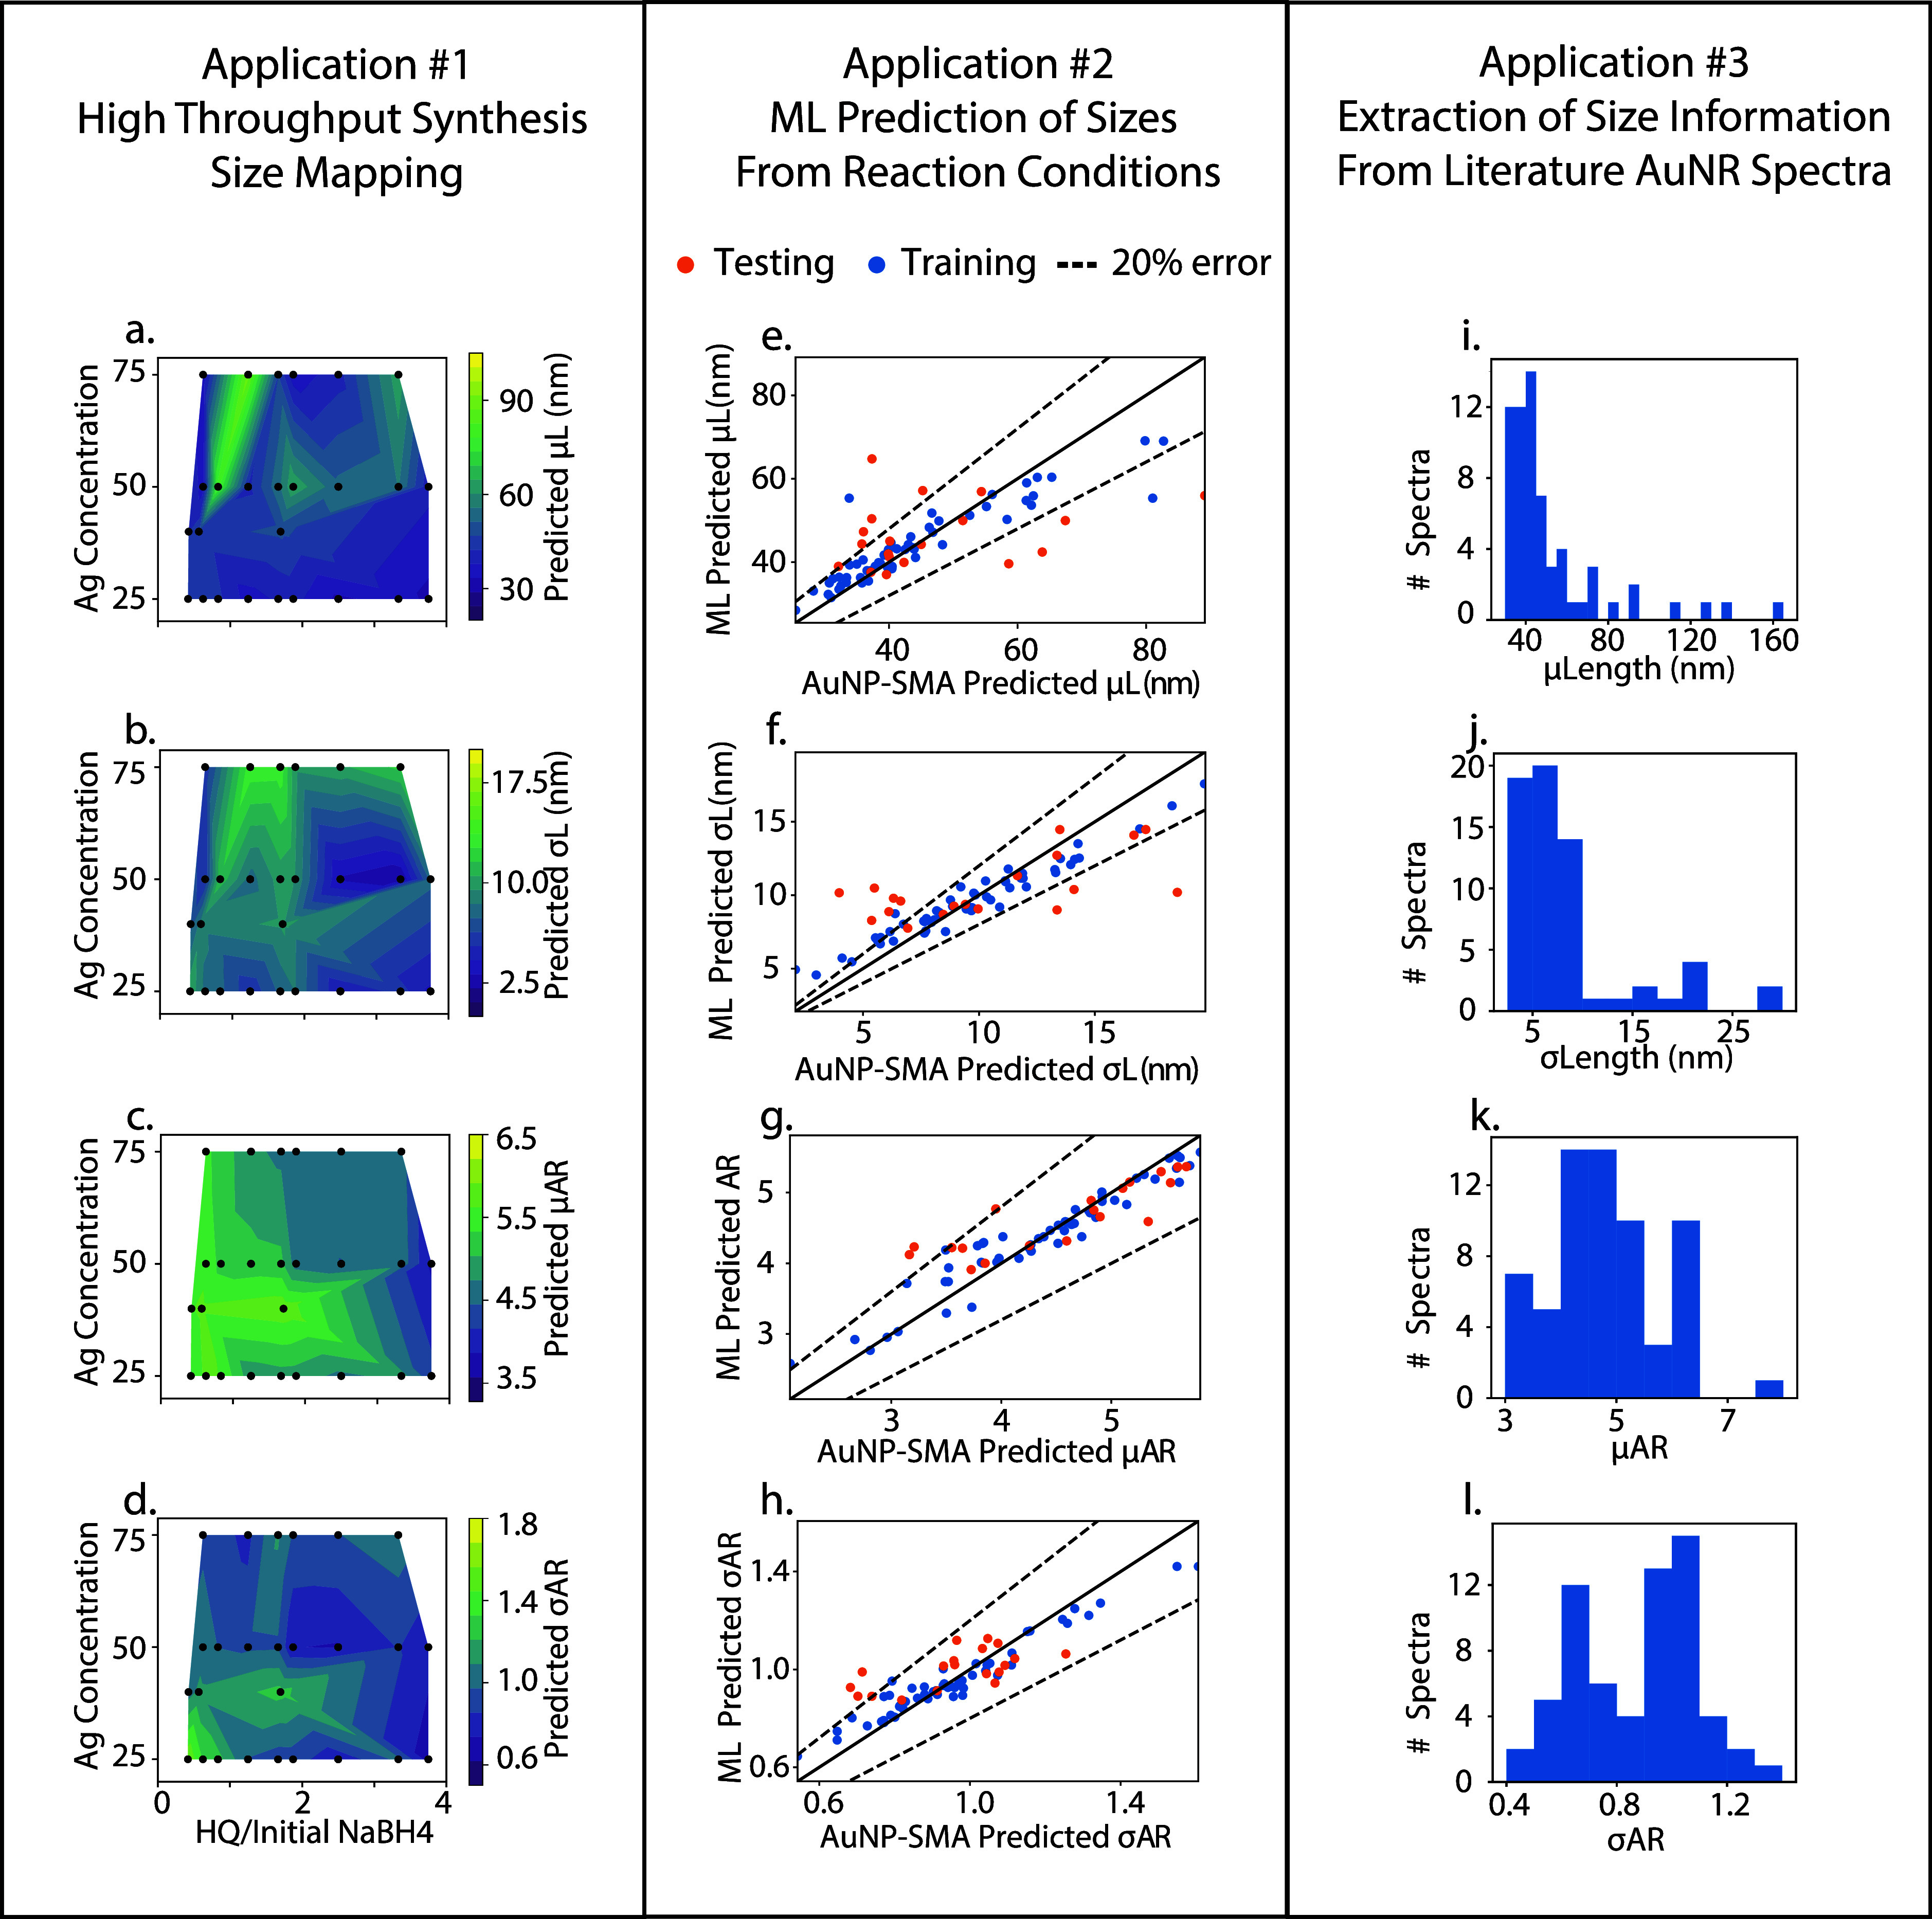
The development of a colloidal synthesis procedure to produce nanomaterials with high shape and size purity is often a time-consuming, iterative process. This is often due to quantitative uncertainties in the required reaction conditions and the time, resources, and expertise intensive characterization methods required for quantitative determination of nanomaterial size and shape. Absorption spectroscopy is often the easiest method for colloidal nanomaterial characterization. However, due to the lack of a reliable method to extract nanoparticle shapes from absorption spectroscopy, it is generally treated as a more qualitative measure for metal nanoparticles. This work demonstrates a gold nanorod (AuNR) spectral morphology analysis tool, called AuNR-SMA, which is a fast and accurate method to extract quantitative structural information from colloidal AuNR absorption spectra. To demonstrate the practical utility of this model, we apply it to three distinct applications. First, we demonstrate this model's utility as an automated analysis tool in a high-throughput AuNR synthesis procedure by generating quantitative size information from optical spectra. Second, we use the predictions generated by this model to train a machine learning model to predict the resulting AuNR size distributions under specified reaction conditions. Third, we apply this model to spectra extracted from the literature where no size distributions are reported and impute unreported quantitative information on AuNR synthesis. This approach can potentially be extended to any other nanocrystal system where absorption spectra are size dependent, and accurate numerical simulation of absorption spectra is possible. In addition, this pipeline could be integrated into automated synthesis apparatuses to provide interpretable data from simple measurements, help explore the synthesis science of nanoparticles in a rational manner, or facilitate closed-loop workflows.

Keywords: Au; automated analysis; high-throughput; machine learning; nanoparticle synthesis; nanorods.


Conflict of interest statement

The authors declare no competing financial interest.

Figures

Figure 1
Figure 1
Outline of the SMA showing (a) how a 2D matrix of AuNR sizes was numerically simulated and (b) entered into a matrix with identical dimensions to (a). The fitted population distribution is projected onto a 2D matrix (c) and combined with (b) via a dot product to produce the simulated mixture spectrum (d). This step is repeated with different population distributions (c) until the simulated mixture spectrum (d) achieves the best possible fit to the inputted experimental spectrum. More details on this process can be found in the Supporting Information, section “Spectral Morphology Analysis Outline”.
Figure 2
Figure 2
Accuracy of the SMA. (a–d) Sample AuNR spectrum (a) and an example of the model output in 1D (b–d). The predicted length distribution (b) is shown in red, the predicted diameter distribution (c) is shown in blue, and the predicted AR distribution (d) is shown in purple. The predicted distributions are plotted over histograms produced by manually measuring AuNRs taken from TEM images. For our 41 validation samples, the accuracy of their size parameters is shown in (e–h). The predictions are colored by whether they came from our high-throughput samples (blue) or literature spectra (orange). μLength (e) and σLength (f) are the length mean and standard deviation, respectively. μAR (g) and σAR (h) are the AR mean and standard deviation, respectively. (i) Histogram of the overlap between the predicted 2D distribution in length and diameter space and the true distribution, with the mean overlap indicated with a dashed red line.
Figure 3
Figure 3
Application 1—2D representations showing how changing synthesis condition impacts the produced length mean (a), length standard deviation (b), AR mean (c), and AR standard deviation (d), generated using AuNR-SMA. The contour plots show how each of the four size parameters changes with the ratio of hydroquinone to initial NaBH4 (x-axis) and the AgNO3 concentration (y-axis). The black dots show where experiments have been conducted and predicted. Application 2—accuracy of the ML model trained to predict synthesized size distributions from reaction condition. This model is trained on the high-throughput experiments from Application 1 labeled by AuNR-SMA and augmented by the labeled high-throughput synthesis data used to validate AuNR-SMA. The model’s accuracy on length mean (e), length standard deviation (f), mean AR (g), and AR standard deviation (h) are shown. Training accuracy is shown in blue while accuracy on test data is shown in orange. Application 3—distributions of size parameters from the 64 unlabeled literature spectra predicted in this work. Histograms of length means (i), length standard deviations (j), mean aspect ratios (k), and AR standard deviations (l) are shown.
Figure 4
Figure 4
Steps the overall SMA uses to determine how, or if, an input spectrum is fit and whether the results of that fit are expected to be accurate. Briefly, the model first determines whether the input spectrum is complete (a,b) discarding incomplete spectra. The model then determines if the longitudinal peak is before or after 795 nm (c,d) discarding spectra with peak wavelengths shorter than 795 nm. Finally, the model determines whether the spectra have been measured out to the baseline (e,f) and use a different fitting procedure in each of these cases (g,h). The model then outputs a 2D distribution of the AuNRs fitted to the sample (i). Rational for selecting the 795 nm cutoff is shown in (j) and the validity of the differing methods for the measured baseline and the discarding of uncertain spectra are shown in (k,l). The overlap metric used in (j–l) is the overlap of the predicted AuNR population and the measured AuNR population using TEM, and a full description of this metric can be found in Figure S1. A detailed description of the full model workflow can be found in the Supporting Information, section “Spectral Morphology Analysis Details”.

References

    1. Tong L.; Wei Q.; Wei A.; Cheng J.-X. Gold nanorods as contrast agents for biological imaging: optical properties, surface conjugation and photothermal effects. Photochem. Photobiol. 2009, 85, 21–32. 10.1111/j.1751-1097.2008.00507.x. - DOI - PMC - PubMed
    1. Jain P. K.; Huang X.; El-Sayed I. H.; El-Sayed M. A. Noble Metals on the Nanoscale: Optical and Photothermal Properties and Some Applications in Imaging, Sensing, Biology, and Medicine. Acc. Chem. Res. 2008, 41, 1578–1586. 10.1021/ar7002804. - DOI - PubMed
    1. Kang X.; Guo X.; Niu X.; An W.; Li S.; Liu Z.; Yang Y.; Wang N.; Jiang Q.; Yan C.; Wang H.; Zhang Q. Photothermal therapeutic application of gold nanorods-porphyrin-trastuzumab complexes in HER2-positive breast cancer. Sci. Rep. 2017, 7, 42069.10.1038/srep42069. - DOI - PMC - PubMed
    1. Mallick S.; Sun I.-C.; Kim K.; Yi D. K. Silica coated gold nanorods for imaging and photo-thermal therapy of cancer cells. J. Nanosci. Nanotechnol. 2013, 13, 3223–3229. 10.1166/jnn.2013.7149. - DOI - PubMed
    1. Choi W. I.; Sahu A.; Kim Y. H.; Tae G. Photothermal cancer therapy and imaging based on gold nanorods. Ann. Biomed. Eng. 2012, 40, 534–546. 10.1007/s10439-011-0388-0. - DOI - PubMed