. 2025 Jan 17;14(1):129-147.
doi: 10.1021/acssynbio.4c00469. Epub 2024 Dec 13.

Developing, Characterizing, and Modeling CRISPR-Based Point-of-Use Pathogen Diagnostics

Affiliations

Developing, Characterizing, and Modeling CRISPR-Based Point-of-Use Pathogen Diagnostics

Jaeyoung K Jung et al. ACS Synth Biol. .

Abstract

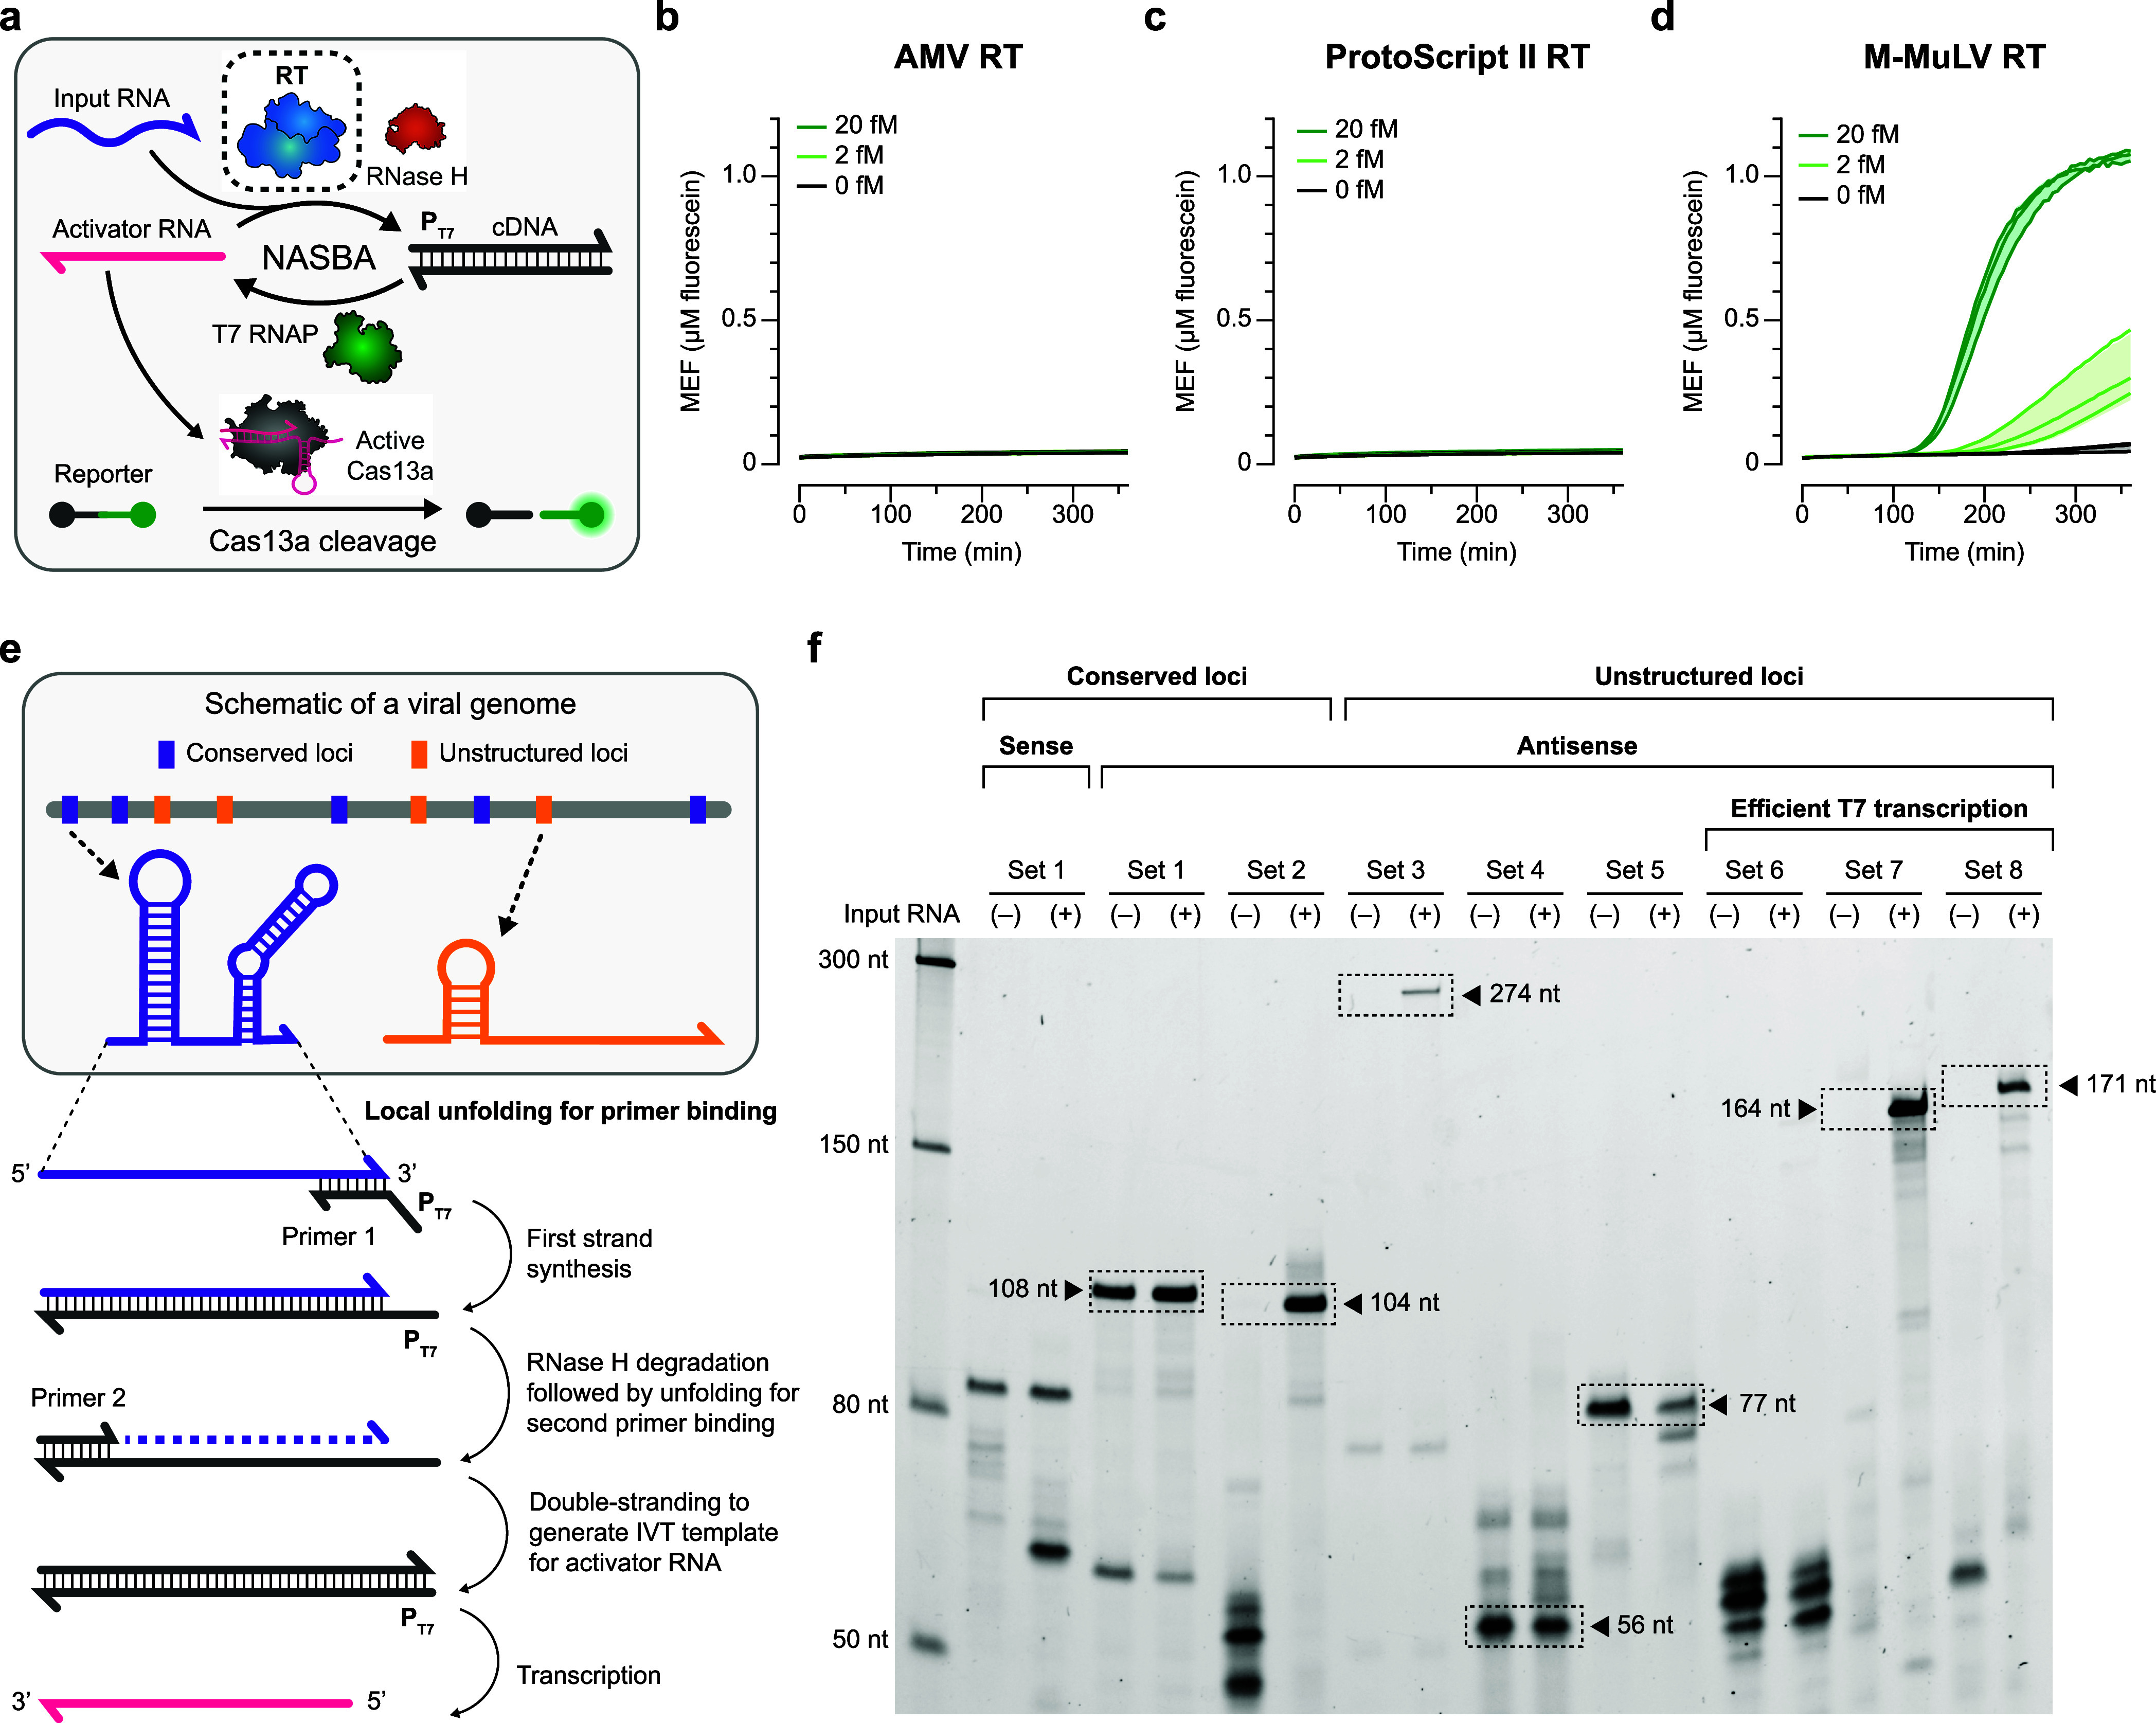
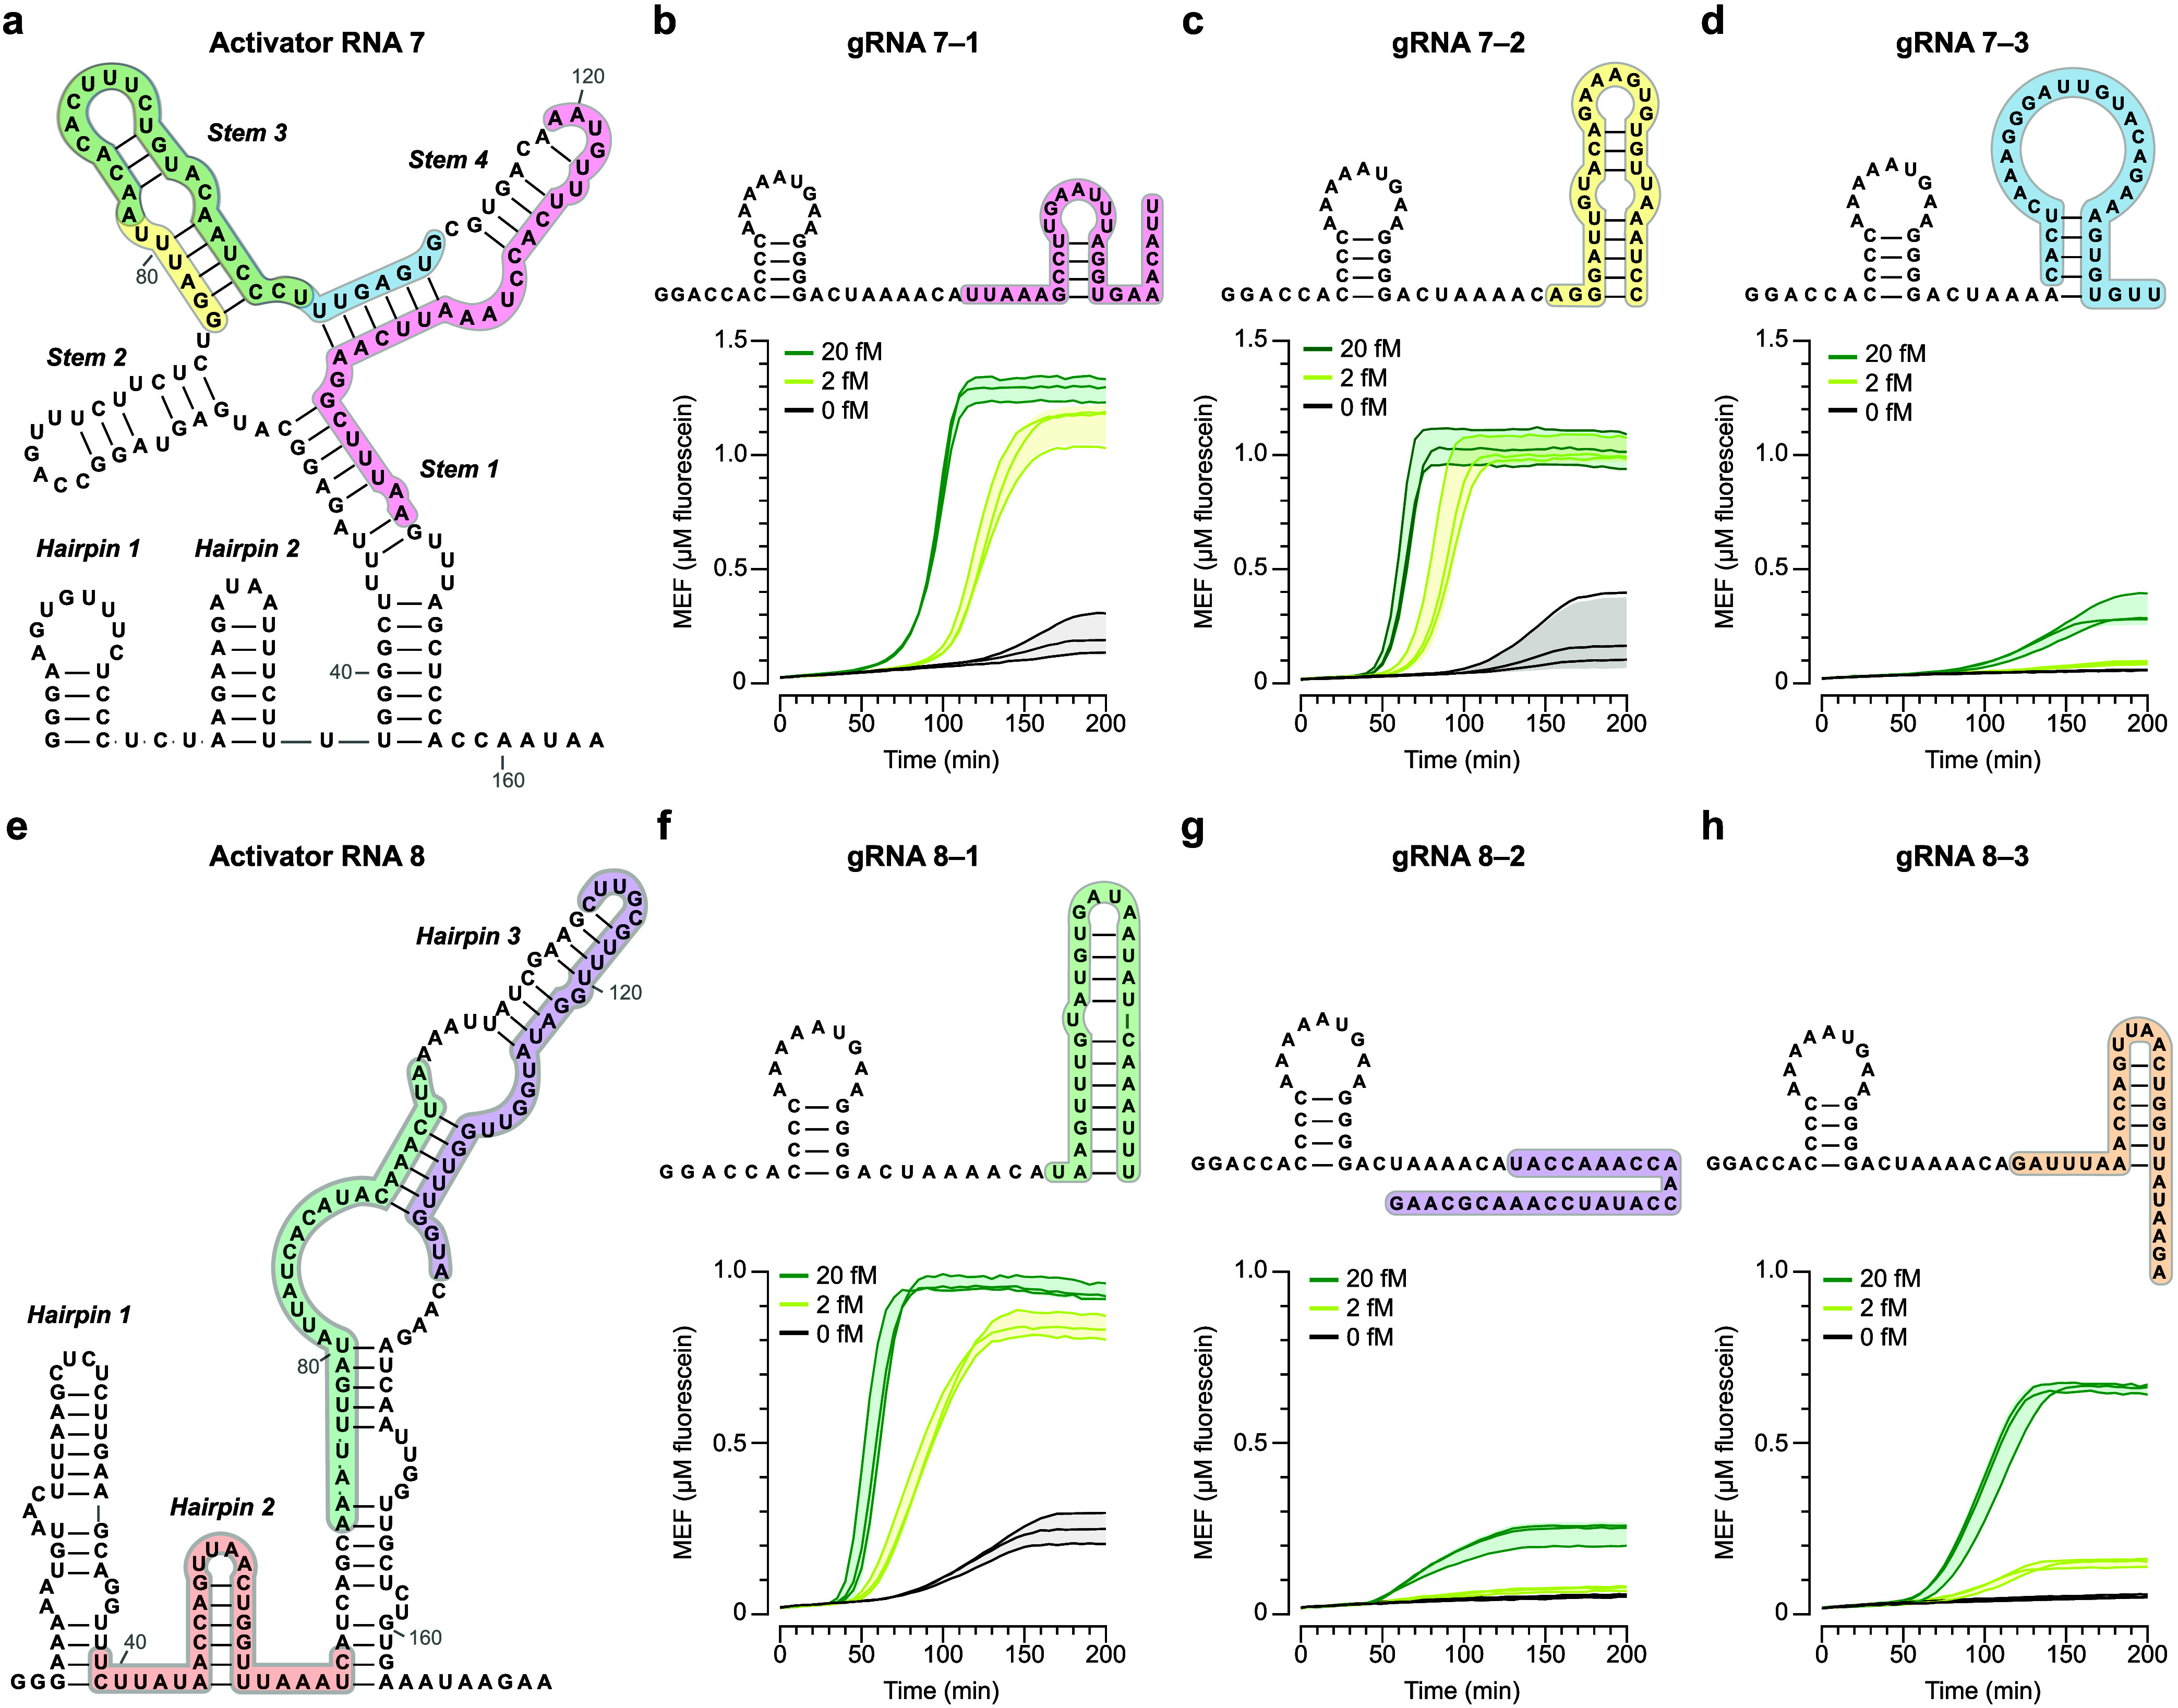
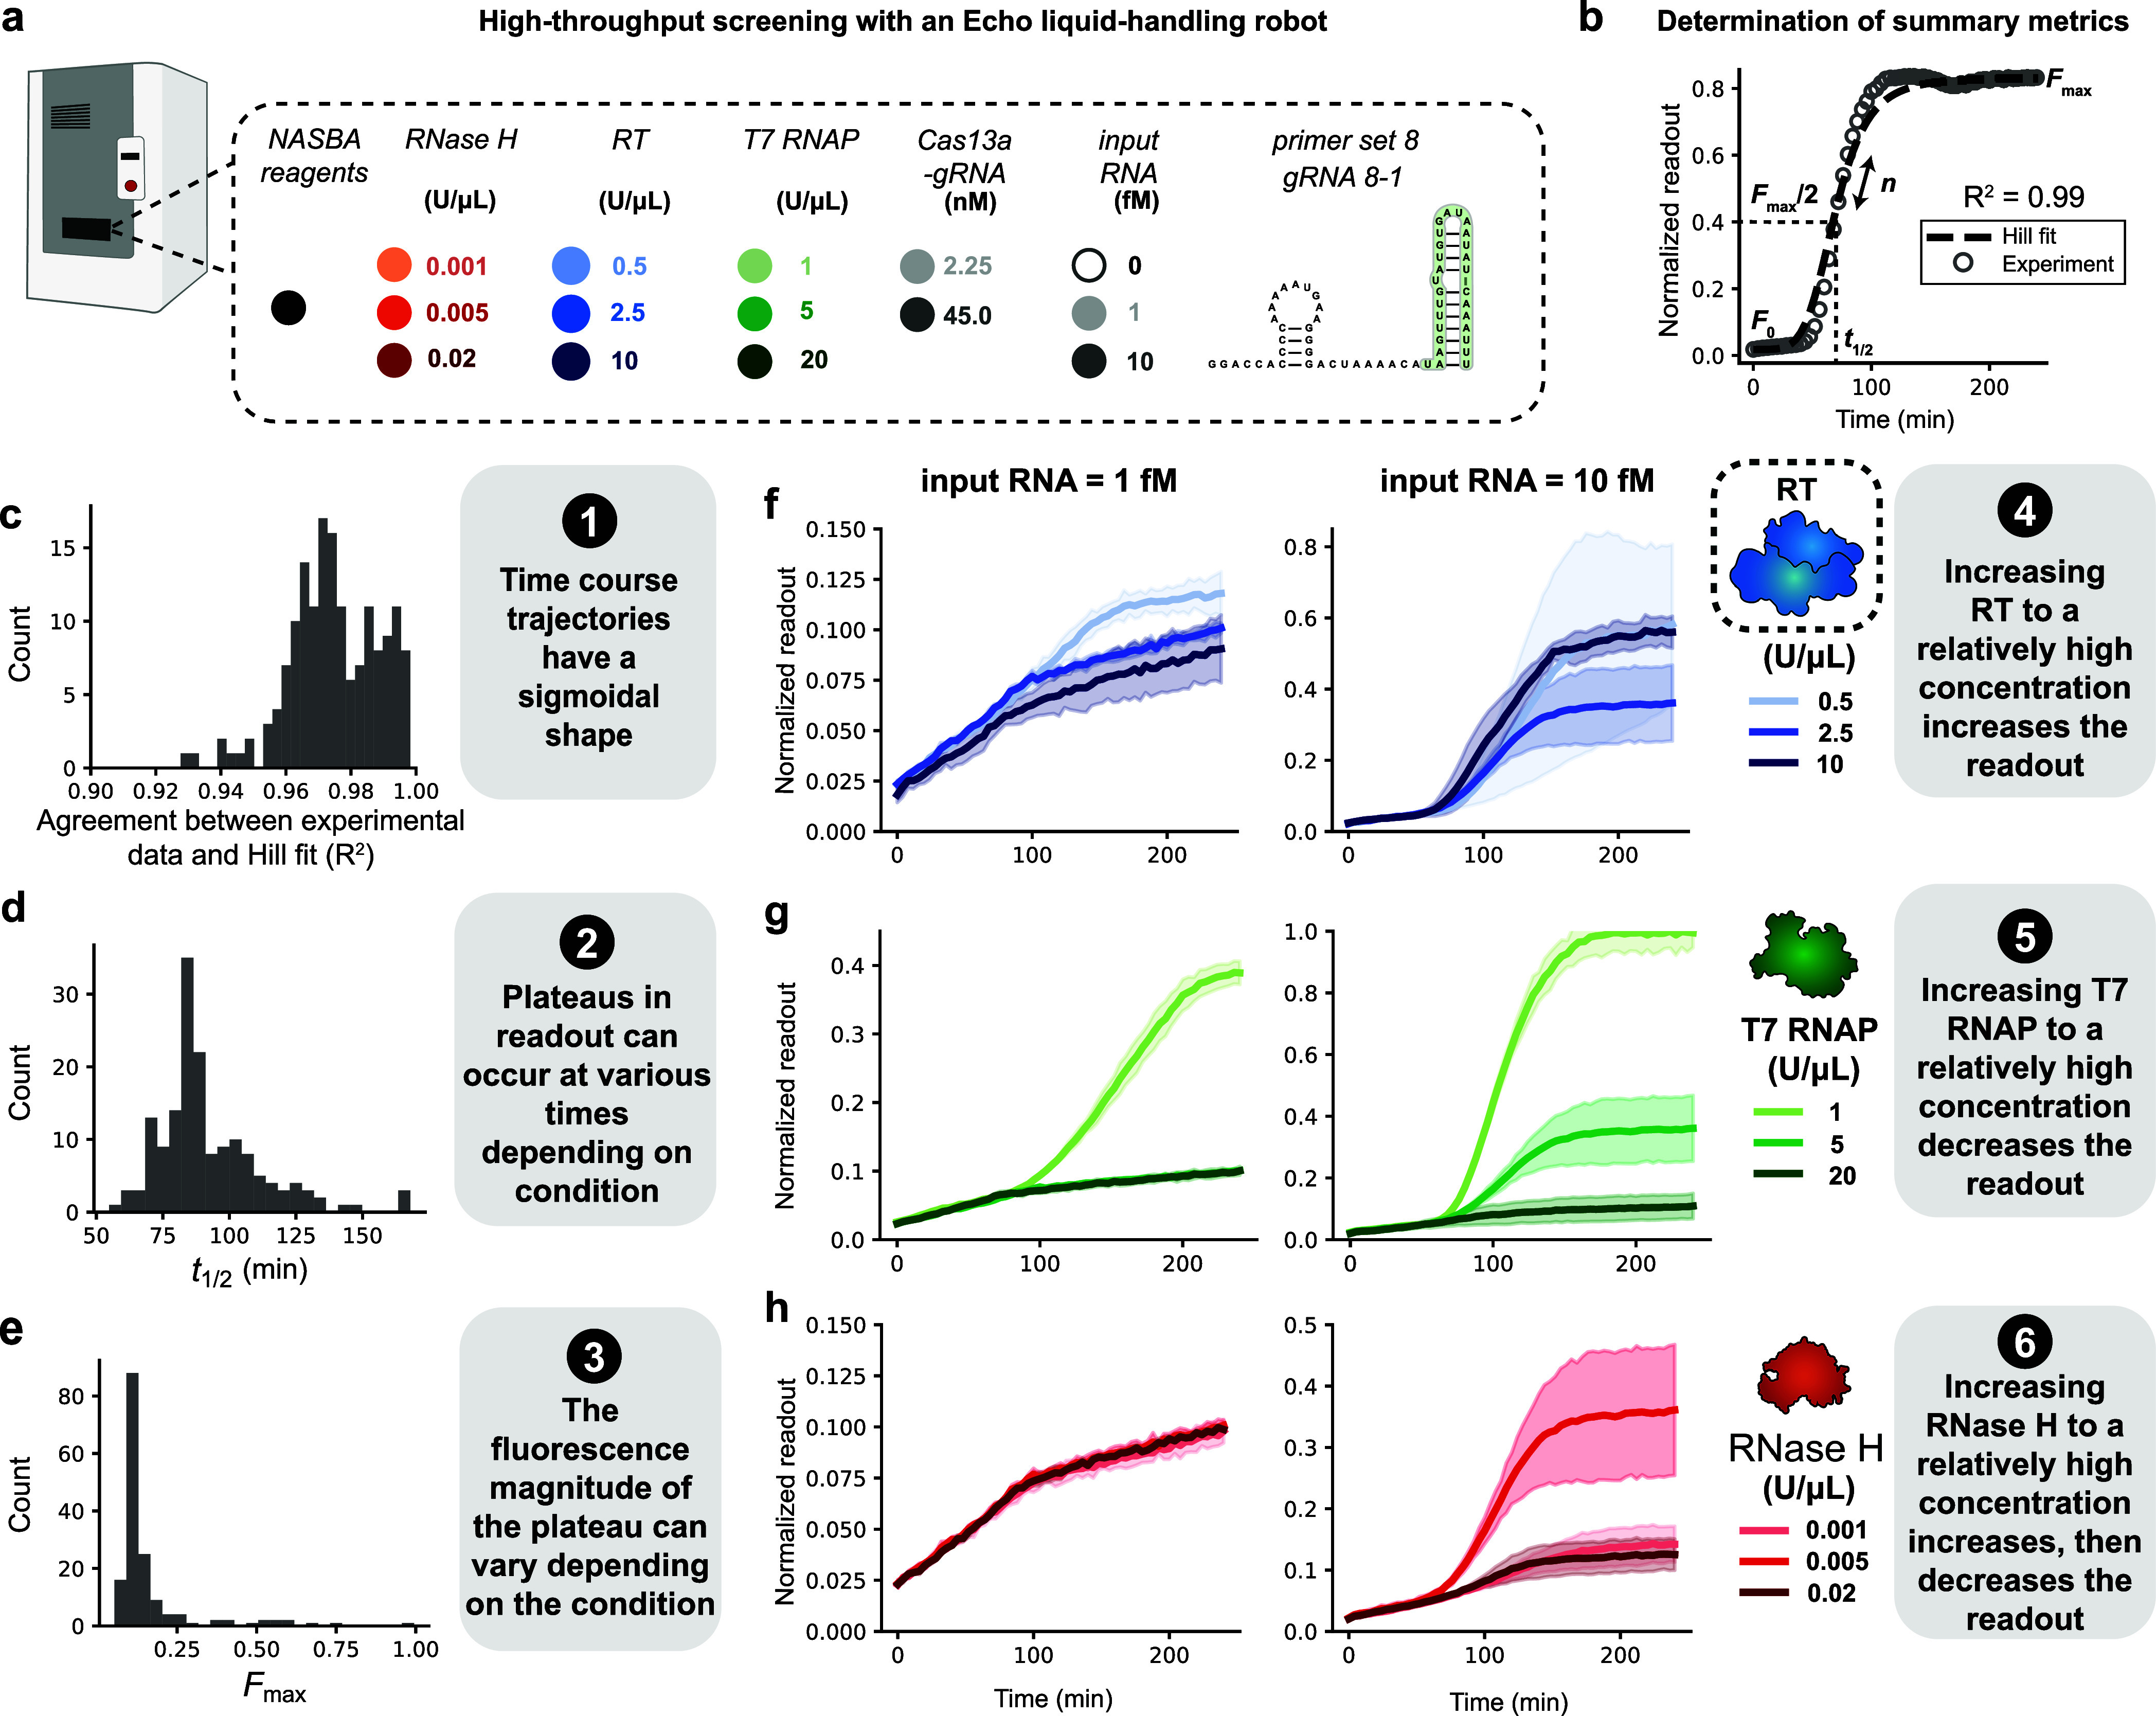
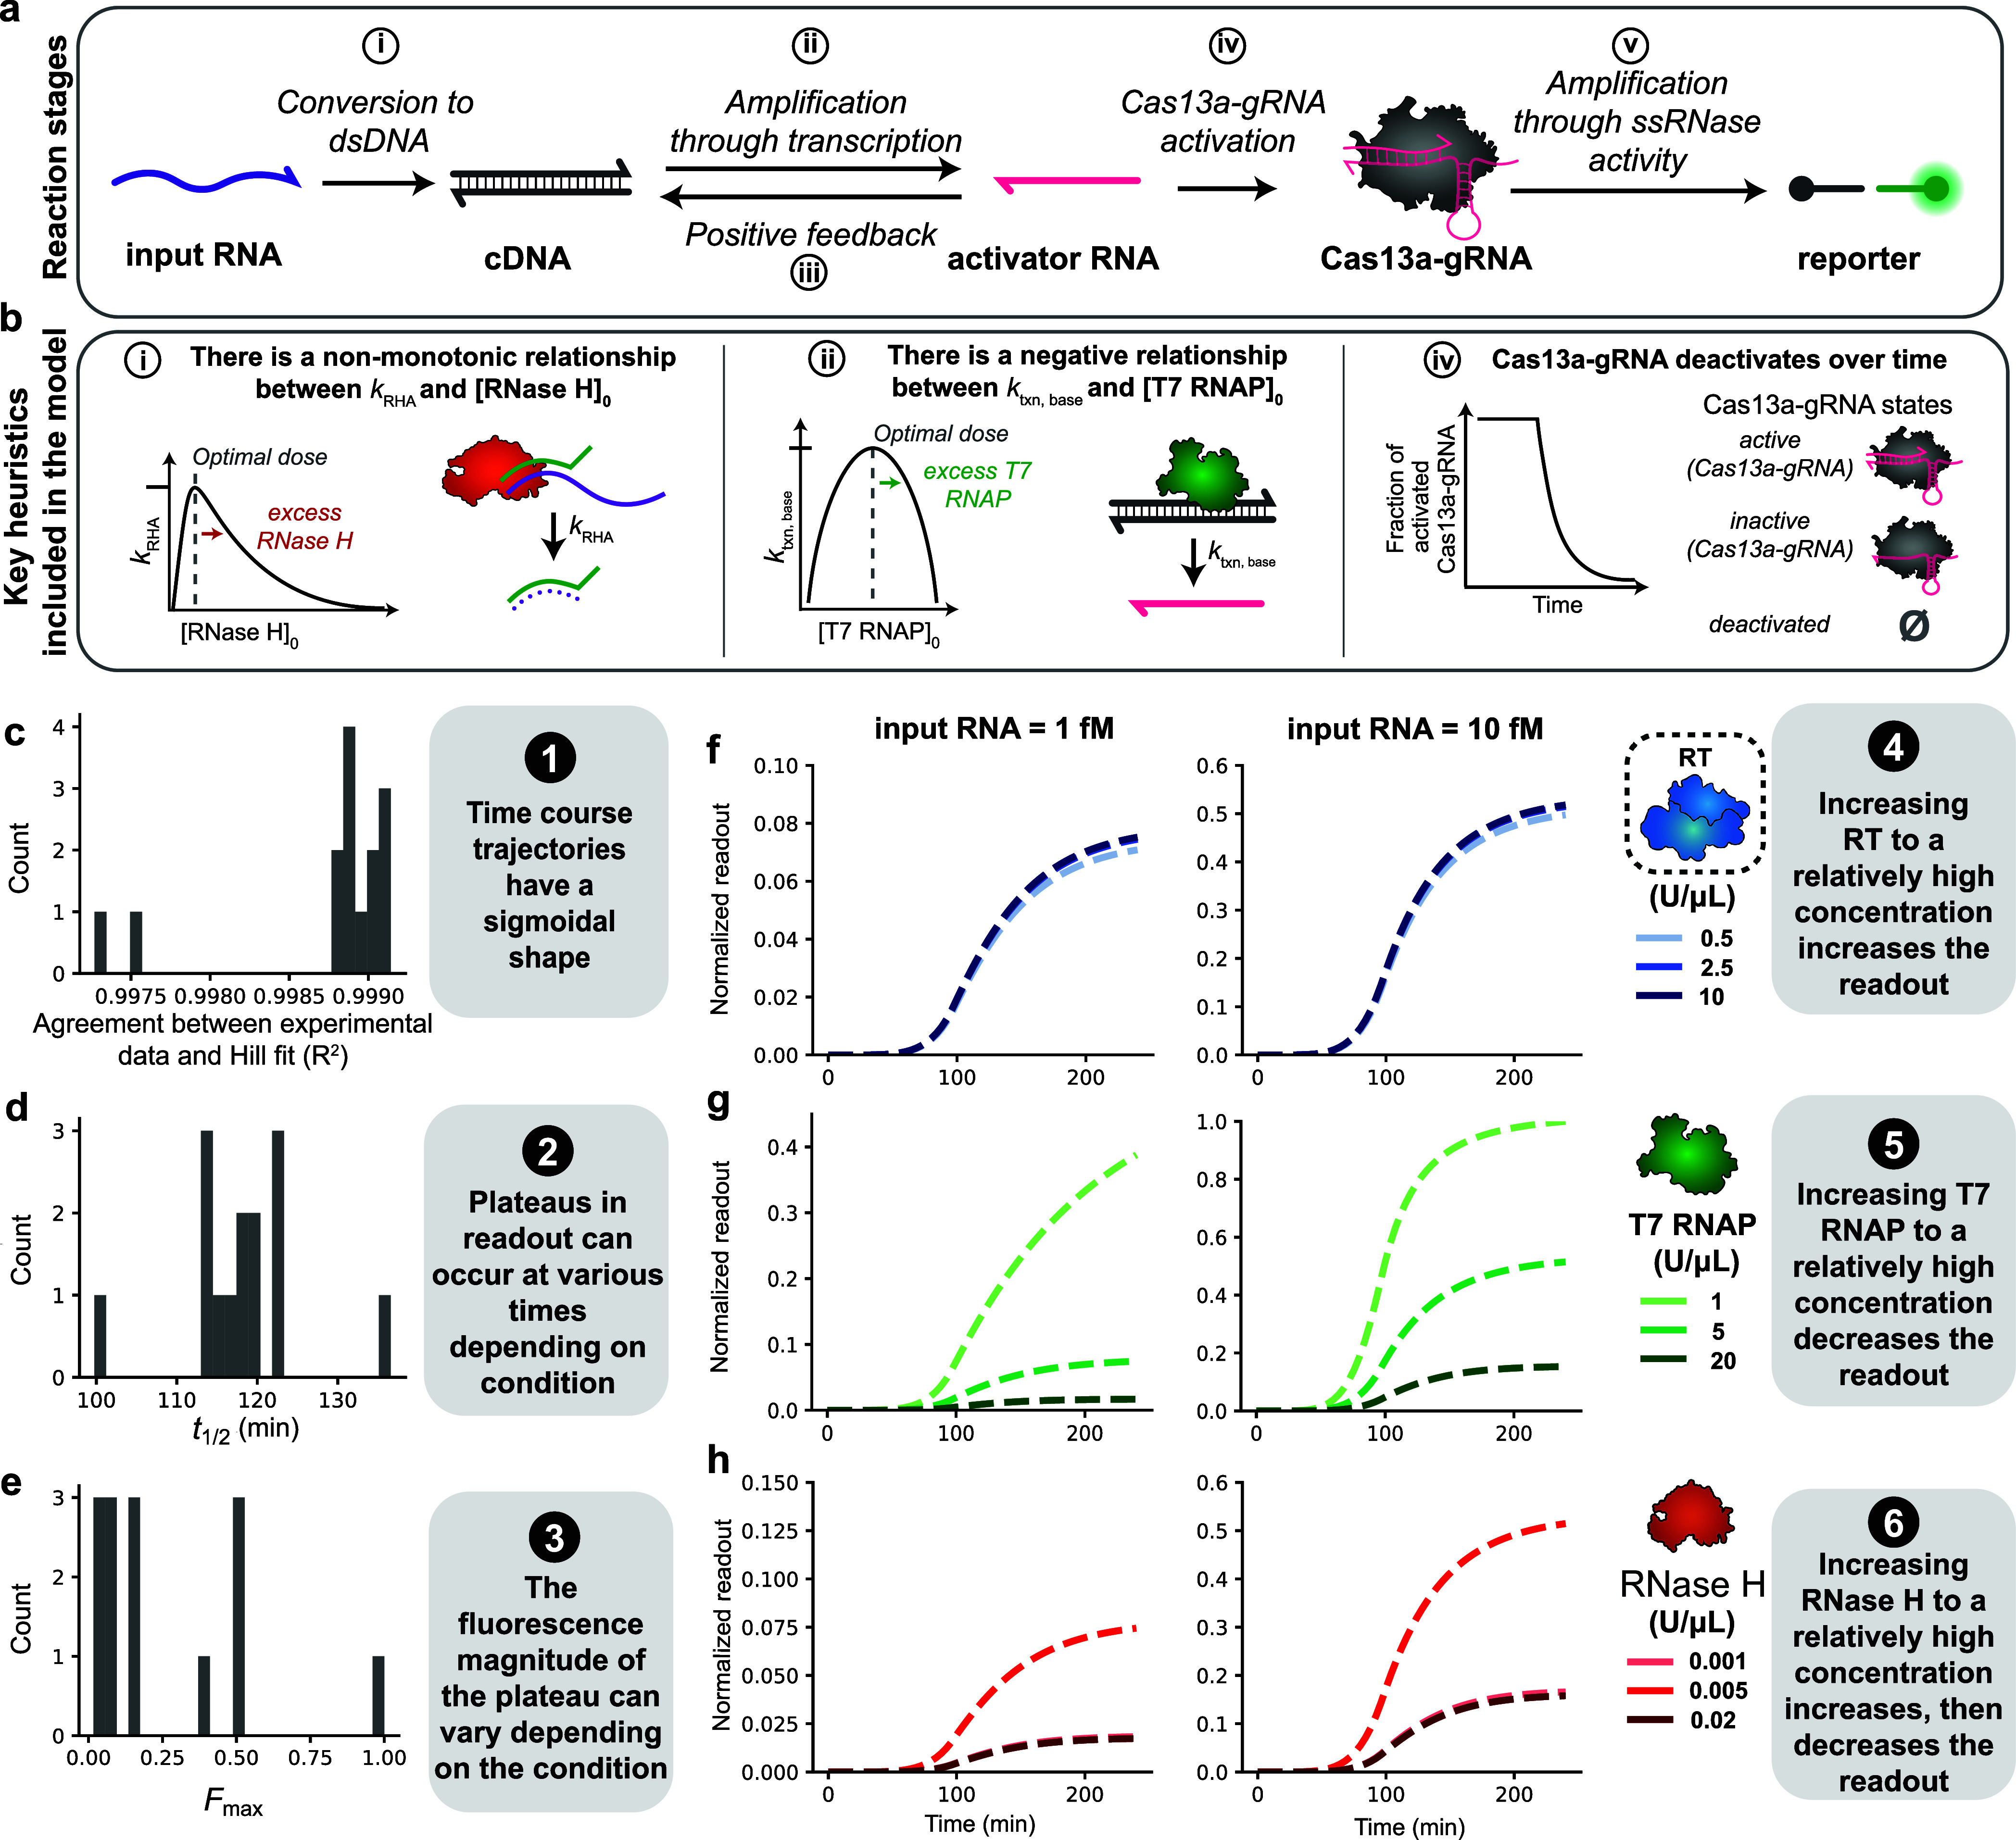
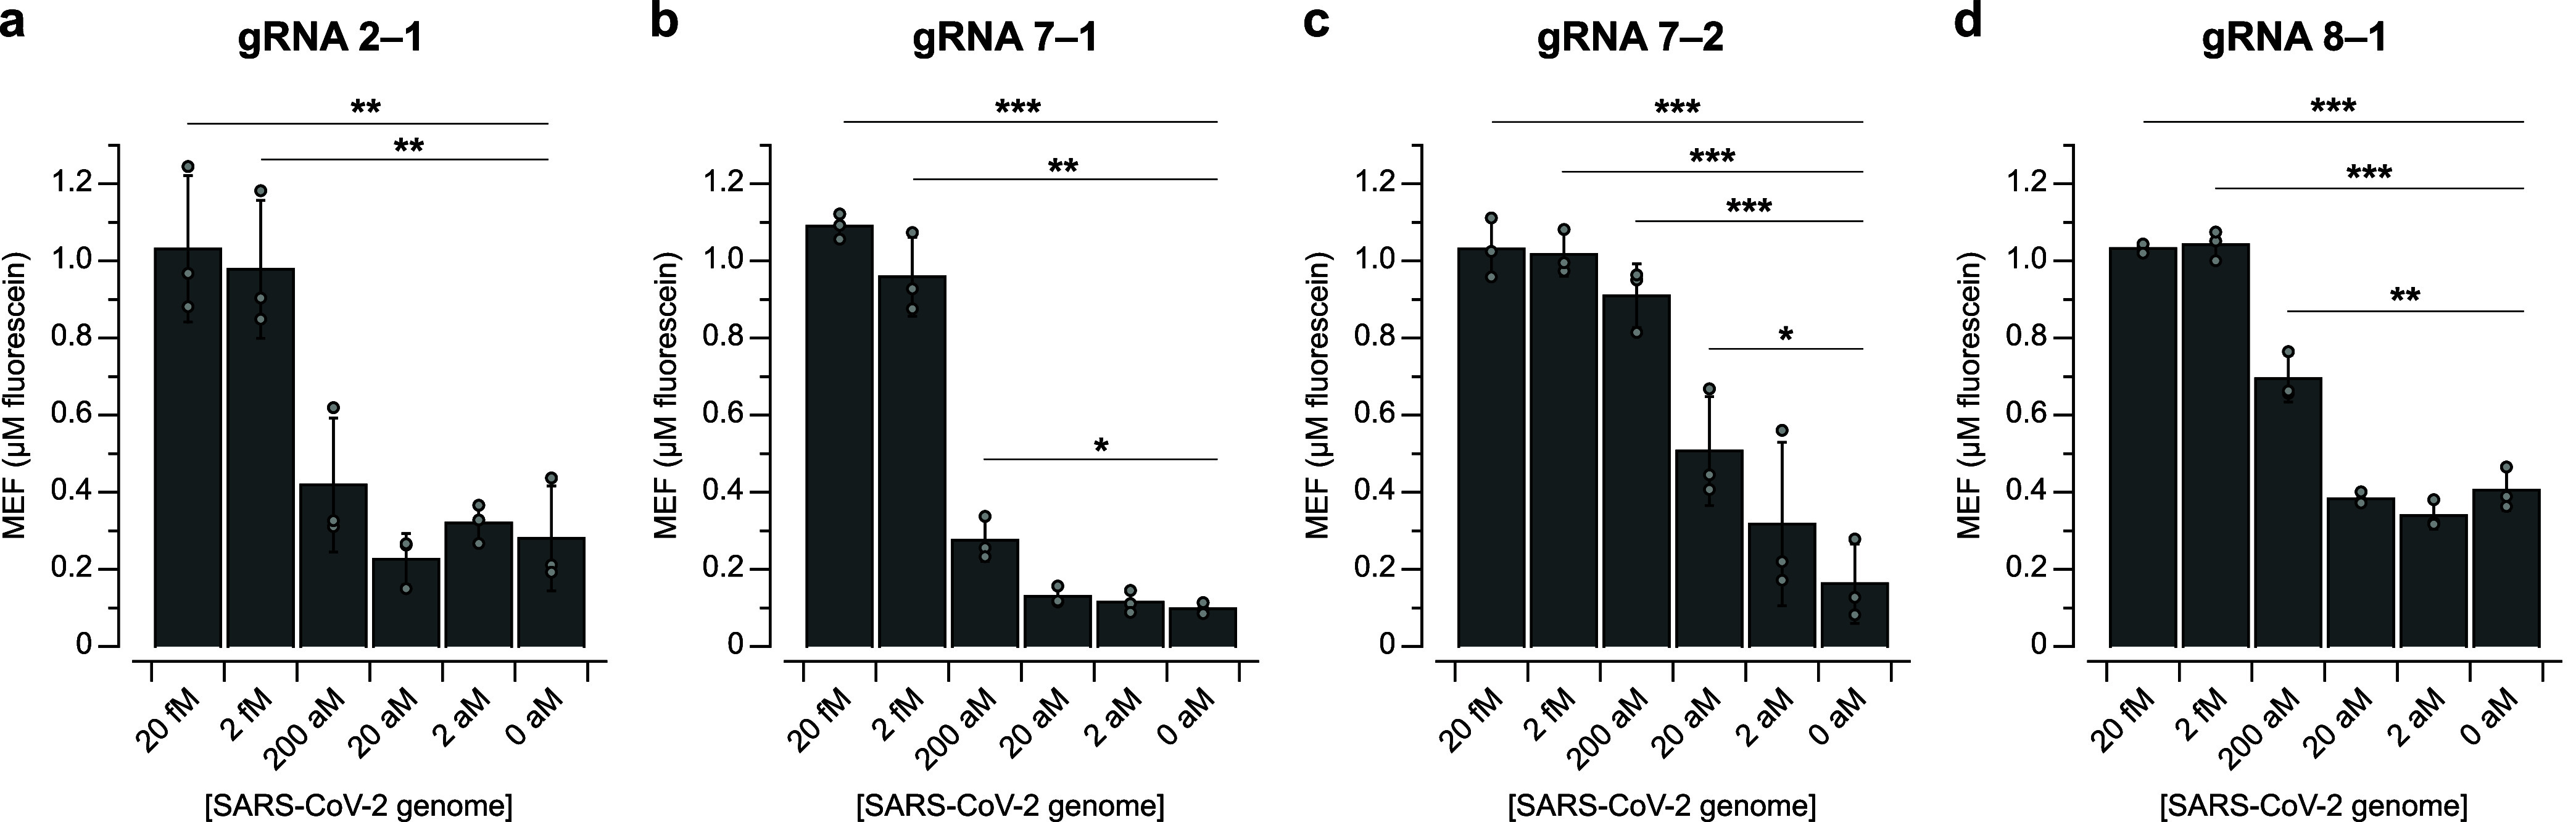
Recent years have seen intense interest in the development of point-of-care nucleic acid diagnostic technologies to address the scaling limitations of laboratory-based approaches. Chief among these are combinations of isothermal amplification approaches with CRISPR-based detection and readouts of target products. Here, we contribute to the growing body of rapid, programmable point-of-care pathogen tests by developing and optimizing a one-pot NASBA-Cas13a nucleic acid detection assay. This test uses the isothermal amplification technique NASBA to amplify target viral nucleic acids, followed by the Cas13a-based detection of amplified sequences. We first demonstrate an in-house formulation of NASBA that enables the optimization of individual NASBA components. We then present design rules for NASBA primer sets and LbuCas13a guide RNAs for the fast and sensitive detection of SARS-CoV-2 viral RNA fragments, resulting in 20-200 aM sensitivity. Finally, we explore the combination of high-throughput assay condition screening with mechanistic ordinary differential equation modeling of the reaction scheme to gain a deeper understanding of the NASBA-Cas13a system. This work presents a framework for developing a mechanistic understanding of reaction performance and optimization that uses both experiments and modeling, which we anticipate will be useful in developing future nucleic acid detection technologies.

Keywords: CRISPR-Cas; NASBA; ODE modeling; POC pathogen tests.


Conflict of interest statement

The authors declare the following competing financial interest(s): K.K.A., M.C.J., and J.B.L. are founders and have financial interest in Stemloop, Inc., and these interests are reviewed and managed by Northwestern University and Stanford University in accordance with their conflict-of-interest policies.

Figures

Figure 1
Figure 1
In-house NASBA formulation provides flexibility for reaction optimization. (a) Schematic overview of NASBA, which uses cycles of reverse transcription, RNase H-mediated degradation, and T7 transcription to convert and amplify an input RNA into an antisense activator RNA. The antisense activator serves as an input to Cas13a-based detection which generates a fluorescent output signal. In-house NASBA formulation enables screening of different reverse transcriptases (RTs). One-pot in-house NASBA-Cas13a targeting the ORF1ab of the SARS-CoV-2 genome, with 0, 2, or 20 fM synthetic SARS-CoV-2 genome and 1 U/μL of (b) avian myeloblastosis virus (AMV) RT, (c) ProtoScript II RT, or (d) Moloney murine leukemia virus (M-MuLV) RT. Readout was observed only with M-MuLV RT. (e) Schematic of the steps in NASBA with a cartoon of viral genome structures that could influence where NASBA primers bind and impact NASBA efficiency. (f) To test different primer sets, RNA products were extracted from one-pot NASBA (lacking Cas13a) and analyzed by urea-PAGE. Reactions were initiated using 2.5 U/μL M-MuLV RT with 0 (−) or 20 (+) fM synthetic SARS-CoV-2 genome. The expected RNA product for each primer set is boxed and its length is indicated, unless the band was not present as in the case of sets 1 and 6 (expected products 104 nt and 164 nt, respectively). Data in (b–d) are n = 3 independent experimental replicates, each plotted as a line with raw fluorescence standardized to MEF. Shading in (b–d) indicates the average of the replicates ± standard deviation. Data in (f) are one representative of n = 3 independent experimental replicates; the other replicates and the uncropped, unprocessed image in (f) are in Supporting Data 2. Sequences of primers and gRNAs are listed in Supporting Data 1.
Figure 2
Figure 2
Screening of LbuCas13a gRNAs identifies factors that could impact cleavage efficiency. (a) Predicted secondary structure of activator RNA 7 generated from NASBA with Primer Set 7. Regions targeted by gRNAs are shaded in different colors. Fluorescence kinetics from NASBA-Cas13a at varying concentrations of synthetic SARS-CoV-2 genome with (b) gRNA 7–1, (b) gRNA 7–2, or (d) gRNA 7–3 with predicted secondary structures of each gRNA shown above. The spacer sequences of gRNA 7–2 (highlighted in yellow) and gRNA 7–3 (highlighted in blue) share 1-nt and 2-nt overlap with the 3′ end of the LbuCas13a gRNA scaffold (GGACCACCCCAAAAAUGAAGGGGACUAAAACA), respectively. (e) Predicted secondary structure of activator RNA 8 generated from NASBA with Primer Set 8. Regions targeted by gRNAs are shaded in different colors. Fluorescence kinetics from NASBA-Cas13a at varying concentrations of synthetic SARS-CoV-2 genome with (f) gRNA 8–1, (g) gRNA 8–2, or (h) gRNA 8–3 with predicted secondary structures of each gRNA shown above. Data are n = 3 independent experimental replicates, each plotted as a line with raw fluorescence standardized to MEF. Shading indicates the average of the replicates ± standard deviation.
Figure 3
Figure 3
High-throughput screening of the enzyme concentration landscape suggests model assumptions and reveals reaction design principles, shown for Data Set 2. (a) Different amounts of input RNA, RT, T7 RNAP, RNase H, and Cas13a-gRNA were dispensed in triplicate (independent replicates) using an Echo liquid handling platform. Assembled NASBA-Cas13a reactions were run and fluorescence data was collected and averaged across triplicate measurements to arrive at a mean dynamic trajectory. The dynamic trajectory was then normalized by the maximum readout value, such that the maximum readout value across the entire experiment (all conditions) was set to 1. (b) Hill functions were fit to each normalized time course trajectory, and summary metrics (n, t1/2, F0, and Fmax) were parametrized. A representative time course trajectory and Hill plot is shown as an example. (c) For each time course, R2 values for the normalized experimental data (points) and Hill fit (dotted line) were calculated and plotted as a histogram. Histograms of values across all conditions were computed for: (d) t1/2 and (e) Fmax. (f–h) Time course trajectories for data subsets varying: (f) RT, (g) T7 RNAP, and (h) RNase H, each using two different input RNA concentrations. Shading indicates the average of the triplicates ± standard deviation. This process was repeated for each experimental data set, but Data Set 2 is highlighted here because it was in closest alignment with all modeling objectives.
Figure 4
Figure 4
Mathematical modeling recapitulates key experimental observations. (a) Schematic of key reaction stages (top) and mechanisms (bottom) in the model. A more detailed depiction of the model is in Figure S21. (b) Key mechanisms included in the model. Each mechanism is involved in the reaction stage indicated to the left of each mechanism description. (c–h) Hill-like functions were fit to each simulated time course trajectory, and summary metrics (n, t1/2, F0, and Fmax) were parametrized (Figure 3b is a visual representation of these metrics). (c) For each time course, R2 for the normalized simulated data and Hill fit was calculated; values are plotted as a histogram. Histograms of values across all conditions in the simulated training data set were calculated for: (d) t1/2 and (e) Fmax. (f–h) Time course trajectories for simulated data subsets: (f) midrange RNase H and T7 RNAP and high Cas13a-gRNA, (g) midrange RNase H and RT and high Cas13a-gRNA, and (h) midrange T7 RNAP and RT and high Cas13a-gRNA.
Figure 5
Figure 5
Limit of detection analysis. Fluorescence values at 150 min from NASBA-Cas13a with varying concentrations of synthetic SARS-CoV-2 genome using (a) gRNA 2–1, (b) gRNA 7–1, (c) gRNA 7–2, or (d) gRNA 8–1. Data are n = 3 independent experimental replicates, each plotted as a point with raw fluorescence values standardized to MEF. Bar height represents the average of the replicates. Error bars indicate the average of the replicates ± standard deviation. Input RNA concentrations for which signal is distinguishable from background (without input RNA) were determined using a two-sided, heteroscedastic Student’s t-test. ***P < 0.001, **P = 0.001–0.01, *P = 0.01–0.05. P values and degrees of freedom are listed in Supporting Data 3.

Update of

Similar articles

Cited by

References

    1. Gootenberg J. S.; Abudayyeh O. O.; Lee J. W.; Essletzbichler P.; Dy A. J.; Joung J.; Verdine V.; Donghia N.; Daringer N. M.; Freije C. A.; Myhrvold C.; Bhattacharyya R. P.; Livny J.; Regev A.; Koonin E. V.; Hung D. T.; Sabeti P. C.; Collins J. J.; Zhang F. Nucleic Acid Detection with CRISPR-Cas13a/C2c2. Science 2017, 356 (6336), 438–442. 10.1126/science.aam9321. - DOI - PMC - PubMed
    1. Chen J. S.; Ma E.; Harrington L. B.; Da Costa M.; Tian X.; Palefsky J. M.; Doudna J. A. CRISPR-Cas12a Target Binding Unleashes Indiscriminate Single-Stranded DNase Activity. Science 2018, 360 (6387), 436–439. 10.1126/science.aar6245. - DOI - PMC - PubMed
    1. Joung J.; Ladha A.; Saito M.; Kim N.-G.; Woolley A. E.; Segel M.; Barretto R. P. J.; Ranu A.; Macrae R. K.; Faure G.; Ioannidi E. I.; Krajeski R. N.; Bruneau R.; Huang M.-L. W.; Yu X. G.; Li J. Z.; Walker B. D.; Hung D. T.; Greninger A. L.; Jerome K. R.; Gootenberg J. S.; Abudayyeh O. O.; Zhang F. Detection of SARS-CoV-2 with SHERLOCK One-Pot Testing. N. Engl. J. Med. 2020, 383 (15), 1492–1494. 10.1056/NEJMc2026172. - DOI - PMC - PubMed
    1. Gootenberg J. S.; Abudayyeh O. O.; Kellner M. J.; Joung J.; Collins J. J.; Zhang F. Multiplexed and Portable Nucleic Acid Detection Platform with Cas13, Cas12a, and Csm6. Science 2018, 360 (6387), 439–444. 10.1126/science.aaq0179. - DOI - PMC - PubMed
    1. Harrington L. B.; Burstein D.; Chen J. S.; Paez-Espino D.; Ma E.; Witte I. P.; Cofsky J. C.; Kyrpides N. C.; Banfield J. F.; Doudna J. A. Programmed DNA Destruction by Miniature CRISPR-Cas14 Enzymes. Science 2018, 362 (6416), 839–842. 10.1126/science.aav4294. - DOI - PMC - PubMed

Publication types

MeSH terms

Supplementary concepts