

Primary Stability of Dental Implants in Human Jawbones: Experiments & FE Analyses
- PMID: 39670698
- PMCID: PMC11891032
- DOI: 10.1111/clr.14386
Primary Stability of Dental Implants in Human Jawbones: Experiments & FE Analyses
Abstract
Objectives: Primary stability (PS) is a key factor for promoting osseointegration and long-term success of dental implants particularly for immediate loading protocols. Beyond the current assessments of PS, an accurate pre-operative evaluation of PS would contribute to the improvement of surgical planning and treatment outcome. This study used biomechanical testing and homogenized finite element (hFE) analysis to objectively measure PS in the laboratory, and digitally estimate PS from prior μCT reconstructions.
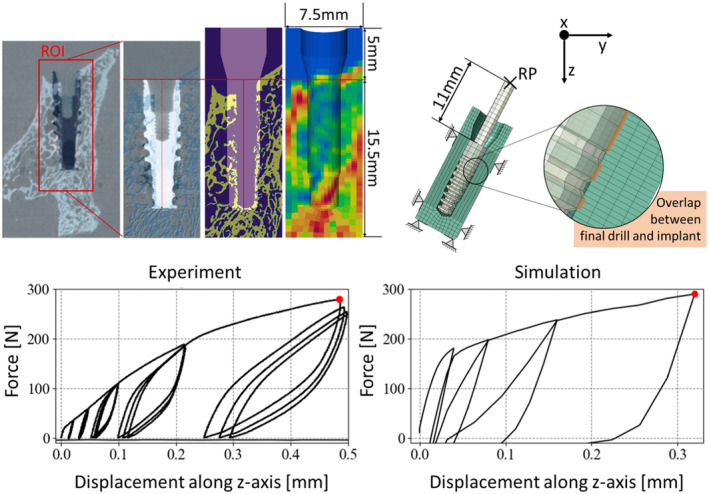
Material and methods: Thirty-five bone samples extracted from the jaws of two donors were examined. Twenty-two were finally evaluated for PS. After scanning of the samples with μCT, implants were inserted by two experienced surgeons, and various metrics such as μCT-based bone volume fraction (BV/TV), insertion torque (IT), and resonance frequency analysis (RFA) were assessed to determine PS. Mechanical tests were conducted to measure ultimate force (UFexp) as an objective indicator of PS while the hFE simulations were performed to estimate this same ultimate force (UFsim).
Results: Higher correlation was found between UFsim and UFexp (R2 = 0.85) than between BV/TV and UFexp (R2 = 0.61), IT and UFexp (R2 = 0.50), and RFA and UFexp (R2 = 0.38). All variables demonstrated a statistically significant linear correlation with UFexp (p < 0.01).
Conclusion: UFsim turns out to be a more reliable and objective indicator of PS than IT and RFA. The hFE analysis requires prior μCT reconstructions and is currently limited by numerical convergence problems. Despite these limitations, pre-operative hFE analysis emerges as a promising tool with a higher accuracy for estimation of PS than state of care techniques.
Keywords: FE‐analysis; dental implants; human jaw; insertion torque; primary stability prediction; ultimate force.
© 2024 The Author(s). Clinical Oral Implants Research published by John Wiley & Sons Ltd.
Conflict of interest statement
The authors declare no conflicts of interest.
Figures


References
-
- Arias‐Moreno, A. J. , Hosseini H. S., Bevers M., Ito K., Zysset P., and Van Rietbergen B.. 2019. “Validation of Distal Radius Failure Load Predictions by Homogenized‐ and Micro‐Finite Element Analyses Based on Second‐Generation High‐Resolution Peripheral Quantitative CT Images.” Osteoporosis International 30, no. 7: 1433–1443. 10.1007/s00198-019-04935-6. - DOI - PMC - PubMed
-
- Atwood, D. A. 1963. “Postextraction Changes in the Adult Mandible as Illustrated by Microradiographs of Midsagittal Sections and Serial Cephalometric Roentgenograms.” Journal of Prosthetic Dentistry 13, no. 5: 810–824. 10.1016/0022-3913(63)90225-7. - DOI
