. 2025 Feb 5;16(2):e0327824.
doi: 10.1128/mbio.03278-24. Epub 2024 Dec 13.

The Campylobacter jejuni BumS sensor phosphatase detects the branched short-chain fatty acids isobutyrate and isovalerate as direct cues for signal transduction

Affiliations

The Campylobacter jejuni BumS sensor phosphatase detects the branched short-chain fatty acids isobutyrate and isovalerate as direct cues for signal transduction

Nestor Ruiz et al. mBio. .

Abstract

Two-component signal transduction systems (TCSs) are nearly ubiquitous across bacterial species and enable bacteria to sense and respond to specific cues for environmental adaptation. The Campylobacter jejuni BumSR TCS is unusual in that the BumS sensor exclusively functions as a phosphatase rather than a kinase to control phosphorylated levels of its cognate BumR response regulator (P-BumR). We previously found that BumSR directs a response to the short-chain fatty acid butyrate generated by resident microbiota so that C. jejuni identifies ideal lower intestinal niches in avian and human hosts for colonization. However, butyrate is an indirect cue for BumS and did not inhibit in vitro BumS phosphatase activity for P-BumR. In this work, we expanded the repertoire of lower intestinal metabolites that are cues sensed by BumS that modulate the expression of genes required for colonization to include the branched short-chain fatty acids isobutyrate and isovalerate. Unlike butyrate, isobutyrate and isovalerate inhibited in vitro BumS phosphatase activity for P-BumR, indicating that these metabolites are direct cues for BumS. Isobutyrate and isovalerate reduced the thermostability of BumS and caused a reorganization of protein structure to suggest how sensing these cues inhibits phosphatase activity. We also identified residues in the BumS sensory domain required to detect isobutyrate, isovalerate, and butyrate and for optimal colonization of hosts to reveal how gut bacteria can recognize these intestinal metabolites. Our work reveals how this unusual bacterial sensor phosphatase senses a repertoire of intestinal metabolites and how cues alter BumSR signal transduction to influence C. jejuni colonization of hosts.IMPORTANCETCSs are prevalent in many bacteria, but the cues sensed by each are not actually known for many of these systems. Microbiota-generated butyrate in human and avian hosts is detected by the Campylobacter jejuni BumS sensor phosphatase so that the bacterium identifies ideal lower intestinal niches for colonization. However, BumS only indirectly senses butyrate to inhibit dephosphorylation of its cognate BumR response regulator. Here, we expanded the repertoire of cues sensed by BumS to the branched-short chain fatty acids isobutyrate and isovalerate that are also abundant in the lower intestines. Both isobutyrate and isovalerate are potent, direct cues for BumS, whereas butyrate is an indirect cue. Leveraging isobutyrate and isovalerate as direct cues, we reveal BumS structure is altered upon cue detection to inhibit its phosphatase activity. We provide an understanding of the mechanics of an unusual mode of signal transduction executed by BumSR and other bacterial sensor phosphatase-driven TCSs.

Keywords: BumS; Campylobacter jejuni; butyrate; isobutyrate; isovalerate; sensor phosphatase; two-component signal transduction system.


Conflict of interest statement

The authors declare no conflict of interest.

Figures

Fig 1
Fig 1
Comparative signal transduction mechanisms of canonical TCS and the sensor phosphatase-driven BumSR TCS. (A) Most TCSs use a cue-dependent sensor histidine kinase (HK) with an opposing phosphatase activity to control phosphorylated levels of a cognate response regulator (RR) for an output response. For example, the HK pool may shift toward a net kinase activity to increase the levels of P-RR to mediate a response as cue concentrations increase. (B) In contrast, Campylobacter jejuni BumS is a sensor phosphatase whose activity is modulated by cues to control the level of phosphorylated BumR, which must be modified with a non-cognate endogenous phosphodonor to alter the transcription of target genes. High P-BumR levels lead to increased DNA binding to cause transcriptional activation of some genes such as Cjj0438 and transcriptional repression of other genes such as peb3. Decreased phosphorylation of BumR leads to reduced transcription of Cjj0438 and increased derepression of transcription of peb3.
Fig 2
Fig 2
BumS phosphatase activity for P-BumR with and without potential intestinal metabolic cues. (A) Dephosphorylation of 32P-BumR to BumR by BumS in the presence of metabolites shown in panel B. Indicated concentrations of metabolites were added to BumS before addition to 32P-BumR. (B) Quantitation of the level of BumS phosphatase activity by densitometry. Assays were performed in triplicate with one assay shown in panel A. The level of 32P-BumR remaining at the end of the assay for each reaction was compared with 32P-BumR alone. Percent BumS phosphatase activity was calculated relative to that of WT BumS without metabolites, which was set at 100%. Points indicate the mean BumS phosphatase activity with each metabolite at each concentration. Error bars indicate standard deviation. Statistical significance of the difference in BumS phosphatase activity with the metabolite at the indicated concentration compared with BumS without the metabolite was calculated by analysis of variance (ANOVA) multiple comparison test (*, P < 0.05 between the metabolite at the indicated concentration).
Fig 3
Fig 3
Expression of peb3 and Cjj0438 in C. jejuni grown with metabolites. (A and B) qRT-PCR analysis of (A) peb3 and (B) Cjj0438 transcription in WT C. jejuni grown in CDM (black) or CDM with butyrate (red), isobutyrate (blue), or isovalerate (gold) at the indicated concentration. Level of expression in WT with metabolites is relative to WT in CDM alone, which was set to 1. The results from a representative assay with WT C. jejuni tested with each metabolite in triplicate are shown. Error bars indicate standard deviations of the average level of gene expression. Statistical significance in peb3 or Cjj0438 expression with the inclusion of a metabolite at the indicated concentration compared with the absence of any metabolite was calculated by ANOVA with Tukey’s test (*, P < 0.05 between the metabolite at the indicated concentration). (C and D) Expression of (C) peb3::astA and (D) Cjj0438::astA in WT C. jejuni, ΔbumS, or ΔbumR grown in MH media alone (black) or with 12.5 mM butyrate (red), 3 mM isobutyrate (blue), or 3 mM isovalerate (gold). Reporter activity was monitored by arylsulfatase assays. Expression level in each strain is relative to WT in MH media alone, which was set to 100 units. The results from a representative assay with strains tested with each metabolite in triplicate are shown. Error bars indicate standard deviations of the average level of gene expression. Statistical significance in peb3::astA or Cjj0438::astA expression in the presence of a metabolite at the indicated concentration compared with the absence of any metabolite was calculated by ANOVA with Tukey’s test (*, P < 0.05 between the metabolite at the indicated concentration).
Fig 4
Fig 4
Analysis of the ability of the BumSR TCS to sense and respond to a metabolite mixture. (A and B) Expression of (A) peb3::astA and (B) Cjj0438::astA in WT C. jejuni grown in MH media alone (black) or with single metabolites or a mixture of two or more metabolites at the indicated concentrations. Reporter activity was monitored by arylsulfatase assays. Expression level in each strain is relative to WT in MH media alone, which was set to 100 units. The results from a representative assay with strains tested with each metabolite in triplicate are shown. Error bars indicate standard deviations of the average level of gene expression. Statistical significance in peb3::astA or Cjj0438::astA expression with inclusion of one or more metabolites at the indicated concentration was calculated by ANOVA with Tukey’s test (*, P < 0.05 between metabolites at the indicated concentration compared with the absence of any metabolite; **, P < 0.05 between a mixture of the indicated metabolites compared with isobutyrate alone; ***, P < 0.05 between a mixture of indicated metabolites compared with isovalerate alone). (C) Quantitation of the level of BumS phosphatase activity for 32P-BumR in the presence of isobutyrate and/or isovalerate at the indicated concentration. The level of 32P-BumR remaining at the end of the assay for each reaction was compared with 32P-BumR with WT BumS, which was set at 100%. Points indicate the mean phosphatase activity with each metabolite at each concentration assayed in triplicate. Error bars indicate standard deviation of the average BumS phosphatase activity. Statistical significance of difference in BumS phosphatase activity with the metabolites at the indicated concentration compared with BumS in the absence of the metabolite was calculated by ANOVA multiple comparison test (*, P < 0.05 between BumS with the metabolites at the indicated concentration compared with BumS with 1 mM isobutyrate; **, P < 0.05 between BumS the metabolites at the indicated concentration compared with BumS with 1 mM isovalerate).
Fig 5
Fig 5
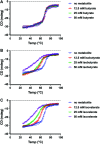
CD spectroscopy analysis of WT BumS with and without cues. Ellipticity (in machine units, i.e., millidegrees; mdeg) of purified WT BumS without metabolites or with (A) butyrate, (B) isobutyrate, or (C) isovalerate was measured at 222 nm. For (A–C), WT BumS was mixed without metabolites (blue, circles) or with 12.5 mM (red, squares), 25 mM (green, triangles), or 50 mM (purple, inverted triangles) of each metabolite. Lines represent fits of data using equation (1) (see Materials and Methods).
Fig 6
Fig 6
Binding sites in the BumS PAS domain. (A) Structural comparison of BumS and CetB PAS domains shown in gray and green, respectively. Key residues for ligand/cofactor binding are labeled on the structure. CetB PAS domain has a conserved tryptophan for FAD binding, whereas BumS PAS domain has a leucine substitution in this position. (B) Sequence conservation of selected homologous PAS domains from BumS orthologs and proteins from other Campylobacterales species (NCBI accessions: WP_153887626.1, WP_131952296.1, WP_148563445.1, WP_142692976.1, WP_193151068.1, WP_151901227.1, WP_013326056.1, WP_129094579.1, WP_129012495.1, WP_069478740.1, and WP_115428278.1). Only key residues are shown. Residue numbers between key residues are shown in parentheses. Substitutions from tryptophan to leucine are highlighted in red. (C). Immunoblot analysis of BumS in whole-cell lysates of WT C. jejuni or C. jejuni expressing indicated BumS mutants from the native chromosomal locus. Specific antiserum to BumS was used. Detection of RpoA serves as a control to ensure equal loading of proteins across strains. (D–F) Expression of peb3::astA in WT C. jejuni (black bars), bumSS20A (grey bars), bumSH51A (yellow bars), bumSL68A (blue bars), bumSN83A (orange bars), or bumSQUAD (red bars) grown in the presence of the indicated concentrations of (D) isobutyrate, (E) isovalerate, or (F) butyrate. Transcriptional reporter activity was monitored by arylsulfatase assays. The level of expression in each strain with a metabolite is relative to the same strain grown without the metabolite, which was set to 100 units. The results from a representative assay with strains tested with each metabolite in triplicate are shown. Error bars indicate standard deviations of the average level of gene expression. Statistical significance in peb3::astA expression in each mutant strain with a particular concentration of metabolite compared with WT C. jejuni with the same concentration of metabolite was calculated by ANOVA with Tukey’s test (*, P < 0.05).
Fig 7
Fig 7
Effect of BumS PAS domain mutations on sensing cues for regulation of gene expression. Quantitation of the level of WT BumS or BumSQUAD phosphatase activity for P-BumR in the presence of isobutyrate or isovalerate at the indicated concentration. Percent phosphatase activity for WT BumS or BumSQUAD with metabolites was calculated based on the level of 32P-BumR remaining at the end of the assay relative to each protein without metabolites. Error bars indicate standard deviation of the average BumS phosphatase activity from three samples. Statistical significance of the difference in BumSQUAD phosphatase activity with the metabolites at the indicated concentration compared with WT BumS with the same level of metabolite was calculated by ANOVA multiple comparison test (*, P < 0.05).
Fig 8
Fig 8
Colonization dynamics of WT C. jejuni and isogenic ΔbumS and bumSQUAD mutants in the avian intestinal tract. Day of hatch chicks were orally infected with approximately 10–200 CFU of WT C. jejuni, isogenic ΔbumS, and bumSQUAD mutants. Chicks were sacrificed at day 7 post-infection, and the levels of each C. jejuni strain in (A) the proximal small intestines, (B) distal small intestines, (C) ceca, and (D) large intestines were determined (reported as CFU per gram of content). Each closed circle represents the level of C. jejuni in a single chick. Open circles represent chicks with C. jejuni levels below the limit of detection (<100 CFU per gram of content; dotted lines). Red bars represent the geometric mean for each group. Statistical analysis was performed using the Mann-Whitney U test (*, P < 0.05 between ΔbumS or bumSQUAD mutants and WT C. jejuni; **, P < 0.05 between bumSQUAD and ΔbumS or mutants).

Similar articles

References

    1. Gumerov VM, Ulrich LE, Zhulin IB. 2024. MiST 4.0: a new release of the microbial signal transduction database, now with a metagenomic component. Nucleic Acids Res 52:D647–D653. doi:10.1093/nar/gkad847 - DOI - PMC - PubMed
    1. Ortet P, Whitworth DE, Santaella C, Achouak W, Barakat M. 2015. P2CS: updates of the prokaryotic two-component systems database. Nucleic Acids Res 43:D536–D541. doi:10.1093/nar/gku968 - DOI - PMC - PubMed
    1. Gao R, Stock AM. 2009. Biological insights from structures of two-component proteins. Annu Rev Microbiol 63:133–154. doi:10.1146/annurev.micro.091208.073214 - DOI - PMC - PubMed
    1. Bhate MP, Molnar KS, Goulian M, DeGrado WF. 2015. Signal transduction in histidine kinases: insights from new structures. Structure 23:981–994. doi:10.1016/j.str.2015.04.002 - DOI - PMC - PubMed
    1. Zschiedrich CP, Keidel V, Szurmant H. 2016. Molecular mechanisms of two-component signal transduction. J Mol Biol 428:3752–3775. doi:10.1016/j.jmb.2016.08.003 - DOI - PMC - PubMed

MeSH terms

LinkOut - more resources