. 2025 Mar 3;222(3):e20231809.
doi: 10.1084/jem.20231809. Epub 2024 Dec 13.

Altered X-chromosome inactivation of the TLR7/8 locus and heterogeneity of pDCs in systemic sclerosis

Affiliations

Altered X-chromosome inactivation of the TLR7/8 locus and heterogeneity of pDCs in systemic sclerosis

Yong Du et al. J Exp Med. .

Abstract

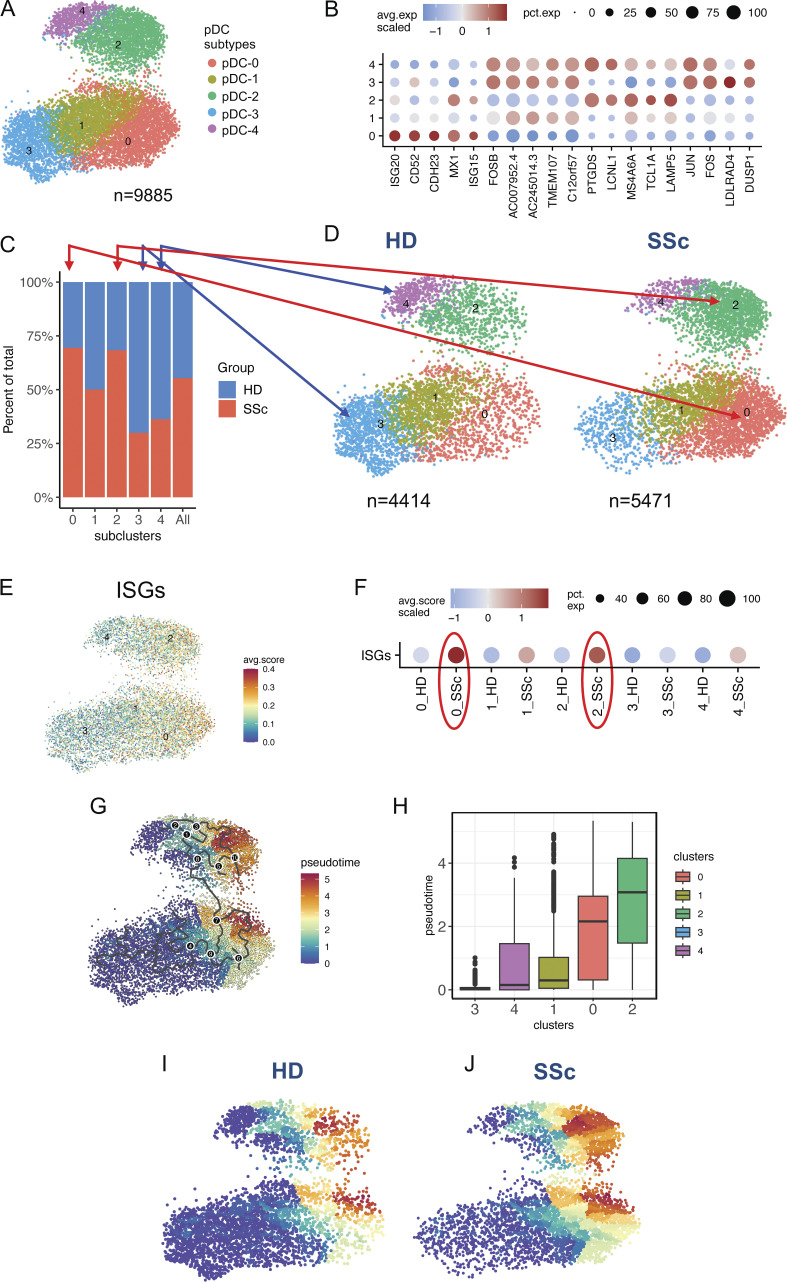
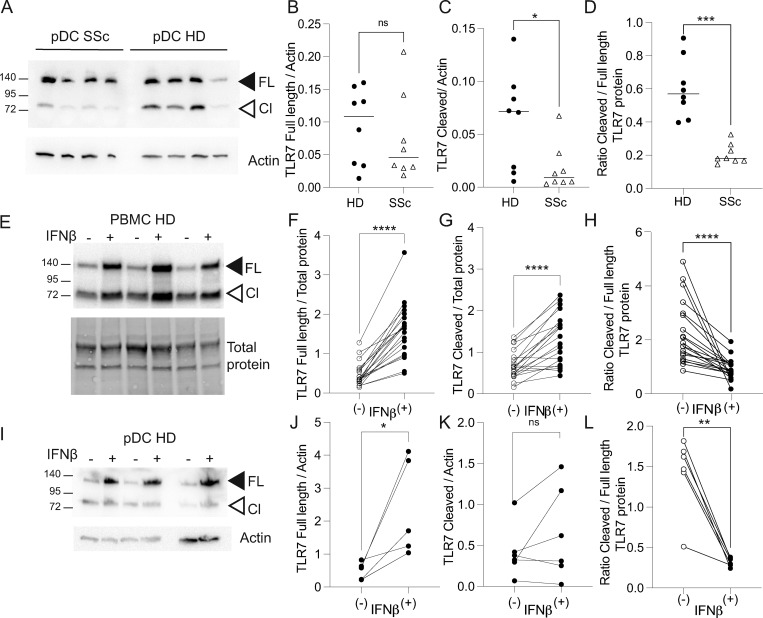
Systemic sclerosis (SSc) is an autoimmune disease that has a strong female predominance. Both the X-linked TLR7 and TLR8 can induce type I IFN (IFN-I) by plasmacytoid DCs (pDCs), which can promote fibrosis. We identified five subclusters of pDCs, including ISGhigh clusters that were over-represented in SSc patients. We observed that both TLR7 and TLR8 genes escape from X chromosome inactivation (XCI) at higher frequency in pDCs of SSc patients, which was associated with changes in TLR7 protein profile. Combined DNA/RNA FISH analysis revealed that the TLR7/8 locus is preferentially located outside of the inactive X (Xi) territory when TLR7 is expressed, suggesting that higher-order loop formation is linked to TLR7/8 expression from the Xi. Furthermore, the expression levels of XIST and the transcriptional repressor SPEN were reduced in SSc pDCs. Hence, our data revealed the heterogeneity of pDCs in SSc and suggested that altered XCI at the TLR7/8 locus may contribute to the chronic IFN-I activity of pDCs in female SSc patients.


Conflict of interest statement

Disclosures: R.F. Spiera reported personal fees from Chemocentryx, AbbVie/Abbott, BMS, Regeneron,Amgen, Vera, GlaxoSmithKline, Novartis, Boehringer Ingelheim, Galderma, Sanofi, Roche Genentech, Cytori, and Astra-Zeneca, and grants from Horizon Pharma, AbbVie/Abbott, AstraZeneca, ChemoCentryx, Corbus, Genentech, GlaxoSmithKline, InflaRx, Kadmon, Novartis, Principia, Roche, Sanofi, Cytori, Boehringer Ingelheim, and Amgen outside the submitted work. M.-E. Truchetet reported personal fees from Abbvie, Boehringer, Janssen, Lilly, and Astrazeneca outside the submitted work. F.J. Barrat reported “other” from Ipinovyx Bio and Epistemyx Bio outside the submitted work. No other disclosures were reported.

Figures

None
Graphical abstract
Figure 1.
Figure 1.
A pre-enrichment strategy to examine the heterogeneity of pDCs in SSc patients at the single-cell level. (A) Flow chart describing the sample preparation, library construction, and data processing. Frozen PBMCs from four HDs and four diffuse cutaneous SSc patients were sorted to obtain enriched pDCs and T cell–depleted PBMCs fractions, the two fractions were then remerged at 1:2 ratio before loading to 10× single-cell microfluidic chips. After library construction and sequencing, a merged dataset with cells was obtained and batch-corrected using FastMNN in a base of Seurat pipeline. Doublets were removed manually, and the data were visualized by UMAP plots. (B) Cluster annotation of PBMCs. The dot plot represents expression values of selected genes (x axis) across each cluster (y axis). The color intensity indicates the scaled average expression within expressing cells, where red indicates high expression and blue shows low expression. The dot size represents the percentage of cells expressing the marker genes. (C) The UMAP visualization of SCs of merged cells from four healthy and four SSc patients' PBMCs, the putative identity of each cluster was assigned on the basis of B. (D) Comparison of the cell distribution of HDs (blue, n = 13,661 cells) and SSc patients (red, n = 17,714 cells) by UMAP plot. (E) The ratio of the cell number of healthy donors (n = 4) and SSc patients (n = 4) in each SC is shown by a bar plot. (F) Bar plot showing the comparison of the distribution of PBMC SCs between HDs (n = 4) and SSc patients (n = 4). (G) Bar plots highlighting cell abundances of different subtypes of PBMCs for healthy donors (n = 4) and SSc patients (n = 4). (H) Upset plot showing the intersections of the up-regulated (red, log2FC > 0.25, P_adj < 0.05) and down-regulated (blue, log2FC < −0.25, P_adj < 0.05) in different cell types of PBMCs, Wilcoxon rank sum test was used for DEG identification. Statistical significance in G was evaluated using Mann–Whitney U test, and only comparisons that are significant are shown. *P < 0.05.
Figure 2.
Figure 2.
Enr ichment in pDC subsets with high IFN-I signature in SSc patients. (A) UMAP plots of five SCs of pDCs (n = 9,885 cells). (B) A heat map representing scaled expression values of the top five genes defining each SC of pDCs. (C) Bar plots highlighting the percentage of the cell number of HDs and SSc patients in each SC of pDCs. (D) UMAP plots of SCs of pDCs split by healthy (n = 4,414 cells) and SSc donors (n = 5,471 cells). (E) UMAP plot showing the ISGs score in pDCs. (F) The comparison of ISGs score of each SC of pDCs. (G and H) The trajectory analysis of pDCs. (I and J) The UMAP plot shows the trajectory of the pseudotime score in the pDCs of healthy donors and SSc patients, as indicated.
Figure S1.
Figure S1.
Description of the pDC SCs in HDs and SSc patients. (A) Reactome pathway analysis of activated and inactivated pathways in pDCs of SSc patients (n = 4) versus HDs (n = 4). For pathways sharing similar gene sets, only the top first with the highest normalized enriched score (NES) are shown. (B) Gene set enrichment analysis of IFN-α/β pathway in SSc versus healthy pDCs. (C) PCA of pathways activated in each of the pDC SCs. (D) Bar plots highlighting the cell number of the individual HDs (n = 4) and SSc patients (n = 4). (E) UMAP plots of the five SCs of pDCs in each of the individual healthy donors (n = 4) and SSc patients (n = 4). (F) Feature plot showing the expression of AP-1 transcription factors (JUN, FOS, combined JUN+FOS) in different pDC SCs. (G) Violin plot showing the expression of AP-1 transcription factors (JUN, FOS, combined JUN+FOS) and ISGs between HDs and SSc patients. Statistical significance was analyzed using the Wilcoxon rank-sum test; ****P < 0.0001. (H) The correlation of expression between AP-1 transcription factors (combined JUN+FOS) with ISGs score in pDCs of SSc patients as assessed using Pearson correlation, and the corresponding P values were reported (P < 2.2e−16). (I and J) Violin plot showing the expression of CCR2, CCR7 and CXCR3 between (I) HDs and SSc patients and (J) between cells present in the ISGlow and ISGhigh SCs, as indicated. Statistical significance was analyzed using the Wilcoxon rank-sum test and indicated as *P < 0.05, ****P < 0.0001.
Figure 3.
Figure 3.
Evidence for enhanced reactivation of TLR7 from the inactive X chromosome in pDCs of SSc women. (A and B) Representative RNA FISH analysis of pDCs from SSc women and HDs. Z-projection of 3D RNA FISH confocal microscopy planes of cell nuclei hybridized with fluorescent probes for transcripts arising from (A) TLR7 (red) and (B) TLR8 (green). Nuclei were counterstained with DAPI (gray). The arrowheads indicate TLR7 or TLR8 transcript foci occurring on a single X chromosome (monoallelic cells; left panels) or on both X chromosomes (biallelic cells; right panels). Scale bar, 1 µm. (C and D) Quantification of nuclei with one or two RNA FISH signals (mono + biallelic) in pDCs obtained from age-matched control HD (n = 16) and SSc women (n = 21) from four independent experiments (P#01 to P#04); see Table S1. (E) Frequency of TLR7 biallelic nuclei with reference to the total number of positive nuclei (mono + biallelic) in control HD and SSc women from P#01 to P#04 as described in C and D. Statistical differences were analyzed using a paired Student’s t test and indicated as **P < 0.01. (F) Quantification of allelic expression for TLR7 and TLR8 primary transcripts in pooled pDC nuclei from HDs and SSc patients from experiments P#01 to P#04 (C and D). Statistical differences were analyzed using a Fisher’s exact test and indicated as *P < 0.05. (G)TLR7 mRNA relative expression from pooled single-cell sorted pDCs from HDs (n = 500 cells, mean cell number/donor = 100, n = 5) and SSc patients (n = 732, mean cell number/donor = 134, n = 5). Statistical analysis was performed using a Mann–Whitney test and indicated as ***P < 0.001. (H) pDCs from HDs (n = 3) were single-cell sorted before and after overnight incubation with IFN-β (1 ng/ml) and TLR7 expression level was quantified by RT-qPCR as described (Abbas et al., 2022). Statistical differences were analyzed using a paired Student’s t test and is indicated as *P < 0.05, ***P < 0.001. (I–K) pDCs were purified from frozen PBMCs and cultured for 2 days with IL-3 (5 ng/ml) and then incubated with IFN-β (1 ng/ml) for 2 h and processed for RNA FISH analysis with TLR7 (red) and XIST (cyan) specific probes. Representative images showing TLR7 RNA signals colocalized (expressed from the Xi) or far from the XIST cloud (expressed from the Xa), in cells without (left panel) or with IFN-β stimuli (right panel). (J and K) (J) Quantification of TLR7 primary transcripts expression (mono + biallelic cells) and (K) robust XIST RNA cloud formation (Types I–II). (L and M) Sequential RNA-DNA FISH of TLR7 expression from the active (Xa) and/or XIST-coated inactive (Xi) chromosomes (RNA FISH) and localization within the X territory (DNA FISH) in female human pDCs. The left panels show single confocal sections of RNA FISH for TLR7 primary transcripts (red) and XIST RNA (cyan) and right panels show DNA FISH for the TLR7/8 locus (red) and the X chromosomes (green) in the same nuclei. Top row: example of a nucleus with TLR7 expressed from both the Xa (arrowhead) and XIST-coated Xi (white arrow) (biallelic). Bottom row: example of a nucleus with a TLR7 RNA signal from the Xa (arrowhead) but not from the Xi (yellow arrow) (monoallelic). DAPI is shown in gray. Scale bar = 2 µm. (N) Quantification of the Euclidean distance between the TLR7/8 locus and the edge of the nearest X-chromosome territory. n = 109 XIST+ nuclei across five fields of view with no, mono-, or biallelic expression of TLR7. Error bars represent ±SEM, statistical differences between groups were calculated using a one-way ANOVA with Sidack’s multiple comparison test. n.s., not significant; *P < 0.05; **P < 0.01; ***P < 0.001.
Figure S2.
Figure S2.
XIST RNA localization profiles and impact of IFN-I signaling on XCI escape and expression levels of TLR7 in female pDCs. (A) RNA FISH representative images of XIST patterns I–IV from HD (upper panels) and SSc donors (lower panels). Arrowheads point to the different XIST patterns. Scale bars 1 µm. (B) Frequencies of XIST patterns, comparing HDs versus SSc pooled patients in four independent experiments (P#01 to P#04). (C and D) Graphs representing the frequencies among (C) the I and II XIST patterns, and (D) the frequencies of TLR7 biallelic nuclei among pDCs with Type-III and -IV XIST patterns in paired experiments (n = 4). Statistical differences were analyzed using a paired Student’s t test. (E) mRNA TLR7 positive cells in 96-wells plate from HDs (n = 5) and SSc donors (n = 5). Statistical analysis was performed using a Mann–Whitney test. (F) Frequencies of TLR7 biallelic cells, relative to the total TLR7+ nuclei in IL-3-pDCs stimulated or not with IFN-β for 2 h before RNA-FISH (n = 4, pool#5 to #8). (G) Frequencies of TLR7 biallelic nuclei among total nuclei counted from all the pooled donors IFNβ (n = 430) and IFNβ+ (n = 713). Statistical differences were analyzed using a Fisher’s exact test. (H) Frequencies of XIST patterns I–IV comparing cells incubated in medium (−IFN-β) or with IFN-β (n = 4, pool#5 to #8). Statistical analysis performed with a repeated measured one-way ANOVA test. (I) Frequencies of nuclei with XIST Type-I and -II pattern calculated from the total nuclei from all pooled donors, with Medium (IFNβ; n = 1,424) and IFNβ+ (n = 1,810). Statistical analysis was performed using a Fisher exact test. (J) mRNA was isolated from 41 PBMCs samples incubated or not with IFN-β (1 ng/ml) for 3 h. TLR7 and MxA gene expression was analyzed by RT-qPCR and normalized over GAPDH expression. (K) mRNA was isolated from purified pDCs incubated or not with IFN-β (1 ng/ml) for 3 h. TLR7 and MxA gene expression was analyzed by RT-qPCR and normalized over GAPDH expression. Statistical analyses were performed with a Wilcoxon test (J) and a Student’s paired t test (K). *P < 0.05; **P < 0.01; ***P < 0.001.
Figure S3.
Figure S3.
TLR8 signaling induces inflammatory cytokines and IFN-I–driven response in pDCs of patients with SSc. (A–F) Purified pDCs from SSc patients (n = 4) were stimulated with ORN-8L, or left Unstim for 6 h. The RNA was harvested for RNA-seq. (A) PCA of transcriptome in Unstim or TLR8L-stimulated SSc pDCs. (B) Volcano plot comparing gene expression between TLR8L-stimulated and Unstim SSc pDCs. IFN-Is, ISGs, cytokines, and other upregulated genes are labeled in red, purple, green, and grey, respectively. Genes with down-, not significant (NS), and upregulation are shaped by a triangle, square, and circle, respectively. (C and D) Heatmap (LogCPM) comparing TLR8L-stimulated and Unstim SSc pDCs of differentially expressed (C) IFN-Is and (D) inflammatory cytokines with a threshold at Log2FC > 1 and adjusted P value <0.05. (E) Gene set enrichment of Reactome subset of the MSigDB canonical pathways collection of differentially expressed genes of TLR8L versus Unstim condition. (F) Gene set enrichment analysis of genes correlated with top three upregulated pathways by TLR8L stimulation.
Figure 4.
Figure 4.
Levels and distribution of full-length versus cleaved forms of TLR7 protein are altered in pDCs from SSc donors. (A) Representative western blot of sorted pDCs from SSc patients and HDs. Black arrowhead indicates 140 kDa full-length (FL) TLR7, while white arrowhead indicates the 75 kDa cleaved mature form (Cl). Actin is used as a loading control. (B and C) Densitometric analysis of TLR7 full-length and cleaved protein normalized to actin. (D) TLR7 proteins expressed as a ratio of TLR7 cleaved over full length from SSc patients (n = 8) and HDs (n = 8) pDCs. Statistical significance was analyzed using Mann–Whitney t test. *P < 0.05; ***P < 0.001. (E–H) PBMCs (n = 33) were incubated overnight with 1 ng/ml IFN-β and analyzed for TLR7 expression. (F and G) Densitometric analysis of TLR7 full-length and cleaved protein normalized to total protein. TLR7 proteins are expressed as a ratio of TLR7 cleaved over full length. (I–L) Sorted pDCs (n = 6) were incubated overnight with 1 ng/ml IFN-β or left untreated and analyzed for TLR7 expression. (I–K) Densitometric quantification of TLR7 full length and cleaved protein normalized to actin. (L) TLR7 proteins were expressed as a ratio of TLR7 cleaved over full length. (F–H and J–L) Statistical significance was analyzed using Wilcoxon paired t test; *P < 0.05, **P < 0.01, ****P < 0.0001. Source data are available for this figure: SourceData F4.
Figure 5.
Figure 5.
The expression of X chromosome inactivation-related genes is correlated with ISG score in pDCs of SSc women. (A) Left: UMAP plot displaying the RNA expression of XIST at the single-cell level in the five SCs of pDCs described in Fig. 2. Right: Violin plot comparing XIST expression between HDs (n = 4) and SSc patients (n = 4). Statistical significance was analyzed using the Wilcoxon rank-sum test and indicated as ****P < 0.0001. (B and C) Violin plots illustrating the comparison of (B) SPEN, CBX4, and (C) ING4 expression between HDs and SSc patients are shown. Statistical significance was analyzed using the Wilcoxon rank-sum test and indicated as ****P < 0.0001. (D) Violin plot comparing XIST expression between ISGlow and ISGhigh clusters. Statistical significance was analyzed using the Wilcoxon rank-sum test and indicated as ns when non-significant. (E) Left: Violin plot comparing SPEN expression between ISGlow and ISGhigh clusters. Right: Correlation analysis between SPEN expression and ISG score. Statistical significance was analyzed using the Wilcoxon rank-sum test and indicated as *P < 0.05. (F) Left: Violin plot comparing CBX4 expression between ISGlow and ISGhigh clusters. Right: Correlation analysis between CBX4 expression and ISG score. Statistical significance was analyzed using the Wilcoxon rank-sum test and indicated as ****P < 0.0001. The correlation between ISG score and the expression of the indicated gene was assessed in cells expressing the gene using Pearson correlation, and the corresponding P values were reported.

References

    1. Abbas, F., Cenac C., Youness A., Azar P., Delobel P., and Guery J.C.. 2022. HIV-1 infection enhances innate function and TLR7 expression in female plasmacytoid dendritic cells. Life Sci. Alliance. 5:e202201452. 10.26508/lsa.202201452 - DOI - PMC - PubMed
    1. Ah Kioon, M.D., Laurent P., Chaudhary V., Du Y., Crow M.K., and Barrat F.J.. 2024. Modulation of plasmacytoid dendritic cells response in inflammation and autoimmunity. Immunol. Rev. 323:241–256. 10.1111/imr.13331 - DOI - PubMed
    1. Ah Kioon, M.D., Tripodo C., Fernandez D., Kirou K.A., Spiera R.F., Crow M.K., Gordon J.K., and Barrat F.J.. 2018. Plasmacytoid dendritic cells promote systemic sclerosis with a key role for TLR8. Sci. Transl. Med. 10:eaam8458. 10.1126/scitranslmed.aam8458 - DOI - PMC - PubMed
    1. Al-Azab, M., Idiiatullina E., Liu Z., Lin M., Hrovat-Schaale K., Xian H., Zhu J., Yang M., Lu B., Zhao Z., et al. 2024. Genetic variants in UNC93B1 predispose to childhood-onset systemic lupus erythematosus. Nat. Immunol. 25:969–980. 10.1038/s41590-024-01846-5 - DOI - PMC - PubMed
    1. Alculumbre, S.G., Saint-André V., Di Domizio J., Vargas P., Sirven P., Bost P., Maurin M., Maiuri P., Wery M., Roman M.S., et al. 2018. Diversification of human plasmacytoid predendritic cells in response to a single stimulus. Nat. Immunol. 19:63–75. 10.1038/s41590-017-0012-z - DOI - PubMed

MeSH terms