. 2024 Dec 17;121(51):e2318871121.
doi: 10.1073/pnas.2318871121. Epub 2024 Dec 13.

pERK transition-induced directional mode switching promotes epithelial tumor cell migration

Affiliations

pERK transition-induced directional mode switching promotes epithelial tumor cell migration

Huijing Yu et al. Proc Natl Acad Sci U S A. .

Abstract

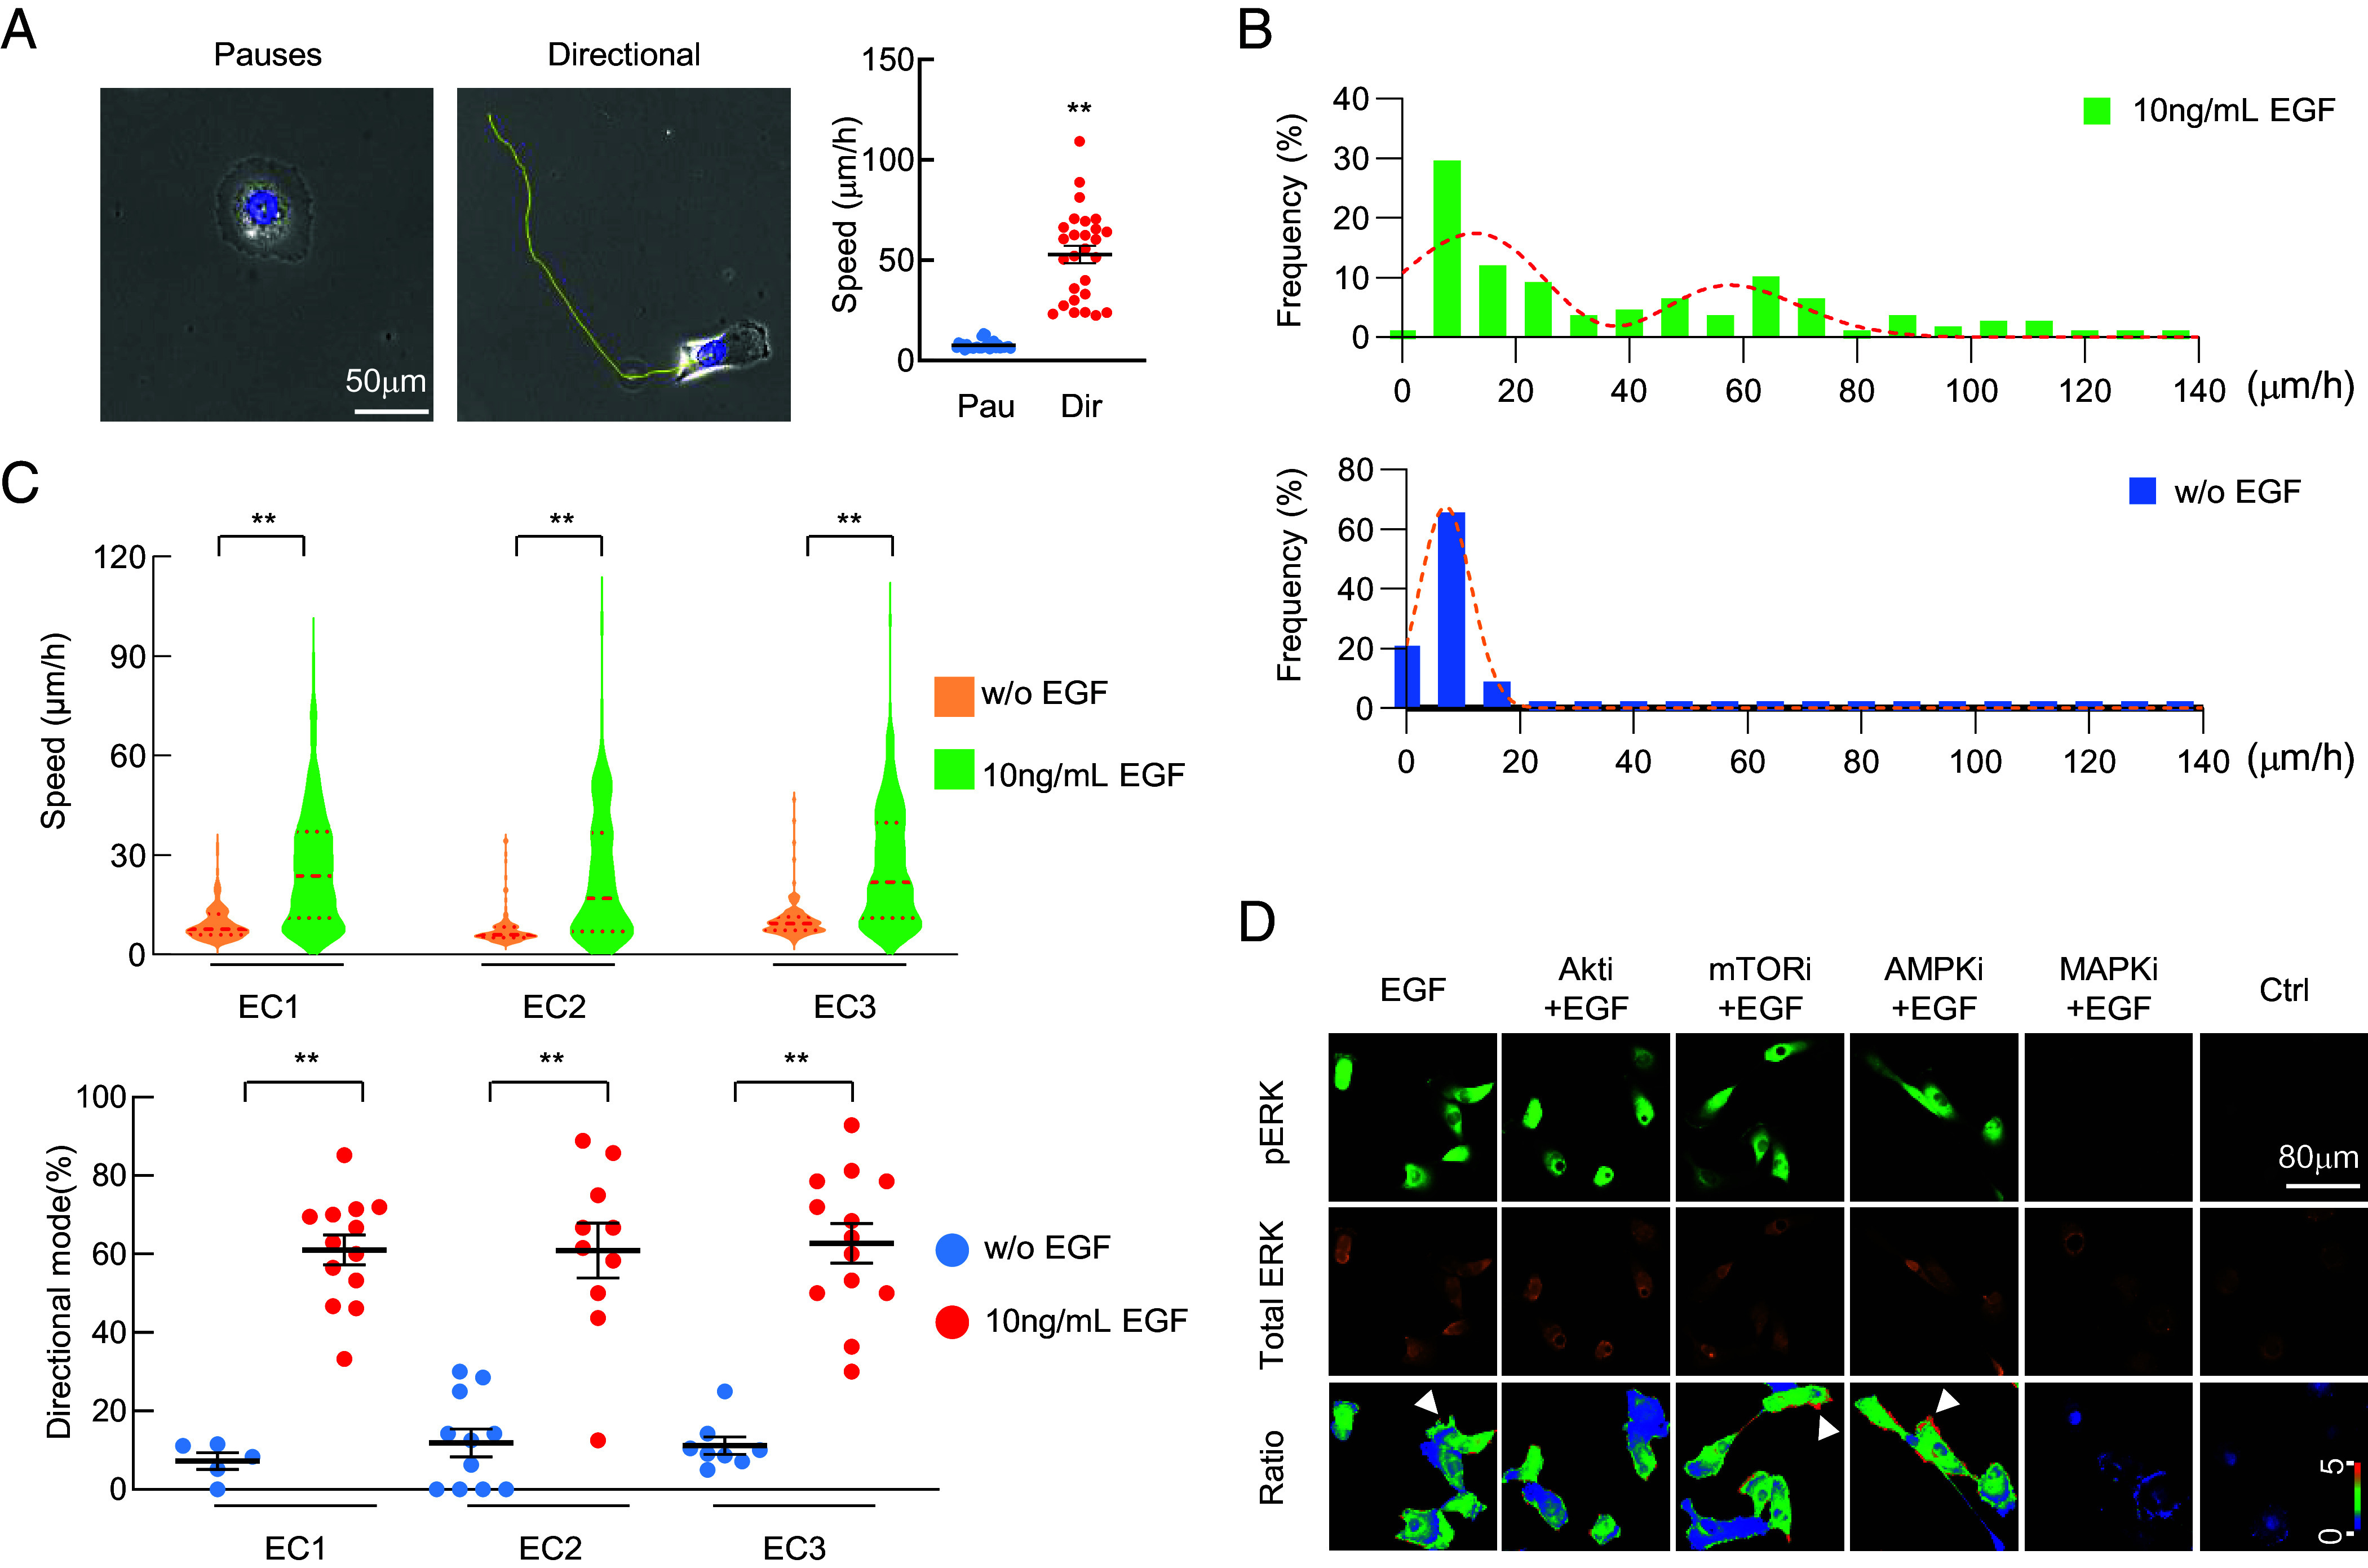
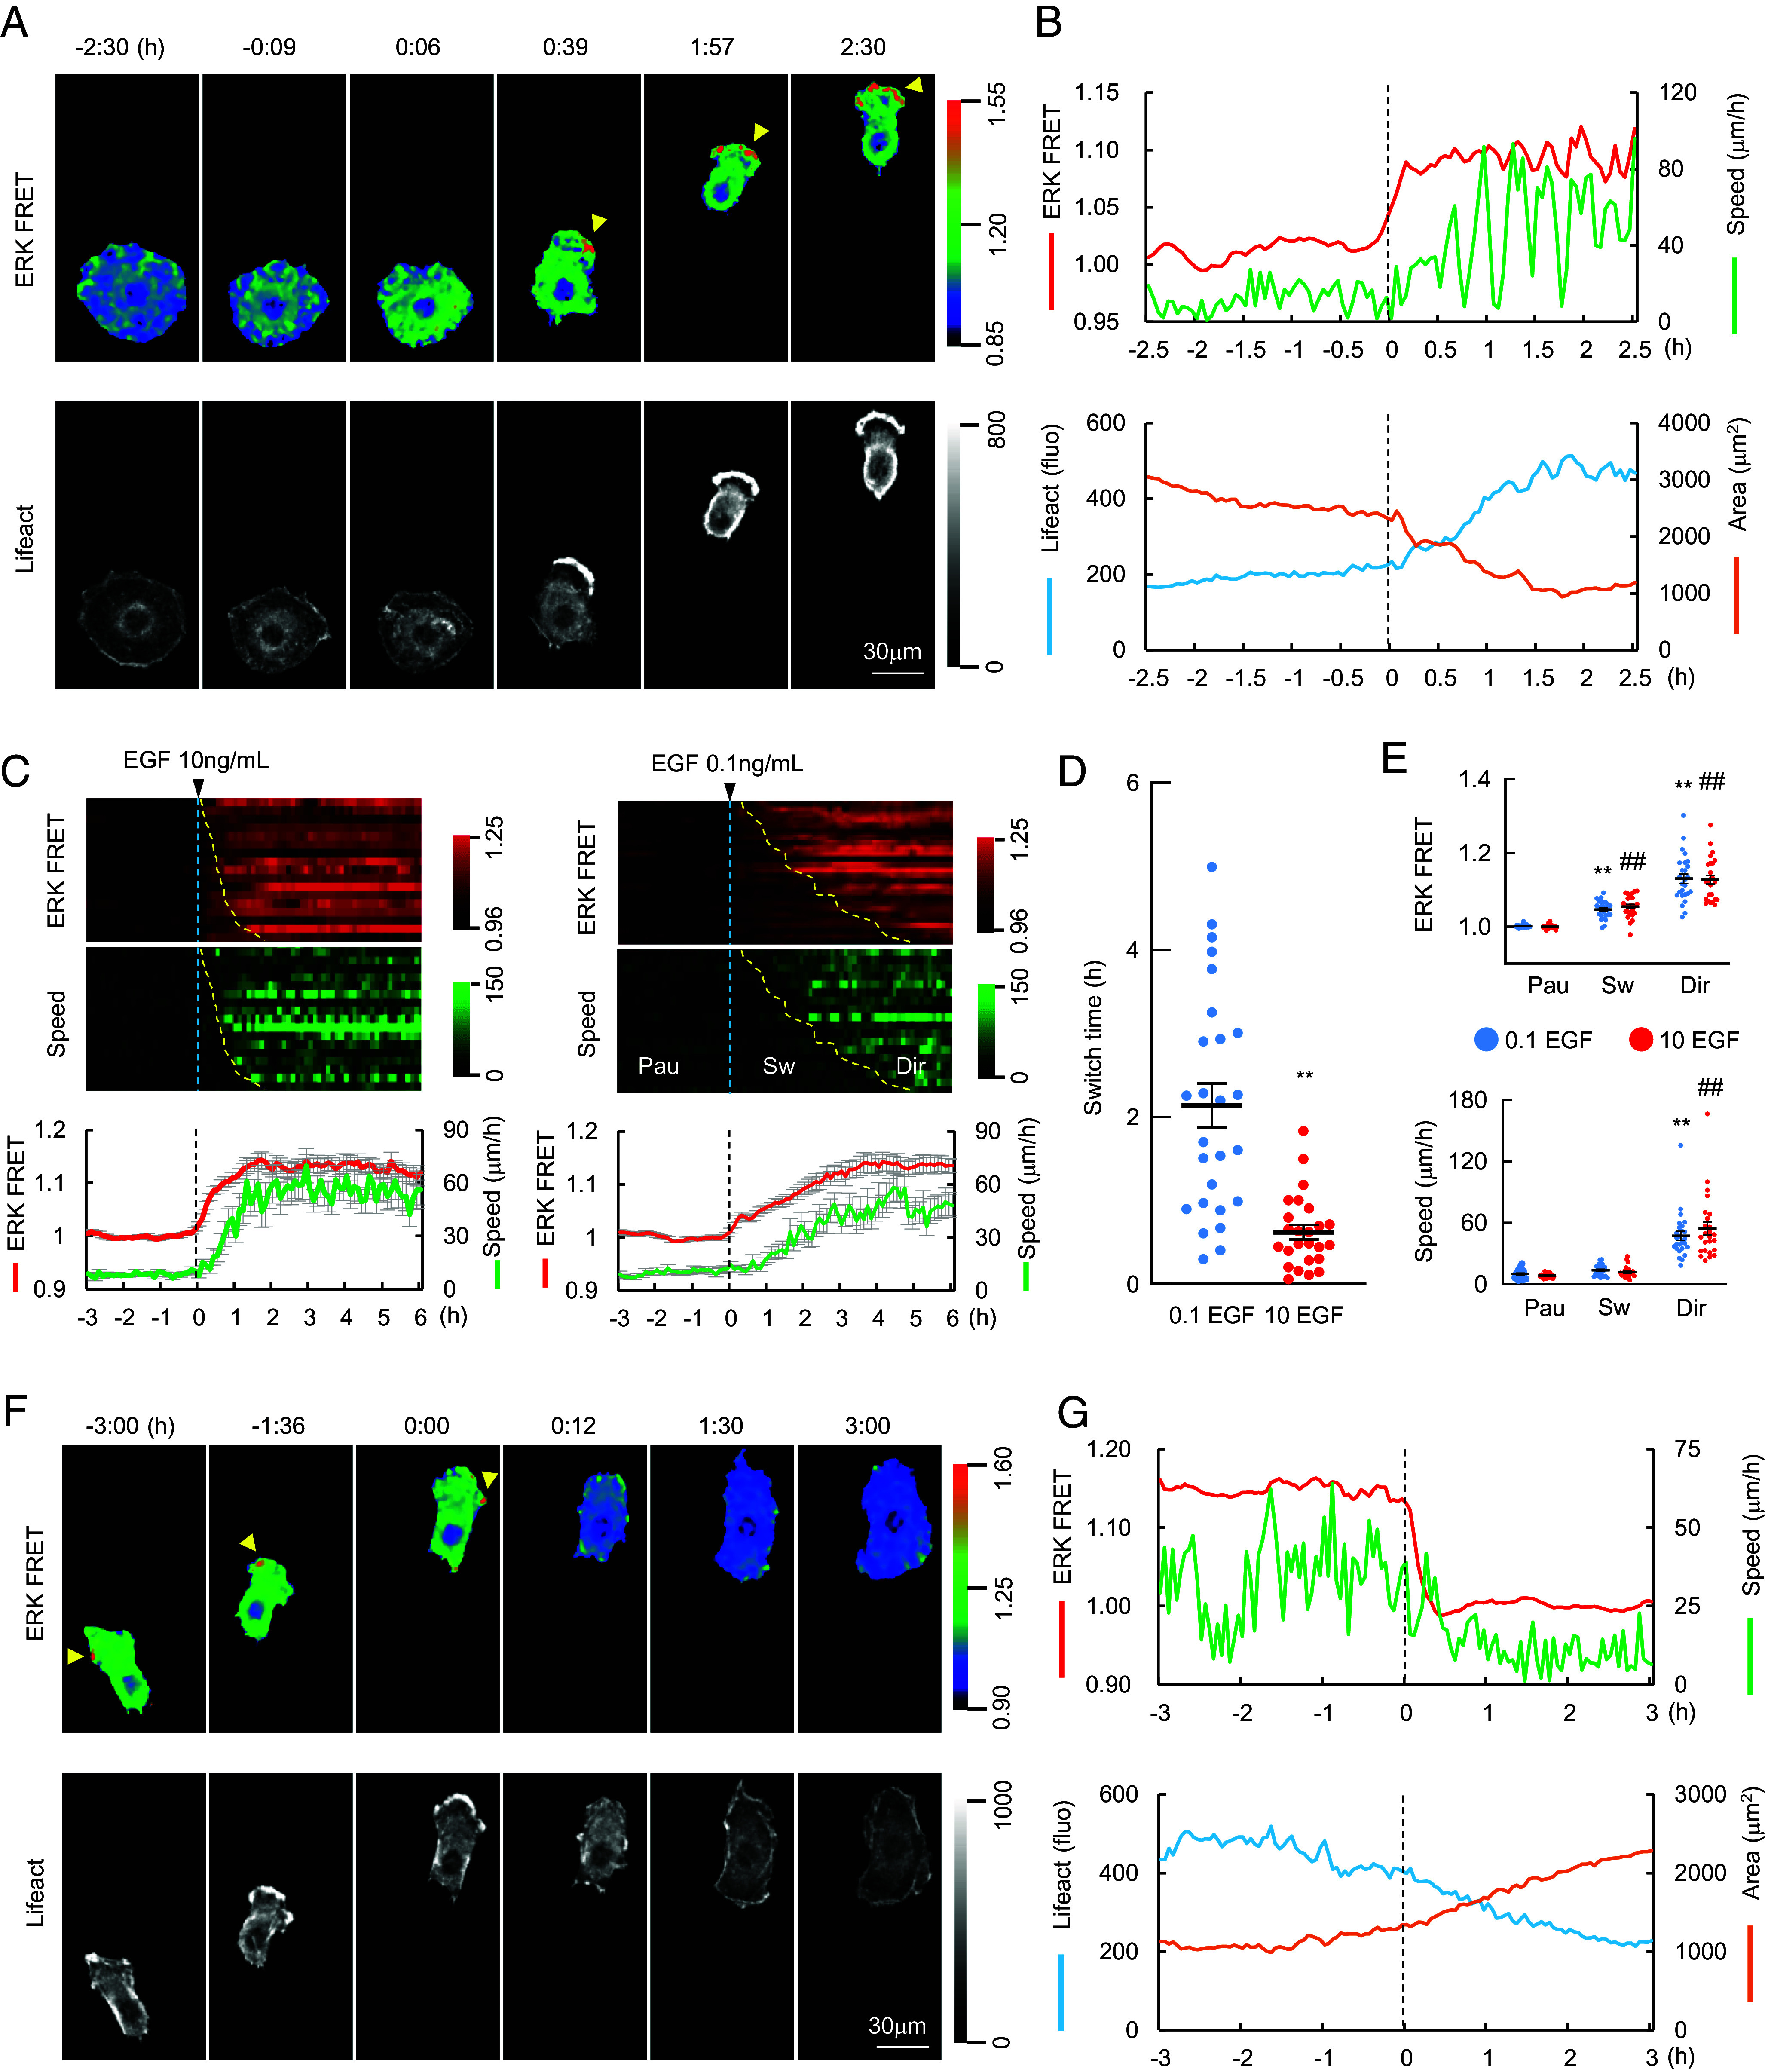
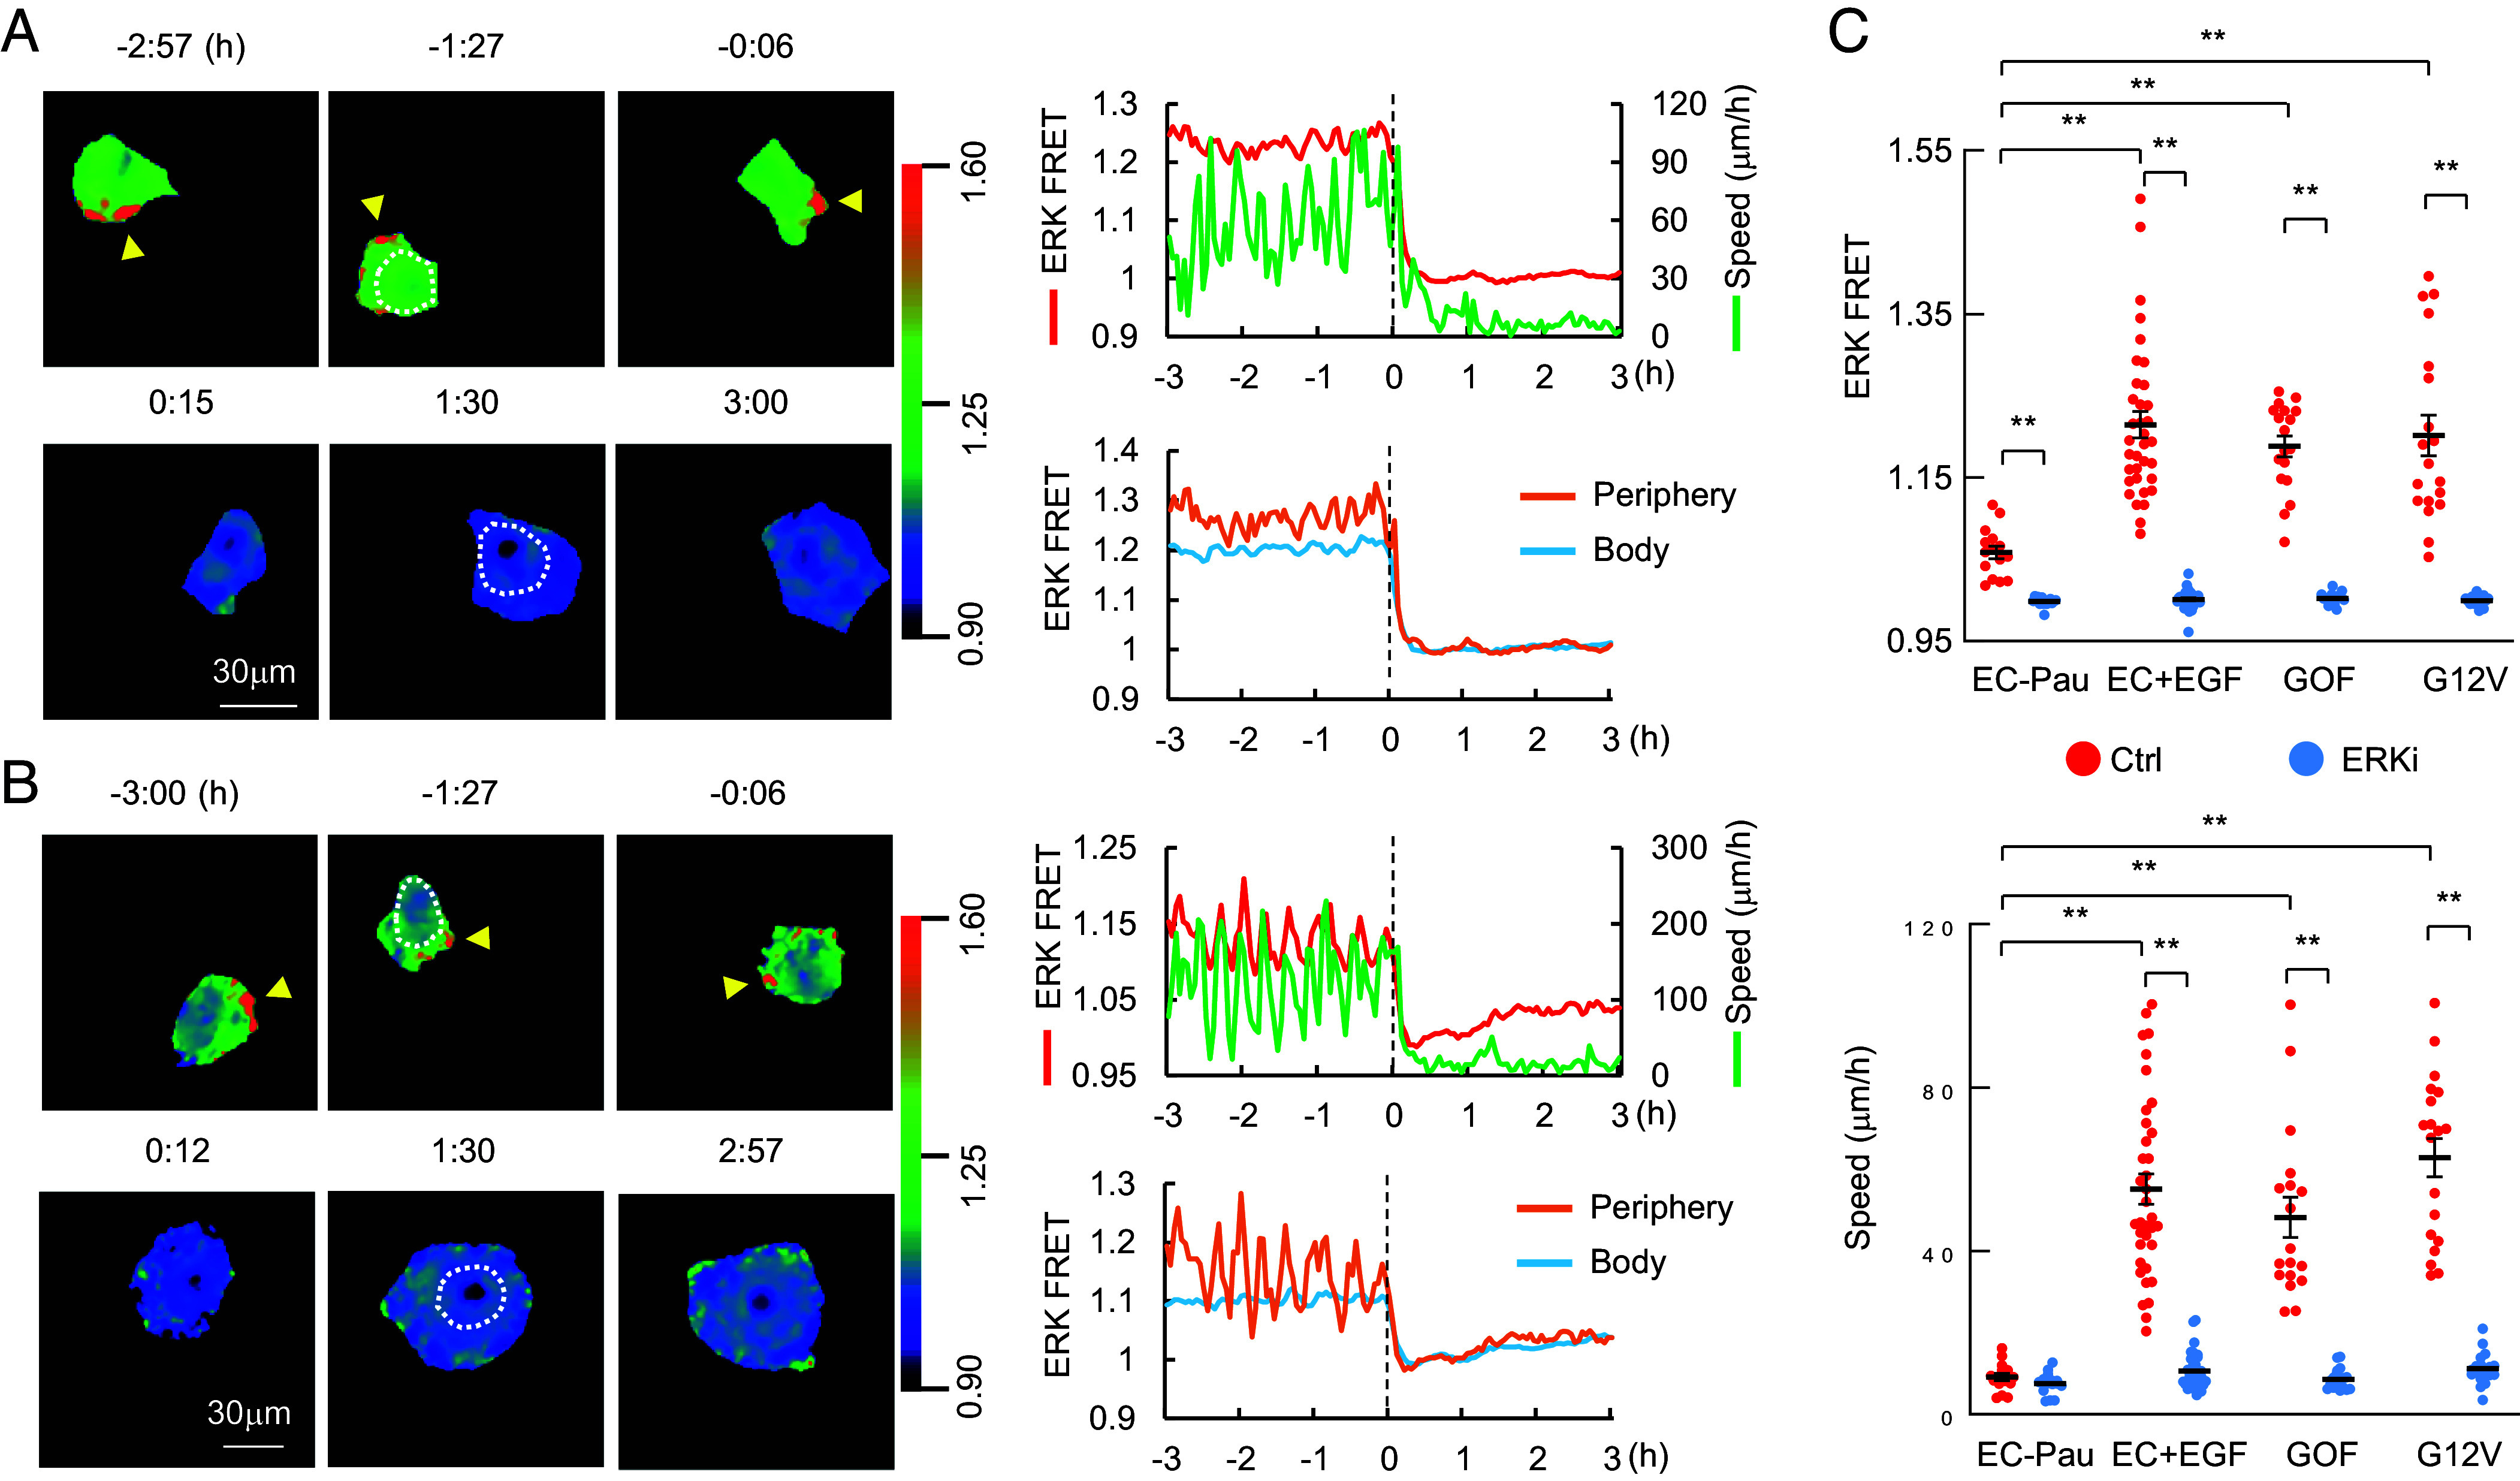
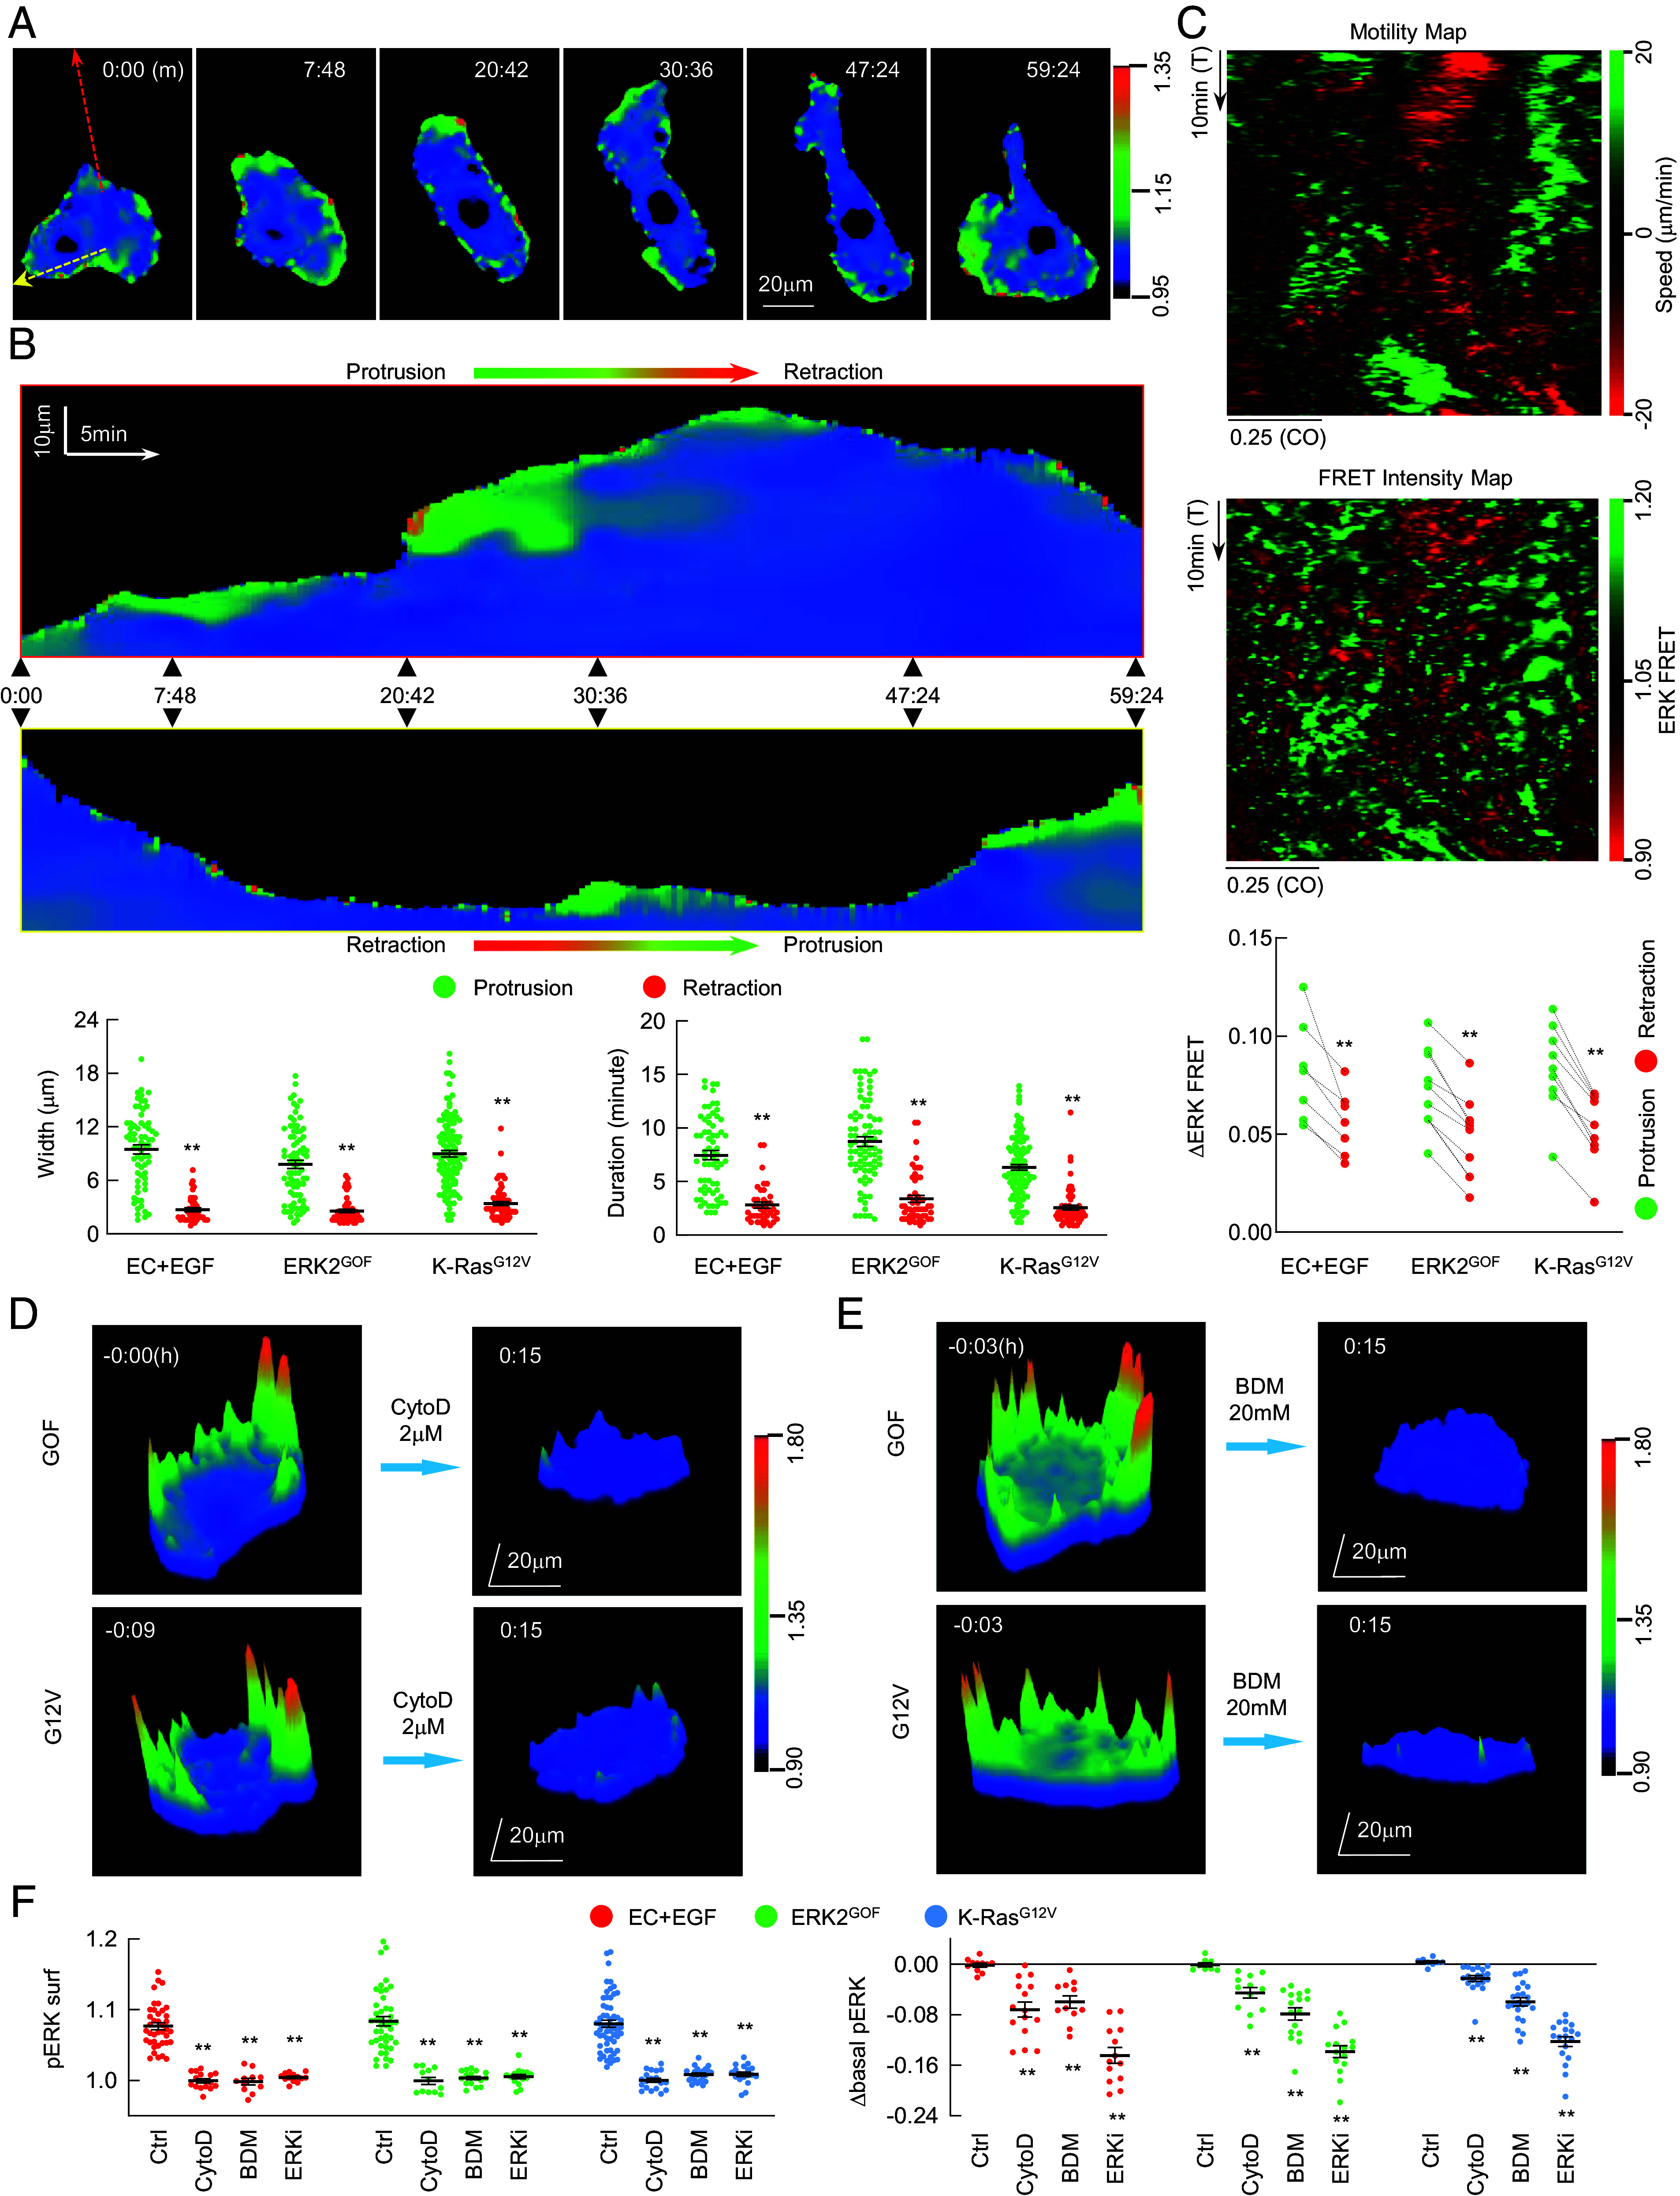
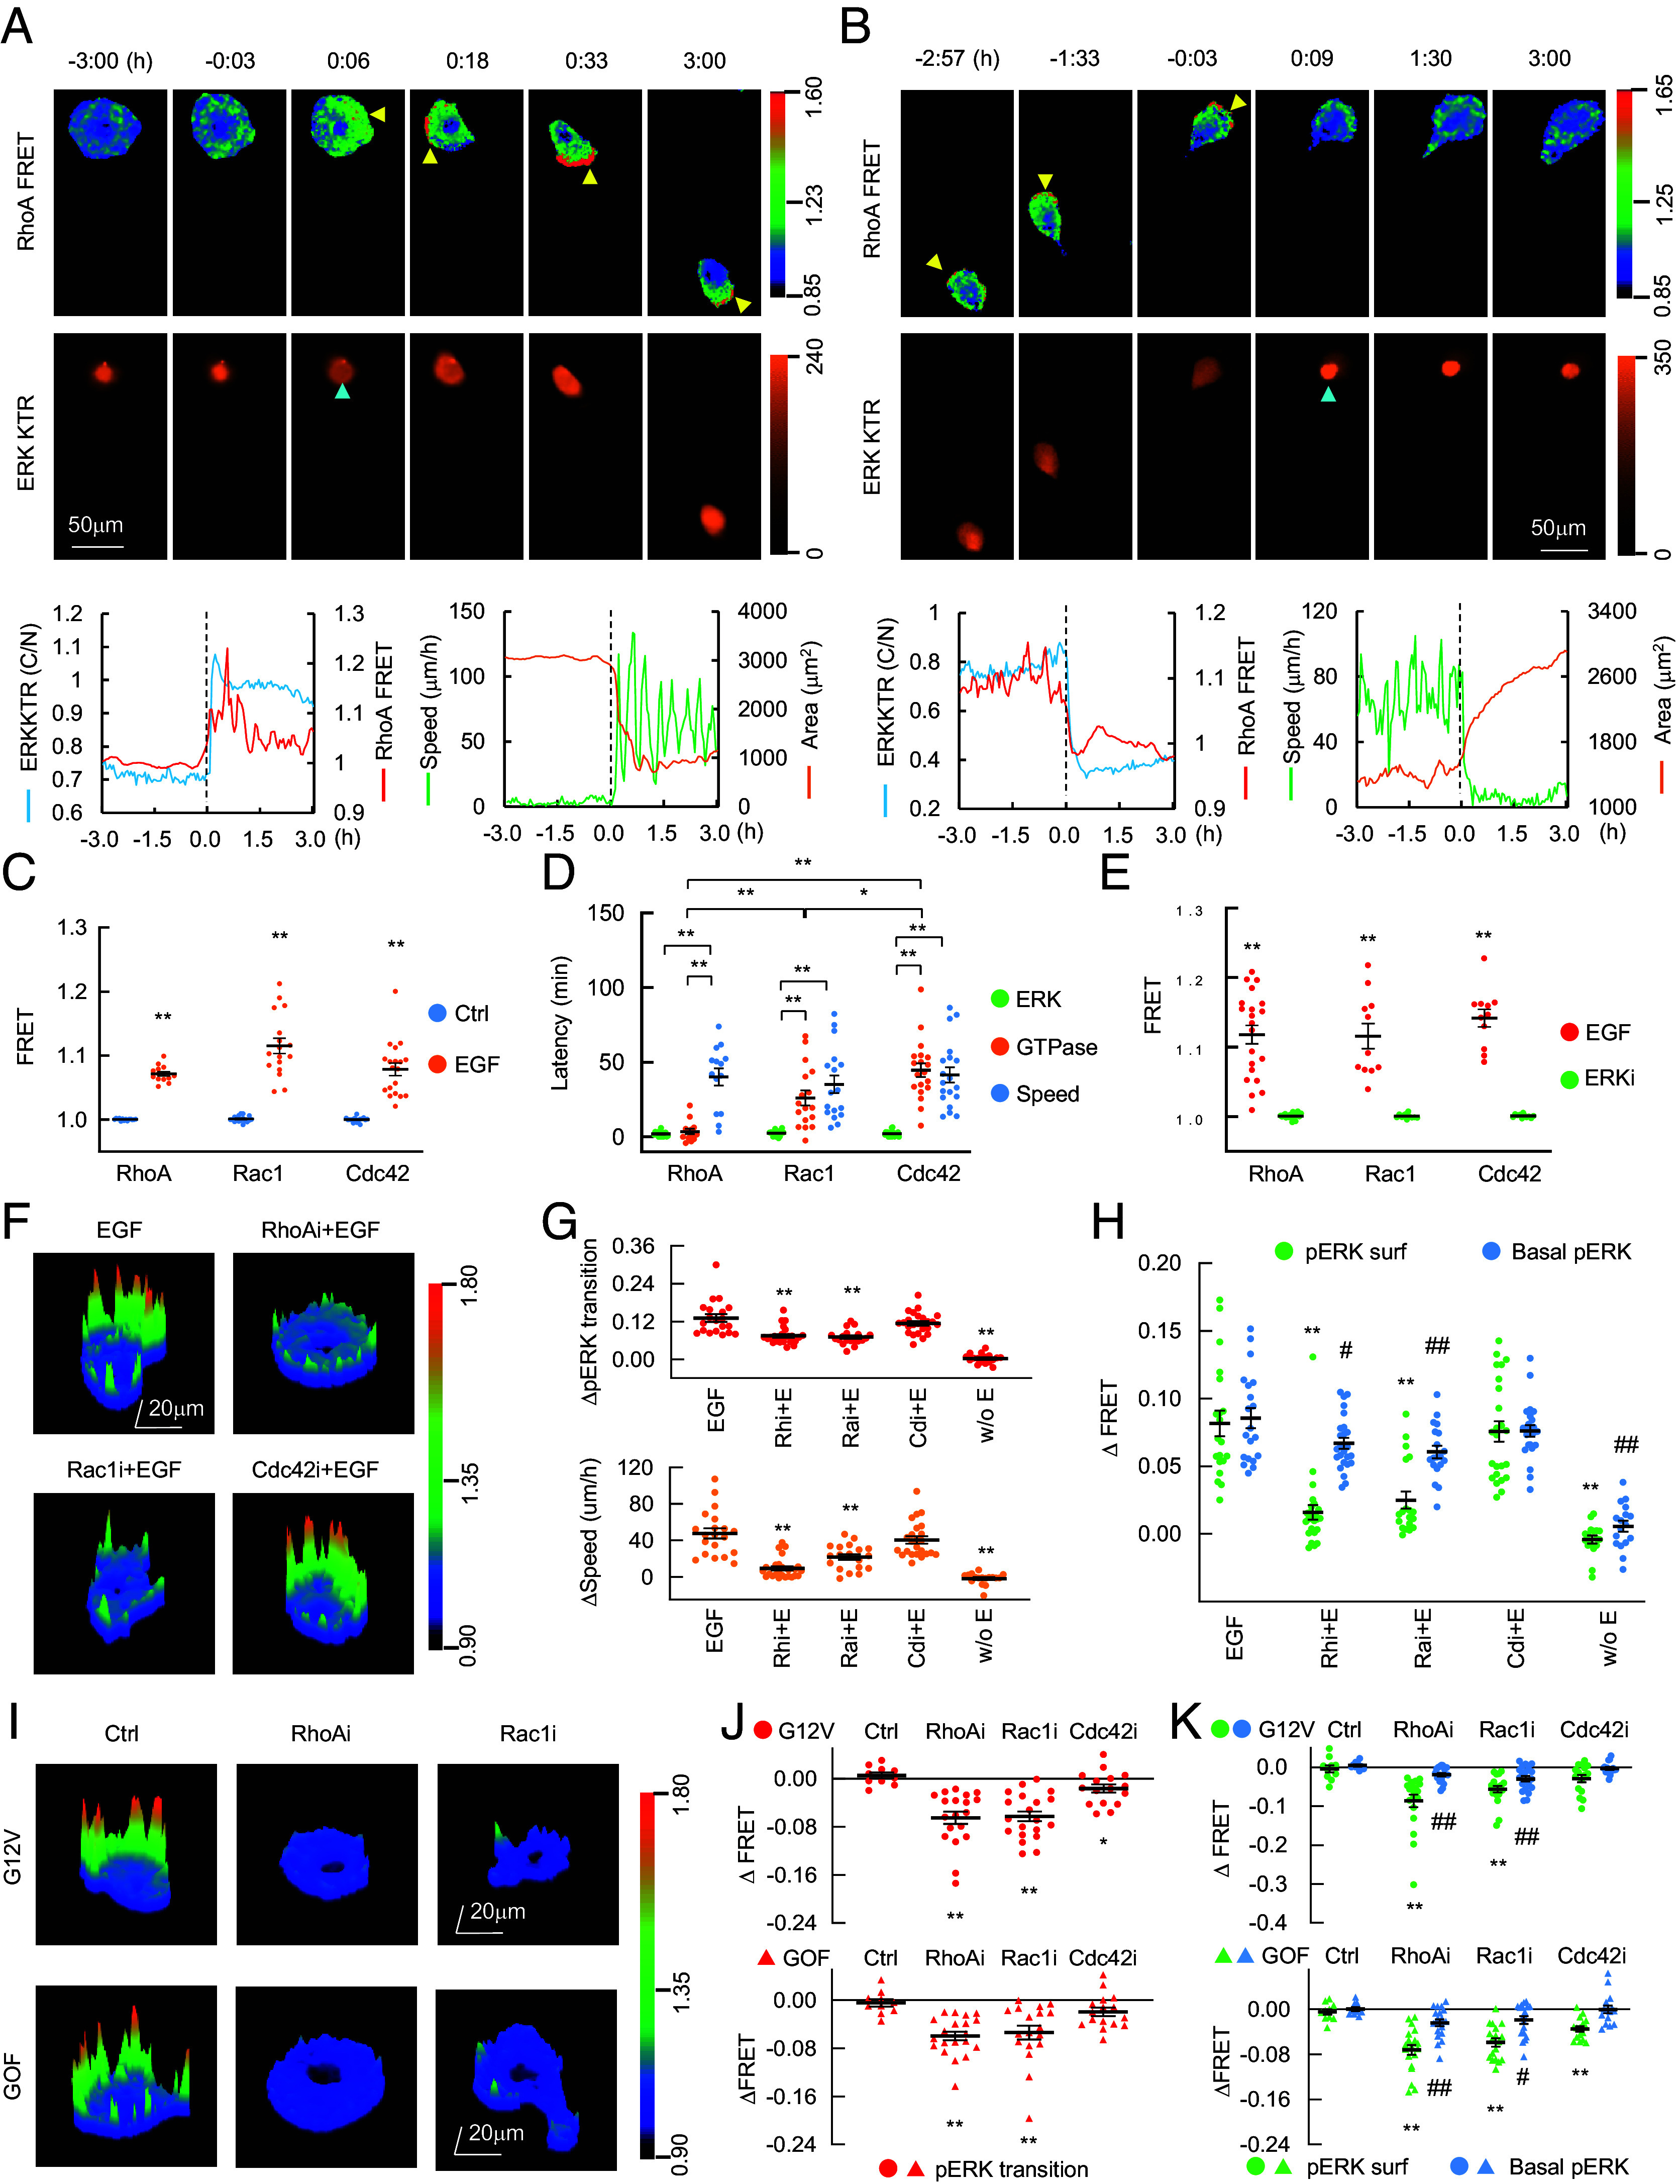
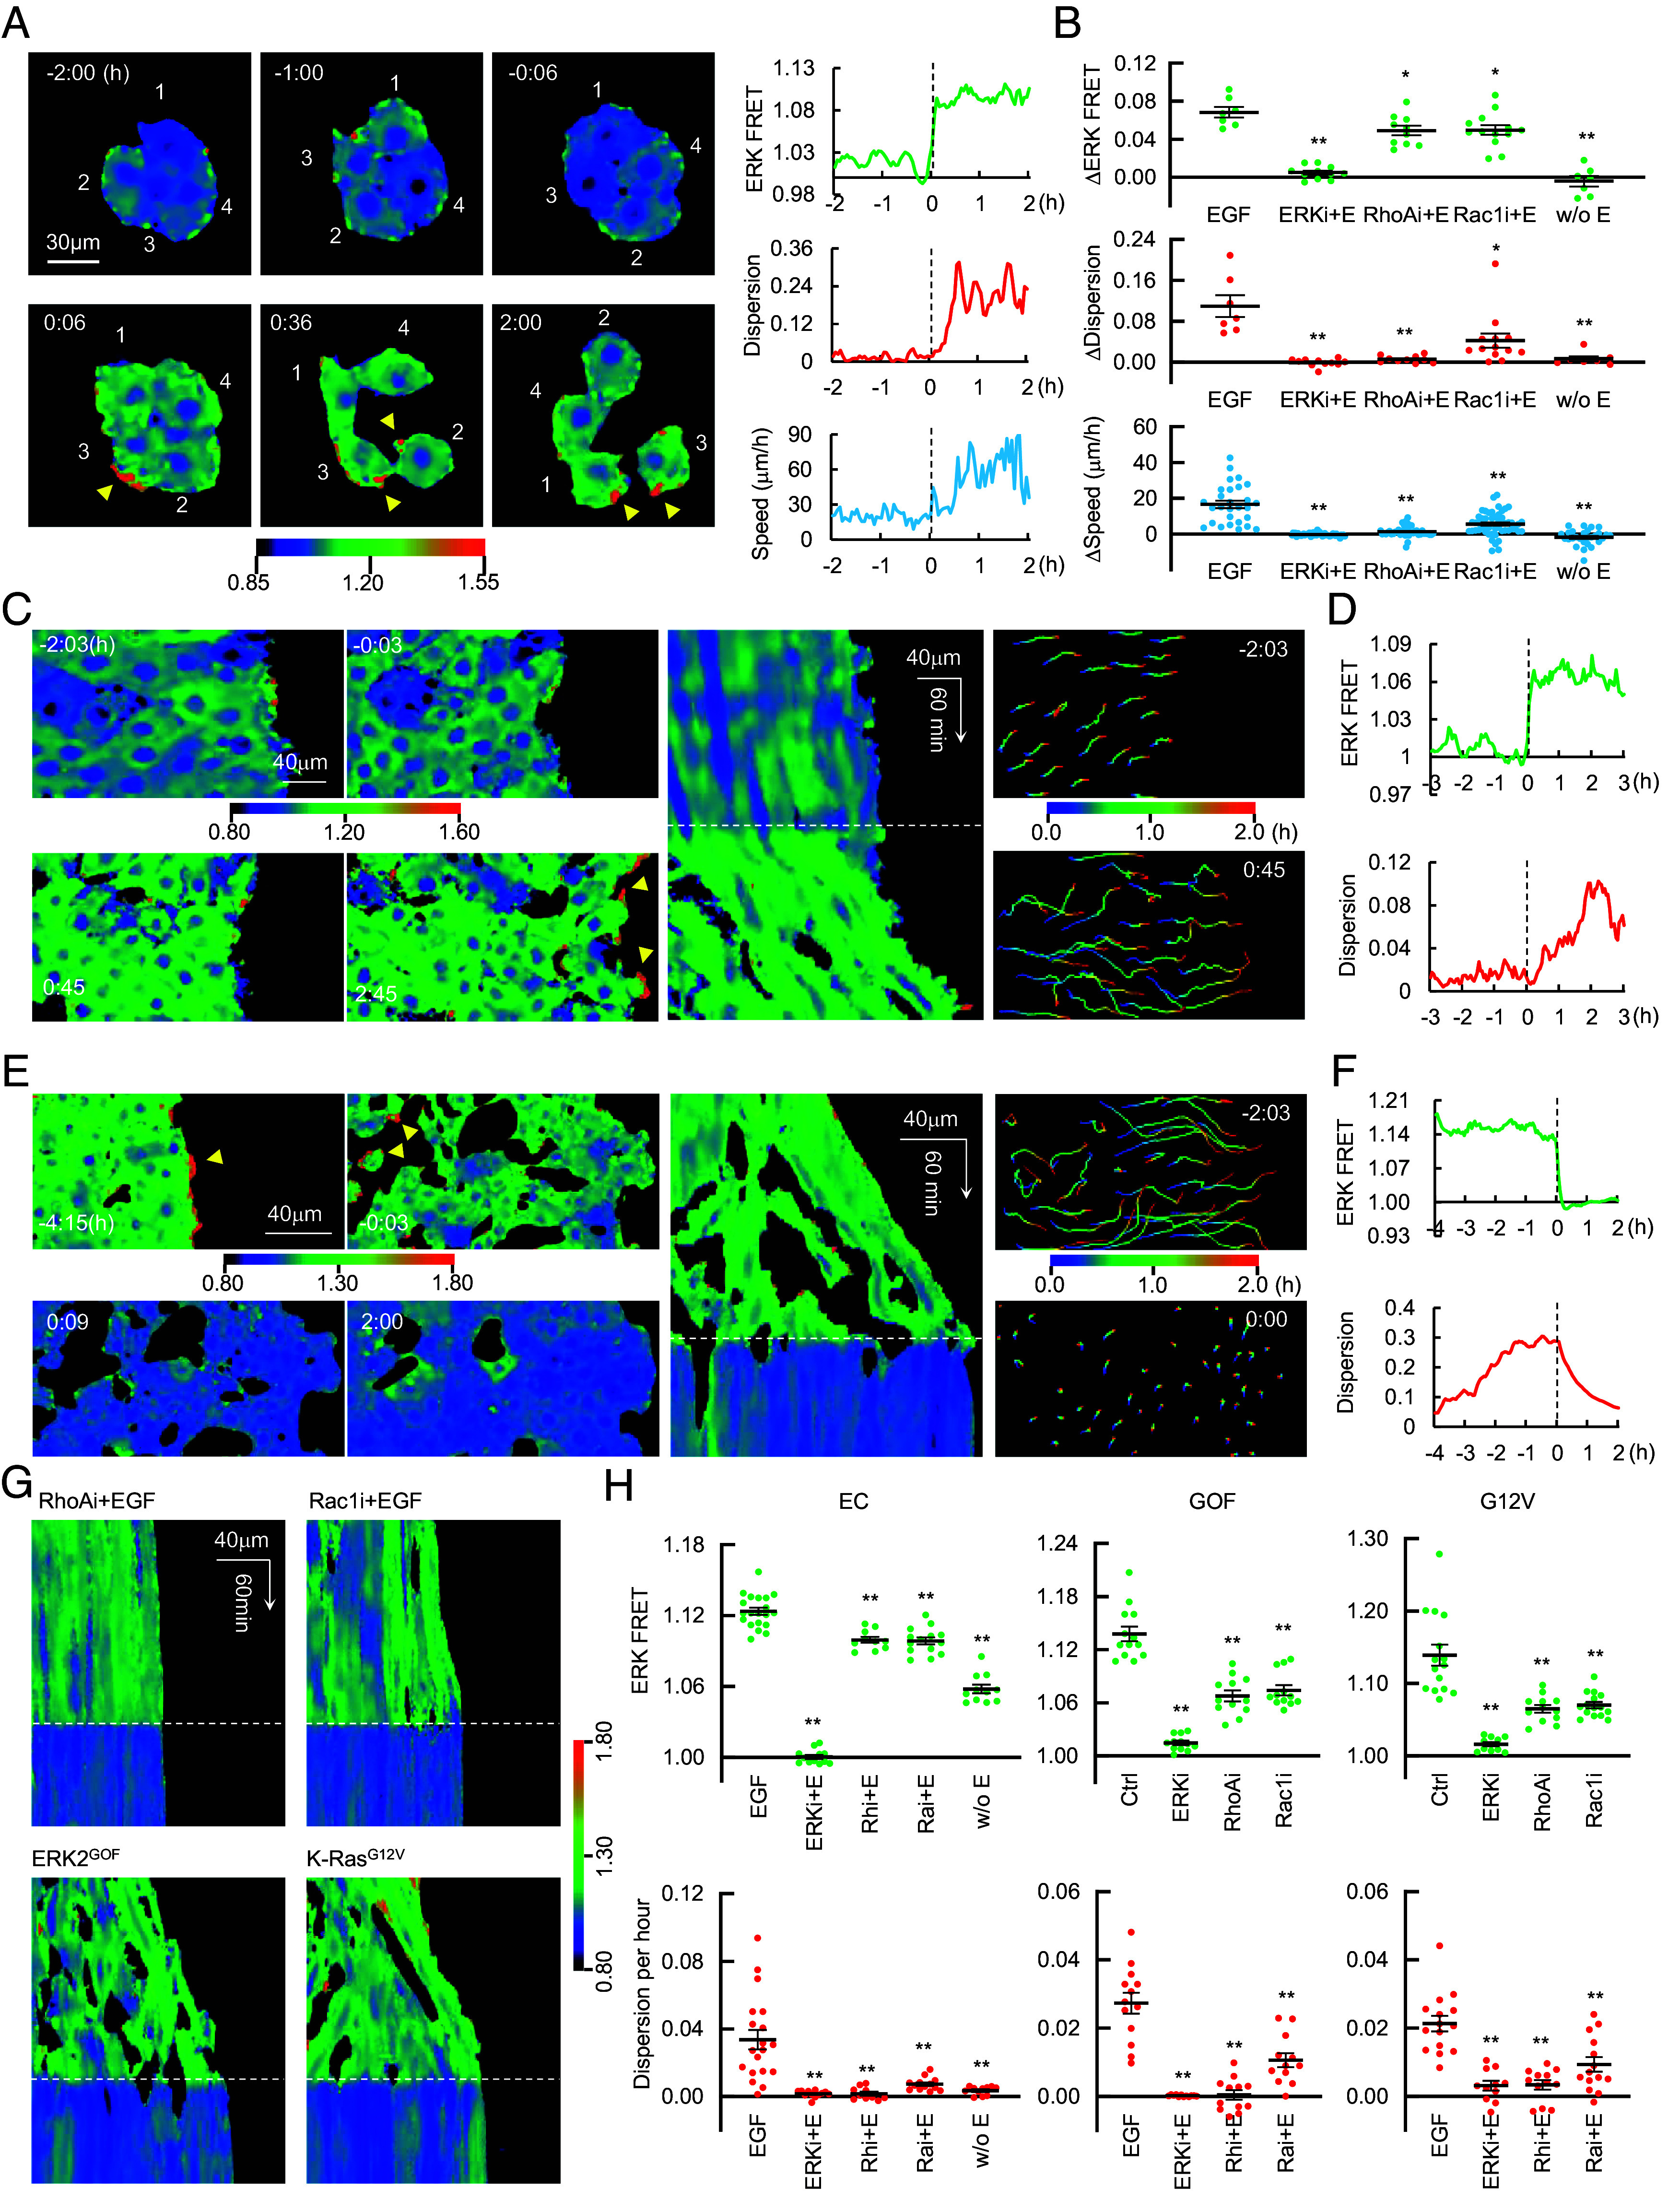
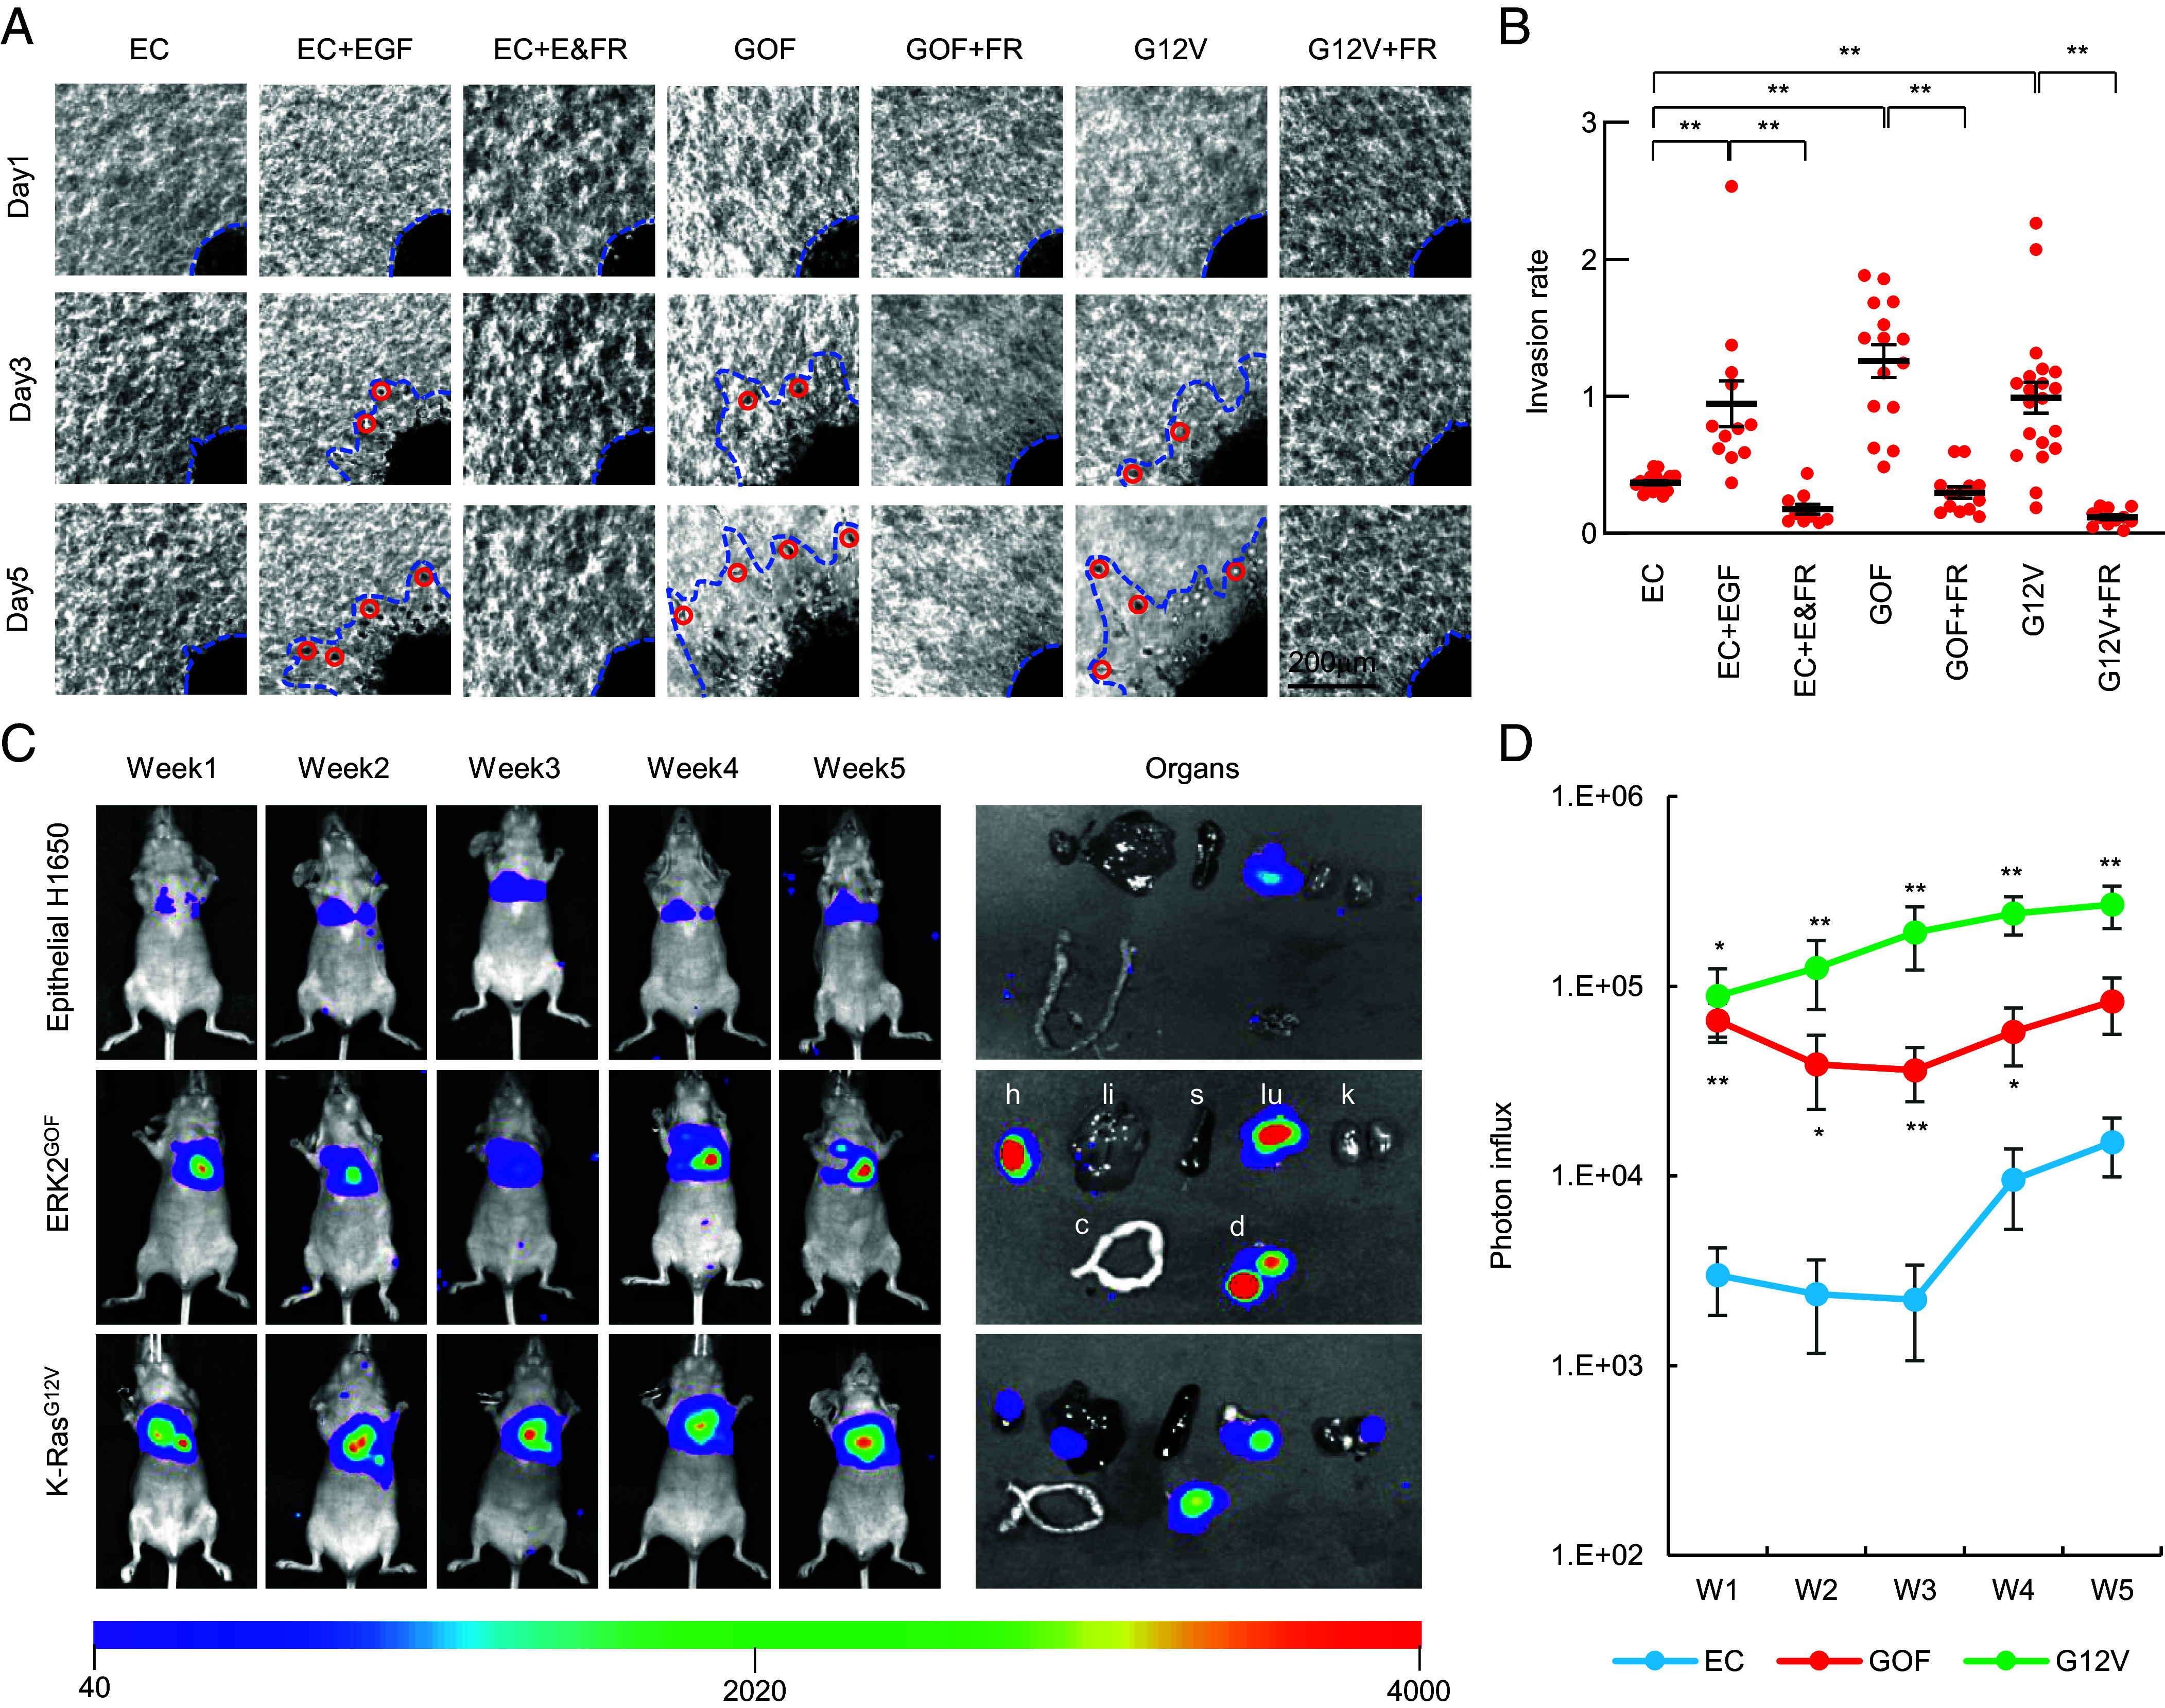
Increasing evidence suggests that tumor cells exhibit extreme plasticity in migration modes in order to adapt to microenvironments. However, the underlying mechanism for governing the migration mode switching is still unclear. Here, we revealed that epithelial tumor cells could develop a stable directional mode driven by hyperactivated ERK activity. This highly activated and dynamically changing ERK activity, called pERK transition, is crucial for inducing the switch from pauses state to directional movement and is also necessary for maintaining epithelial tumor cells in the directional mode. PERK transition integrated pERK surf, the dynamic and localized ERK activity at the leading edge. The sequential activation of RhoA and Rac1 by pERK transition played critical roles in generation of pERK surf activity through a movement feedback mechanism. PERK transition activity converted the orderly collective migration into the disordered dispersal movement, enhanced the invasiveness of epithelial tumor cells, and promoted their metastasis in immune-deficient mice. These findings revealed that the exquisite spatiotemporal organization of ERK activity orchestrates migration and invasion of tumor cells and provide evidence for the mechanism underlying migration mode switching in epithelial tumor cells.

Keywords: migration mode switching; migration plasticity; pERK surf; pERK transition; rampage mode.


Conflict of interest statement

Competing interests statement:The authors declare no competing interest.

Figures

Fig. 1.
Fig. 1.
MAPK signal pathway–dependent directional mode in epithelial tumor cells. (A) Two motility modes in single H1650 cells stimulated overnight with EGF (10 ng/mL). Blue regions indicate the nuclei. Yellow lines indicate the migration path in 4 h. The right panel shows statistics of movement speed. Pau: pauses cells; Dir: directional cells. N = 27~30. Data were shown as scatter plots with mean ± SEM.**, P < 0.01. (B) Frequency distribution of movement speed with or without EGF stimulation. The red curve was fitted by the sum of two Gaussian (Upper). The orange curve showed Gaussian fitting (Lower). W/o EGF: without EGF treatment. N = 67~108. (C) Property analysis of directional mode cells in different epithelial H1650 monoclonal cell lines (EC1~EC3). Average speeds in 4 h were analyzed from 90 to 286 cells for the violin plot (Upper). Percentages of directional mode cells were analyzed from 5 to 13 imaging areas and shown as mean ± SEM (Lower). **, P < 0.01. (D) ERK activity in directional mode cells under inhibition of different signaling pathways. Double staining of pERK and total ERK was performed within the same cells. Ratio images in rainbow color present the immunostaining intensity ratio of pERK to total ERK. Hot spots of ERK activity are indicated by white arrows.
Fig. 2.
Fig. 2.
ERK activity patterns in directional epithelial tumor cells. (A) EGF driven quickly switching to directional mode from pauses state in an epithelial H1650 cell. ERK activity is presented by normalized ratio image monitored by the EKAR2G2 probe (Upper). Hot spots of ERK activity are indicated by yellow arrows. F-actin dynamics were monitored by LifeAct probe (Lower). 0:00 (h) denotes the EGF (10 ng/mL) adding point. (B) Time curves of ERK FRET intensity and movement speed (Upper); time curves of LifeAct fluorescence and cell area (Lower). Data are from panel (A). Black dashed lines indicate EGF addition. (C) ERK activity and speed dynamic in migration mode switching induced by different doses of EGF. Heatmaps of ERK activity (Upper) and speed dynamic (Middle) are sorted by latency of acceleration. Corresponding average traces of ERK FRET intensity and speed dynamics were calculated (Lower). Blue lines denote EGF addition. Yellow lines denote the latency of acceleration. Error bands denote the SEM of data at each time point. Pau: pauses period; Sw: switch period; Dir: directional period. N = 25~26. (D) Analysis of switch time calculated by acceleration latency. Data are analyzed from the same cells in panel (C) and shown as mean ± SEM. 0.1EGF: 0.1 ng/mL EGF; 10EGF: 10 ng/mL EGF. **, P < 0.01. (E) Analysis of ERK activity and movement speed in different periods. Data are analyzed from the same cells in panel (C) and shown as mean ± SEM. **, P < 0.01 versus 0.1 ng/mL EGF in pauses period; ##, P < 0.01 versus 10 ng/mL EGF in pauses period. (F) Rapid returning to pauses mode after ERKi (20 μM FR) application in a directional epithelial H1650 cell. Yellow arrows indicate hot spots of ERK activity. 0:00 (h) denotes FR addition. (G) Time curves of ERK FRET intensity and movement speed (Upper); time curves of LifeAct fluorescence and cell area (Lower). Data are from panel (F). Black dashed lines indicate FR addition.
Fig. 3.
Fig. 3.
Maintenance of directional mode in constitutive ERK-activated epithelial tumor cells. (A and B) Quickly reverting to pauses mode after ERKi (20 μM FR) application in directional ERK2GOF (A) or K-RasG12V (B) H1650 cell. The EKAR2G2 FRET images showed ERK activity (Left panel). Yellow arrows indicate hot spots of ERK activity. White dash circles distinguish the cell periphery from the body region. 0:00 (h) denotes FR addition. Time traces of ERK activity and movement speed are integrated (Upper Right). ERK activities in the periphery or body region are shown separately (Lower Right). Black dashed lines indicate FR addition. (C) Analysis of ERK activity and movement speed in constitutive ERK-activated cell lines. EC-Pau: pauses state of epithelial H1650 cells without EGF treatment. EC+EGF: EGF stimulated directional mode epithelial H1650 cells. N = 15~25. Data were shown as mean ± SEM. **, P < 0.01.
Fig. 4.
Fig. 4.
Characteristics of pERK surfs in directional epithelial tumor cells. (A) Dynamic pERK surf activity monitored by the EKAR2G2 FRET probe in a directional K-RasG12V H1650 cell. M: minute. (B) Polarization of pERK surf activity in protrusion and retraction of the directional mode cell. The kymographs were created at the location of dash lines in panel (A) (Upper). PERK surf characteristics were shown lower. A total of 40 ~ 121 surf events in 9 ~ 17 kymographs from 5 to 12 cells in different groups were analyzed. Data are shown as mean ± SEM. **, P < 0.01 versus the corresponding protrusion group. (C) Cell motility and corresponding ERK activity in protrusion or retraction. The images were generated from the same cell in panel (A) (Upper and Middle). The lower panel shows ERK FRET fluorescence in corresponding protrusion or retraction of directional mode. CO: cell outline. Paired data from 7 to 10 cells in different groups were analyzed and shown as mean ± SEM. **, P < 0.01 versus the corresponding protrusion group. (D and E) Suppression of pERK surf activity after inhibition of cell motility. FRET images are rendered as surface plots. CytoD: cytochalasin D; BDM: 2,3-butanedione monoxime. 0:00 (h) denotes inhibitor addition. (F) Analysis of pERK surf and basal pERK activity after inhibition of cell motility or ERK phosphorylation. Controls were analyzed before inhibition. N = 8 ~ 22. Data are shown as mean ± SEM. **, P < 0.01 versus the corresponding Ctrl group.
Fig. 5.
Fig. 5.
Interplay of Rho GTPases with pERK transition in directional mode. (A) Rapid increase of RhoA activity in EGF-induced directional mode switching. RhoA activity is presented by normalized ratio images using the RhoA2G FRET probe (Upper). The stronger RhoA activities at the leading edge are indicated by yellow arrows. ERK activity is monitored by ERKKTR probes (Middle). The blue arrow indicates that ERKKTR probes were exported out of the nucleus shortly after EGF (10 ng/mL) application. 0:00 (h) denotes EGF addition. Time curves show the ERK and RhoA activity (Lower Left), speed and area (Lower Right) from the upper cell. Black dashed lines indicate EGF addition. ERKKTR (C/N): ERK activity calculated by ERKKTR fluorescence intensity ratio of cytosol to nuclear. (B) Immediately decrease of RhoA activity after returning to the pauses mode by ERKi application. The blue arrow indicates that ERKKTR probes were imported into the nucleus shortly after ERKi (FR, 20 μM) application. 0:00 (h) and black dashed lines denote ERKi addition. (C) Rho GTPases activities in EGF-induced directional epithelial H1650 cells. N = 14 ~ 19 in each group. Data were shown as mean ± SEM. **, P < 0.01 versus the corresponding Ctrl group. (D) Lag time analysis of ERK and Rho GTPases activities during directional mode switching. Latency was calculated by half maximal peak of the corresponding trace. Data are analyzed from the same cells in panel (C) and shown as mean ± SEM. *, P < 0.05; **, P < 0.01. (E) Analysis of Rho GTPases activity after ERKi application in directional mode cells. N = 11 ~ 21. Data are shown as mean ± SEM. **, P < 0.01 versus the corresponding FR group. (F) Effects of Rho GTPases inhibitors on pERK transition activity in EGF-induced directional cells. Cells were preincubated with different Rho GTPase inhibitors prior to EGF addition. ERK FRET images are rendered as surface plots. RhoAi: Rhosin 50 μM; Rac1i: EHT1864 20 μM; Cdc42i: ZCL278 200 μM. (G) Changes of pERK transition activity and movement speed upon inhibition of Rho GTPases. Rhi+E: RhoA inhibition (Rhosin) plus EGF stimulation; Rai+E: Rac1 inhibition (EHT1864) plus EGF stimulation; Cdi+E: Cdc42 inhibition (ZCL278) plus EGF stimulation; w/o E: without EGF stimulation. N = 17 ~ 25. Data are shown as mean ± SEM. **, P < 0.01 versus the EGF group. (H) Changes of pERK surf activity and basal pERK upon inhibition of Rho GTPases. Data are analyzed from the same cells in panel (G) and shown as mean ± SEM. **, P < 0.01 versus pERK surf in the EGF group. #, P < 0.05; ##, P < 0.01 versus basal pERK in the EGF group. (I) Effect of Rho GTPases inhibition on pERK transition activity in ERK2GOF and K-RasG12V cells. (J) Changes of pERK transition activity after inhibition of Rho GTPases in ERK2GOF and K-RasG12V cells. N = 10 ~ 20. Data are shown as mean ± SEM. *, P < 0.05; **, P < 0.01 versus the Ctrl group. (K) Changes of pERK surf activity and basal pERK after inhibition of Rho GTPases in ERK2GOF and K-RasG12V cells. Data are analyzed from the same cells in panel (J) and shown as mean ± SEM. **, P < 0.01 versus pERK surf in the Ctrl group. #, P < 0.05; ##, P < 0.01 versus basal pERK in the Ctrl group.
Fig. 6.
Fig. 6.
Dispersal movement induced by pERK transition in cluster or monolayer epithelial tumor cells. (A) PERK transition–induced quick dispersion of the epithelial cell cluster into directional free cells. ERK activity is monitored by the EKAR2G2 FRET probe (Left). Different cells are labeled with numbers. PERK surfs are indicated by yellow arrows. 0:00 (h) denotes 10 ng/mL EGF addition. Time traces of ERK activity, cluster dispersion, and movement speed are on right panels. Speed trace is average from individual cell nucleus detected by H2B probe. Black dashed lines indicate EGF addition. (B) Changes of ERK activity, dispersion, and movement speed in epithelial cell clusters treated with different inhibitors. Cell clusters were preincubated with different inhibitors prior to EGF addition. ERKi+E: ERK inhibition (FR) plus EGF stimulation. 7 ~ 13 clusters are for ERK FRET and dispersion analysis. 28 ~ 51 cells from corresponding clusters are for speed analysis. Data are shown as mean ± SEM. *, P < 0.05; **, P < 0.01 versus the corresponding EGF group. (C) PERK transition converted collective migration into dispersal migration. ERK activity is monitored by the EKAR2G2 FRET probe (Left). 0:00 (h) denotes 10 ng/mL EGF addition. ERK activity is presented in the kymograph style (Middle). The white dash line indicates EGF addition. Migration paths of individual cells in 2 h are presented before or after EGF addition (Right). The color of path is labeled according to time. Start time is marked in the top right corner. (D) Time traces of ERK activity and dispersion from images in panel (C). Black dashed lines indicate EGF addition. (E) Migration arrest and reconnection of dispersal cells after pERK transition inhibition. Monolayer cells were preincubated with EGF prior to FR adding. 0:00 (h) and white dash line denote FR addition. (F) Time traces of ERK activity and dispersion from the time-lapse images in panel (E). Black dashed lines indicate FR addition. (G) Dynamic changes of ERK activity under different treatments in dispersal migration. Monolayer H1650 cells were preincubated with EGF and GTPase inhibitor prior to FR adding (Upper). Layers of ERK2GOF or K-RasG12V cells were maintained in normal medium prior to FR adding (Lower). White dash lines denote FR addition. (H) Changes of ERK activity and dispersion in dispersal migration treated with different inhibitors. EC: epithelial H1650 cells. Rhi+E: RhoA inhibition plus EGF stimulation; Rai+E: Rac1 inhibition plus EGF stimulation. Data are from 10 to 19 regions of different cell monolayers and shown as mean ± SEM. **, P < 0.01 versus the corresponding EGF or Ctrl group.
Fig. 7.
Fig. 7.
Invasion and metastasis abilities in epithelial H1650 cells with pERK transition activity. (A) 3D invasion assay in spheroids of constitutively ERK-activated epithelial H1650 cells under different treatments. The images show quarters of the invasive cell spheroids. EC+E&FR: cells incubation with EGF and FR. Blue lines indicate the invasive borders of cell spheroids. Red circles indicate the single detached cells. (B) Analysis of invasion ability of different epithelial H1650 cell spheroids. The invasion rate was calculated by daily change in the spheroid area normalized to the first day. N = 10 ~ 20. Data were shown as mean ± SEM. **, P < 0.01. (C) In vivo metastasis of epithelial H1650 cells with pERK transition activity. Nude mice injected with bioluminescent labeled different epithelial H1650 cell lines were imaged weekly (Left). Organs were separated and imaged immediately after in vivo imaging at week 5 (Right). H: heart; li: liver; s: spleen; lu: lung; k: kidney; c: colon; d: diaphragm. (D) Quantification of bioluminescent imaging data of nude mice. Data are shown as mean ± SEM. N = 7 ~ 15. *, P < 0.05; **, P < 0.01 versus the corresponding EC group.

Similar articles

Cited by

References

    1. Chaffer C. L., Weinberg R. A., A perspective on cancer cell metastasis. Science 331, 1559–1564 (2011). - PubMed
    1. Jain S., Ladoux B., Mege R. M., Mechanical plasticity in collective cell migration. Curr. Opin. Cell Biol. 72, 54–62 (2021). - PubMed
    1. Nishimura K., et al. , Regulation of invasive potential of human prostate cancer cell lines by hepatocyte growth factor. Int. J. Urol. 5, 276–281 (1998). - PubMed
    1. Liu Y. J., et al. , Confinement and low adhesion induce fast amoeboid migration of slow mesenchymal cells. Cell 160, 659–672 (2015). - PubMed
    1. Lehmann S., et al. , Hypoxia induces a HIF-1-dependent transition from collective-to-amoeboid dissemination in epithelial cancer cells. Curr. Biol. 27, 392–400 (2017). - PubMed

Substances

LinkOut - more resources