. 2024 Dec;28(23):e70276.
doi: 10.1111/jcmm.70276.

TLR3 Knockdown Attenuates Pressure-Induced Neuronal Damage In Vitro

Affiliations

TLR3 Knockdown Attenuates Pressure-Induced Neuronal Damage In Vitro

Li Lin et al. J Cell Mol Med. 2024 Dec.

Abstract

The disruption of nerve parenchyma and axonal networks triggered by spinal cord injury (SCI) can initiate a cascade of events associated with secondary injury. Toll-like receptors play a critical role in initiating and regulating immune-inflammatory responses following SCI; however, the precise involvement of Toll-like receptor-3 (TLR3) in secondary neuronal injury remains incompletely understood. To investigate the potential contribution of TLR3 in mediating neuronal pressure-induced damage, we established a stress-induced neuronal damage model using rat anterior horn motor neuron line (VSC4.1), which was subjected to varying levels and durations of sustained pressure. Our findings suggest that pressure induces neuronal damage and apoptosis, and reduced proliferation rates in VSC4.1 cells. Furthermore, this pressure-induced neuronal injury is accompanied by upregulation of TLR3 expression and activation of downstream TLR3 signalling molecules. Knockdown experiments targeting TLR3 significantly alleviate pressure-induced motor neuron injury and apoptosis within the anterior horn region while promoting mitochondria-related autophagy and reducing mitochondrial dysfunction via the TLR3/IRF3 and TLR3/NF-κB pathways.

Keywords: TLR3; apoptosis; autophagy; microtubule‐associated protein‐2; mitochondria; pressure‐injured; spinal cord injury.


Conflict of interest statement

The authors declare no conflicts of interest.

Figures
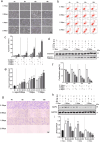
FIGURE 1
FIGURE 1
Sustained pressure induces neuronal apoptosis and neuronal damage in VSC4.1 cells. (a) Cellular morphological changes across various pressures and distinct pressure phases (400×). (b) Flow cytometric analysis of VSC4.1 cells at varied pressure conditions and compression protocols. (c) Assessment of cellular apoptotic rates in response to fluctuating pressure conditions across multiple pressure phases (n = 3). (d) Temporal evaluation via western blotting for Caspase‐3 and cleaved Caspase‐3 levels during sustained application of pressure. (e) Determination of the expression ratio between cleaved Caspase‐3 and Caspase‐3 in VSC4.1 cells subjected to varying magnitudes of applied pressure (n = 3). (f) Cellular proliferation in VSC4.1 cells across various applied pressures and duration intervals (n = 3). (g) Nissl staining of VSC4.1 cells after exposure to diverse pressure magnitudes and duration levels. (h) Western blot analysis of MAP2 expression in VSC4.1 cells subjected to sustained pressure at different intervals. (i) Immunofluorescence analysis of MAP2 expression levels in VSC4.1 cells under varying durations of sustained pressure (n = 3). Compared with 0.1 MPa, *p < 0.05, **p < 0.01, ***p < 005.
FIGURE 2
FIGURE 2
Sustained pressure on VSC4.1 cells activates TLR3 pathway signalling. (a) Western blot analysis of TLR3 in pressurised cells. (b) Quantification of the results from panel c (n = 3). (c) Western blot analysis IRF3 in pressurised cells. (d) Quantification of the results from panel e (n = 3). (e) Western blot analysis of NF‐κB p65 in cells subjected to pressure. (f) Quantification of the results from panel g (n = 3). (g) Immunofluorescence staining of TLR3 under pressure conditions. (h) Mean immunofluorescence intensity measurements for TLR3 staining in cells subjected to pressure (n = 3). (i) Immunofluorescence staining of phosphorylated IRF3 in pressure‐treated cells. (j) Mean immunofluorescence intensity measurements for phosphor‐IRF3 staining in pressure‐treated cells (n = 3). (k) Immunofluorescent staining of phosphorylated NF‐kB P65 in pressure‐treated cells. (l) Mean immunofluorescence intensity measurements for P‐NF‐KB P65 staining in pressure‐treated cells (n = 3). Compared with 0.1 MPa, *p < 0.05, **p < 0.01, ***p < 0.005; compared with 1.5 MPa, # p < 0.05, ## p < 0.01, ### p < 0.005. (scale bar = 20 μm).
FIGURE 3
FIGURE 3
TLR3 knockdown mitigates pressure‐induced neuronal apoptosis. (a) Cell morphology observed using phase contrast microscopy after small molecule intervention targeting TLR3. (b) Flow cytometry analysis of the effects of sustained pressure and TLR3 knockdown or overexpression on VSC4.1 cells. (c) The apoptotic rate of VSC4.1 cells under sustained pressure after TLR3 knockdown or overexpression (n = 3). (d) Western blot analysis of the influence of TLR3 knockdown or overexpression on cleaved Caspase‐3 expression in VSC4.1 cells under sustained pressure. (e) The ratio of cleaved Caspase‐3 to Caspase‐3 expression, affected by TLR3 interference, was determined in VSC4.1 cells under sustained pressure (n = 3). (f) Evaluation of TLR3 knockdown or overexpression by immunofluorescence detection of cleaved Caspase‐3 in VSC4.1 cells subjected to sustained pressure. (g) Median fluorescence intensity measurement of cleaved Caspase‐3 (n = 3) in VSC4.1 cells with TLR3 knockdown or overexpression subjected to sustained pressure. Compared with 0.1 MPa, *p < 0.05, **p < 0.01, ***p < 0.005; compared with 1.5 MPa, # p < 0.05, ## p < 0.01, ### p < 0.005. The ‘+’represents knockout (si) or overexpression (oe). The ‘−’represents negative controls without knockout (si) or overexpression (oe). (scale bar = 20 μm).
FIGURE 4
FIGURE 4
TLR3 knockdown protects VSC4.1 cells from neuronal damage caused by sustained pressure. (a) Impact of TLR3 knockdown on the proliferation rate of VSC4.1 cells under sustained pressure. (b) Visualisation of the effect of TLR3 knockdown by Nissl staining of VSC4.1 cells under sustained pressure. (c) Western blot analysis of MAP2 levels upon TLR3 knockdown in VSC4.1 cells subjected to sustained pressure. (d) Influence of TLR3 knockdown on MAP2 expression in VSC4.1 cells under sustained pressure. (e) TLR3 knockdown alters MAP2 immunofluorescence in VSC4.1 cells exposed to sustained pressure. (f) TLR3 knockdown affects the median fluorescence intensity of MAP2 in VSC4.1 cells under sustained pressure (n = 3). Compared with 0.1 MPa, *p < 0.05, **p < 0.01, ***p < 0.005; compared with 1.5 MPa, # p < 0.05, ## p < 0.01, ### p < 0.005. The ‘+’represents knockout (si) or overexpression (oe). The ‘−’represents negative controls without knockout (si) or overexpression (oe). (scale bar = 20 μm).
FIGURE 5
FIGURE 5
TLR3 knockdown enhances the induction of protective autophagy in VSC4.1 cells under sustained pressure. (a) Western blot analysis of LC3B expression in the VSC4.1 in vitro spinal cord stress injury model. (b) Quantification of LC3B‐I levels in VSC4.1 cells subjected sustained pressure (n = 3). (c) Quantification of LC3B‐II levels in VSC4.1 cells subjected to sustained pressure (n = 3). (d) Calculation of the ratio between LC3B‐II and LC3B‐I expression levels in VSC4.1 cells under sustained pressure (n = 3). (e) Autophagy structures and mitochondria were detected by transmission electron microscopy. (f) Visualisation of autophagy flux using Ad‐mCherry‐GFP‐LC3 in VSC4.1 cells. Bright yellow spots upon infection with lentiviruses carrying RFP and GFP markers indicate the occurrence of autophagy. Upon fusion with lysosomes, the decreased pH leads to quenching of modified GFP protein fluorescence, resulting in red light only. (g) The ratio of the average fluorescence intensity of red/green light was calculated to measure the number of autophagic lysosomes (n = 3). (h) Western blot analysis of P62 expression in the VSC4.1 in vitro spinal cord stress injury model. (i) Quantification of P62 levels in VSC4.1 cells subjected sustained pressure (n = 3). Compared with 0.1 MPa, *p < 0.05, **p < 0.01, ***p < 0.005; compared with 1.5 MPa, # p < 0.05, ##p < 0.01, ### p < 0.005. The ‘+’represents knockout (si) or overexpression (oe). The ‘−’represents negative controls without knockout (si) or overexpression (oe). (scale bar = 20 μm).
FIGURE 6
FIGURE 6
TLR3 knockdown increases mitochondria‐associated autophagy. (a) The relationship between autophagy and mitochondria was evaluated using LC3‐COXIV colocalised immunofluorescence staining (n = 3). DAPI was used as a background stain. (b) The ratio of red/green mean fluorescence intensity was measured in LC3‐COXIV immunofluorescence colocalisation (n = 3). (c) Western blotting of the expression level of Cyt‐c under pressure (n = 3). (d) The expression level of Cyt‐c was evaluated in pressure‐treated cells (n = 3). (e) Cyt‐c immunofluorescence was employed to assess mitochondrial damage in pressure‐treated cells. (f) The median fluorescence intensity of Cyt‐c was measured in pressure‐treated cells (n = 3). Compared with 0.1 MPa, *p < 0.05, **p < 0.01, ***p < 0.005; compared with 1.5 MPa, # p < 0.05, ## p < 0.01, ### p < 0.005. The ‘+’represents knockout (si) or overexpression (oe). The ‘−’represents negative controls without knockout (si) or overexpression (oe). (scale bar = 20 μm).
FIGURE 7
FIGURE 7
TLR3 knockdown ameliorates mitochondrial dysfunction in VSC4.1 cells exposed to sustained pressure. (a) JC‐1 staining results showing the cellular response to pressure (n = 3). JC‐1 accumulates within the matrix at high mitochondrial membrane potential, forming J‐aggregates that emit red fluorescence. Conversely, JC‐1 exists as monomers emitting green fluorescence at low mitochondrial membrane potential. (b) Mean intensity analysis of green fluorescence emitted by JC‐1 monomers localised within mitochondria under pressure conditions (n = 3). (c) Mitochondrial MPTP opening rate of pressurised cells (n = 3). M1: High fluorescence signal of the cytoplasm and mitochondria; M2: Mitochondrial fluorescence signal only. M1‐M2 indicates the high fluorescence signal in the cytoplasm. (d) High fluorescence signal M2 (n = 3) in mitochondria of pressurised cells. (e) DHE‐A assay of mitochondrial reactive oxygen species (ROS) during stress injury (n = 3). (f) Quantification of the results in panel e (n = 3). Compared with 0.1 MPa, *p < 0.05, **p < 0.01, ***p < 0.005; compared with 1.5 MPa, # p < 0.05, ## p < 0.01, ### p < 0.005. The ‘+’represents knockout (si) or overexpression (oe). The ‘−’represents negative controls without knockout (si) or overexpression (oe).

References

    1. Yao M., Pu P. M., Li Z. Y., et al., “Melatonin Restores Endoplasmic Reticulum Homeostasis to Protect Injured Neurons in a Rat Model of Chronic Cervical Cord Compression,” Journal of Pineal Research 74, no. 4 (2023): e12859. - PubMed
    1. Li Z. Y., Zhou A. F., Li G., et al., “Chronic Spinal Cord Compression Associated With Intervertebral Disc Degeneration in SPARC‐Null Mice,” Neural Regeneration Research 18, no. 3 (2023): 634–642. - PMC - PubMed
    1. Fakhri S., Sabouri S., Kiani A., et al., “Intrathecal Administration of Naringenin Improves Motor Dysfunction and Neuropathic Pain Following Compression Spinal Cord Injury in Rats: Relevance to Its Antioxidant and Anti‐Inflammatory Activities,” Korean Journal of Pain 35, no. 3 (2022): 291–302. - PMC - PubMed
    1. Farooque M., “Spinal Cord Compression Injury in the Mouse: Presentation of a Model Including Assessment of Motor Dysfunction,” Acta Neuropathologica 100, no. 1 (2000): 13–22. - PubMed
    1. Takano M., Kawabata S., Komaki Y., et al., “Inflammatory Cascades Mediate Synapse Elimination in Spinal Cord Compression,” Journal of Neuroinflammation 11 (2014): 40. - PMC - PubMed

MeSH terms

LinkOut - more resources