. 2024 Dec 13;9(102):eadl4613.
doi: 10.1126/sciimmunol.adl4613. Epub 2024 Dec 13.

Asparagine availability controls germinal center B cell homeostasis

Affiliations

Asparagine availability controls germinal center B cell homeostasis

Yavuz F Yazicioglu et al. Sci Immunol. .

Abstract

The rapid proliferation of germinal center (GC) B cells requires metabolic reprogramming to meet energy demands, yet these metabolic processes are poorly understood. By integrating metabolomic and transcriptomic profiling of GC B cells, we identified that asparagine (Asn) metabolism was highly up-regulated and essential for B cell function. Asparagine synthetase (ASNS) was up-regulated after B cell activation through the integrated stress response sensor GCN2. Conditional deletion of Asns in B cells impaired survival and proliferation in low Asn conditions. Removal of environmental Asn by asparaginase or dietary restriction compromised the GC reaction, impairing affinity maturation and the humoral response to influenza infection. Furthermore, metabolic adaptation to the absence of Asn required ASNS, and oxidative phosphorylation, mitochondrial homeostasis, and synthesis of nucleotides were particularly sensitive to Asn deprivation. These findings demonstrate that Asn metabolism acts as a key regulator of B cell function and GC homeostasis.


Conflict of interest statement

Competing interest

The authors have no competing interests.

Figures

Figure 1
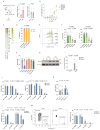
Figure 1. GC B cells have highly active protein synthesis and asparagine metabolism
A. Schematic of in vivo bio-orthogonal non-canonical amino acid tagging. B. Representative immunofluorescence images of splenic GCs labelled with OPP, tdTomato (AID), and L-AHA. Scale bar: 50μm. C. Quantification of OPP (20µM) incorporation ex vivo (30 min) in naïve, LZ GC and DZ GC B cells from non-reporter WT mice (n=4). D. Heatmap of significantly differentially abundant metabolites (Padj <0.05) measured by LC-MS (n=3 pools of 3 mice/pool). E. Integrated pathway analysis of differentially abundant metabolites from F and expressed genes from ImmGen in GC compared to naïve B cells (GSE15907). F. Heatmap of relative gene expression of KEGG Alanine, Aspartate, and Glutamate pathway in GC vs naïve B cells, represented as fold change. Data are from GSE133971(26). G. Relative expression of Asns and Got2 in GC and naïve B cells at day 7 post SRBC immunization, normalised to Ubiquitin C (Ubc) (n=4 mice). H. Relative amounts of asparagine, aspartate, glutamine, and glutamate measured by LC-MS (n=3 pools of 3 mice) as in F. I. Diagram of asparagine synthesis and its association with the TCA cycle. J. Multiplexed CellDIVE images of normal human tonsil section, with immunofluorescence staining for ASNS, CD21, IgD, MZB1 and CD3. Representative of 3 separate tonsils. Scale bar = 250μm. K. Multiplexed CellDIVE images of normal human tonsil serial section of L, with immunofluorescence staining for SLC1A5 (ASCT2), CD21 and IgD. Representative of 3 separate tonsils. Scale bar = 250μm. Statistical significance was determined by one-way ANOVA with Tukey’s multiple testing correction (C), two-way ANOVA with Tukey’s multiple testing correction (D), hypergeometric test (E), unpaired two-tailed t test (G, H)). Data representative of two independent experiments (B-D, G, H). Data are presented as the mean ± SEM.
Figure 2
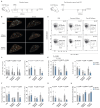
Figure 2. B cells require ASNS when the availability of Asn is limited
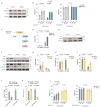
A. Relative amounts of Asn and Gln in serum and lymph node interstitial fluid (LNIF) measured by LC-MS (n=3 pools of 9-14 WT mice for LNIF and 2-3 WT mice for serum). B. Quantification of HPG ΔMFI as in fig. S2A. C. Heatmap of fold change of indicated amino acids in B cells after 24h (n=3 mice). D. Fractional labelling following culture with 15N1-Asn for 24h (n=3 mice). E. Representative histogram of CellTrace Violet in B cells stimulated with IL-4 and anti-CD40 and cultured for 72h with the indicated concentration of Asn. F. Division index and viability of B cells cultured as in E. Each dot represents a single mouse. G. Division index of B cells stimulated as in E in the presence or absence of the indicated amino acids (n=6 mice H. Immunoblot of ASNS in B cells stimulated with IL-4 and anti-CD40 with or without Asn, at the indicated timepoints. I. Relative expression of Asns by qPCR in stimulated (IL-4 and anti-CD40 for 24h) B cells (n=4 mice per group). J. Division index and viability of B cells from B-Asns and B-WT mice stimulated for 72h with IL-4 and anti-CD40 at the indicated concentration of Asn (n=3 mice per group). K. Quantification of GC B cell proportions by flow cytometry in lymph node slices. Each dot represents single lymph node (n=8 lymph nodes from n=4 mice). L. Viability of B cells stimulated as in E (left panel), or prestimulated in the presence of Asn for 72h before Asn withdrawal (right panel)(n=3 mice). M. Representative flow cytometry plots and quantification of plasmablasts generated following stimulation of B cells with LPS and IL-4 for 72h. Statistical significance was determined by a two-tailed Mann–Whitney U-test (A), repeated measures one way ANOVA with Tukey’s multiple testing correction (F-G) and ordinary one way ANOVA with Dunnet’s multiple testing correction (E,H), paired two-tailed t test (N) or two-way ANOVA with Šidák’s multiple testing correction (J-L,O,Q). Data are pooled from two (J-L) or three (A,F,G,M) independent experiments or representative of two independent experiments (B-D, H). Data are presented as the mean ± SEM.
Figure 3
Figure 3. The GC reaction is sensitive to Asn deprivation
A. Schematic of in vivo ASNase administration regimes. B. Immunohistochemistry of representative spleen sections (8μm) at day 9 post SRBC immunisation. GL-7 and CD21/35 highlights GCs and B cell follicles, respectively. DAPI is used as background staining. Scale bar 500μm. C. Image quantification of splenic GCs from B. Left panel: mean area of individual GCs (μm2). Each data point represent a GC pooled from n=3 mice per condition. Right panel: frequency of GCs larger than 20000µm2 (0.02mm2). Each data point indicates a mouse. n=3 from each condition. D. Representative flow cytometry plot of GC B cells (CD19+CD38-GL-7+) at day 9 post-immunisation with SRBC, from B-WT and B-Asns mice treated with PBS, standard ASNase or post-GC ASNase. E. Quantification of splenic CD38-GL-7+ GC B cell proportions (% of CD4-CD19+ B cells) and absolute counts. Each data point represents a single mouse. F. Quantification of IgD-IRF4+CD138+ splenic plasmablast/plasma cell proportions (% of total) and absolute counts. Each data point represents a single mouse. G. Quantification of the GC B cell numbers relative to TFH numbers gated as CXCR5hi PD-1+ within CD19- CD4+ FoxP3- T cells. Each data point represents a single mouse. H. Quantification of the proportion of the grey zone (GZ) (CD86hiCXCR4hi) GC B cells (as % of GC B cells). Statistical significance was determined by two-way ANOVA with Šidák’s multiple testing correction. Data are pooled from ≥3 independent experiments for each panel. Data are presented as the mean ± SEM.
Figure 4
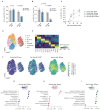
Figure 4. Asn is required for GC B cell function
A. Ratio of splenic GC B cells in CD45.2+ B cells normalised to CD45.1+ WT counterparts from bone marrow chimeric mice. Each data point represents a single mouse. B. Quantification of NP2:NP20 ratio (at 1:200 dilution) of IgG1 anti-NP antibodies at day 14, n=4-5 mice each condition. C. Comparison of the ratio of IgG1 NP-specific high-affinity antibodies to low-affinity antibodies detected by binding to NP2 and NP>20 antigens, respectively, from B-WT/control diet (n = 4), B-Asns/control diet (n = 4), B-WT/Asn-free diet (n = 5), B-Asns/Asn-free diet (n=5) across different time points. D. UMAP and cluster annotation based on multiresolution variational inference (MrVI) latent space of integrated control diet/B-WT (n=2550 cells), control diet/B-Asns (n=2971 cells), Asn-free diet/B-WT (n=1944 cells), and Asn-free diet/B-Asns (n=2700 cells) (n = 3 mice per condition). E. Heatmap of selected differentially expressed genes used to identify clusters, as in D. F. Multiresolution variational inference (MrVI) cluster-free differential gene expression effect size for the indicated conditions relative to the control diet/B-WT group. G. Gene set enrichment analysis (GSEA) of the indicated pathways in the ‘LZ selected’ cluster of Asn-free diet/B-Asns relative to control diet/B-WT groups. H. GSEA of the indicated pathways in the in the ‘GZ G2/M’ cluster of Asn-free diet/B-Asns relative to control diet/B-WT groups. I. GSEA of the indicated pathways in the in the ‘DZ’ cluster of Asn-free diet/B-Asns relative to control diet/B-WT groups. Statistical significance was determined by two-way ANOVA with Tukey’s multiple testing correction (D) or Šidák’s multiple testing correction (B) and adaptive multi-level split Monte-Carlo scheme (I-K). Data are pooled from two independent experiments (A-C). Data are presented as the mean ± SEM.
Figure 5
Figure 5. Asn metabolism controls the humoral response to influenza infection
A. Schematic of influenza/dietary modification experiment. B. Dilution curves of X31-specific IgG and IgM antibodies at day 14. n=4-6 mice each condition. C. Comparison of X31-specific IgG (at 1/5×104 dilution) at day 14. n=4-6 mice each condition. D. Comparison of high-avidity X31-specific IgG and IgM (at 1/5×104 dilution) quantified by values in C and fig S7B with matching avidity values in fig. S7D-E at day 14. n=4-6 mice each condition. E. Immunohistochemistry of representative spleen sections (8μm) at day 21 post X31 influenza infection. GL-7 highlights GCs. DAPI is used as background staining. Scale bar 500µm. F. Image quantification of X31-induced splenic GCs from E. Mean GC area (μm2) per mouse and GC count per splenic section (average of two non-serially sliced) per mouse. Each data point indicates a mouse. n=3 from each condition. G. Flow cytometric quantification of splenic GC B cell (as gated in fig. S7G) proportions at day 21. n=4-6 mice each condition H. Dilution curves and quantification of X31-specific IgG antibodies at day 21. n=4-6 mice each condition as in B. Data pooled from two independent experiments. I. Quantification of GC B cell ratio and counts in mediastinal lymph nodes at day 21. n=3-6 mice each condition. Statistical significance was determined by two-way ANOVA with Tukey’s multiple testing correction (C,D,F,H) or Šidák’s multiple testing correction (G,I). Data are pooled from two independent experiments (A-I). Data are presented as the mean ± SEM.
Figure 6
Figure 6. Disruption of asparagine availability alters B cell metabolism
A. Heatmap of total relative amounts of significantly different metabolites in B cells from B-WT or B-Asns mice as in A. Scale represents row Z-score. Significantly differentially abundant metabolites (Padj < 0.05) are shown. Representative of two independent experiments. B. Abundance of intracellular Asn in B cells cultured as in A, and rescaled plot of Asn-deprived condition. Representative of two independent experiments. C. Fractional contribution of 15N to Asn pool, derived from 15N1-amino or amide Gln, following culture as described in A. D. Heatmap of fractional contribution of 13C to indicated metabolites, derived from U-13C-Gln following culture as described in A. Scale represents row Z-score. Significantly differentially labelled metabolites (Padj < 0.05) are shown. E. Heatmap of fractional contribution of 15N to indicated metabolites, derived from 15N1-amine Gln following culture as described in A, with labelled compound added for final 24h of culture. Scale represents row Z-score. Significantly differentially labelled metabolites (Padj < 0.05) are shown. F. Venn-diagram indicating number of significantly differentially-regulated pathways in B-WT and B-Asns B cells following Asn-withdrawal, based on relative metabolite abundance as in B. Listed pathways are those specifically downregulated in B-Asns B cells. Statistical significance was determined by two-way ANOVA with Šidák’s multiple testing correction (B,D-F), unpaired two-tailed t test (C), or hypergeometric test (G). Data are presented as the mean ± SEM.
Figure 7
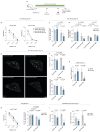
Figure 7. Mitochondrial function in B cells requires Asn
A. Seahorse extracellular flux analysis of B cells (n=3-4 mice). FCCP, carbonyl cyanide-p-trifluoromethoxyphenylhydrazone; Rot/AA, rotenone/antimycin A B. Seahorse extracellular flux analysis of B cells as in A (n=3-4 mice). Extracellular acidification rate (ECAR) was measured during the MitoStress test. C. Seahorse OCR quantification in B-WT (n=3-4 mice) and B-Asns (n=3 mice) B cells. Spare respiratory capacity (SRC) is illustrated. D. Quantification of basal OCR in B-WT and B-Asns B cells. Each data point represents a mouse. E. Quantification of SRC (%) based on quantifications in fig. S9B and Fig. 7D. F. 3D lattice SIM images of COX I and DAPI in B-WT and B-Asns B. Scale bar 5µm. G. Quantification of mitochondrial volume as in F. Each data point represents a cell (n=57 B-WT/Asn400, n=66 B-Asns/Asn400, n=65 B-WT/Asn0, n=53 B-Asns/Asn0) pooled from n=3 mice B-WT or B-Asns mice. H. Heatmap of row z-scores for the gMFI of indicated ETC proteins (mean of n = 2, n = 3 mice per group in total). I. Heatmap of row z-scores for the gMFI of indicated ETC proteins and ratios (mean of n = 3-4) mice treated with ASNase (standard regime). Statistical significance was determined by two-way ANOVA with Tukey’s multiple testing correction (D-E, G). Data are representative of two (G-I) or three pooled independent experiments with 5-6 technical replicates per mouse (A-E) Data are presented as the mean ± SEM.
Figure 8
Figure 8. Asn regulates nucleotide metabolism and the integrated stress response
A. Immunoblot of DHODH and ATIC in B cells stimulated for 24h. B. Viability of B cells stimulated for 72h, supplemented with adenosine, thymidine, uridine, cytidine, and guanosine at 0μM, 30μM or 100μM each (n=3 mice per group). C. Schematic of the GCN2 branch of the integrated stress response. D. Relative expression of Atf4 in B cells stimulated for 72h (n=3 mice per group). E. Immunoblot of CHOP in B cells stimulated for 24h. F. Immunoblot of ASNS, ATF4, phospho-4E-BP1 in B cells stimulated for 24h. G. Division index of Gcn2-/- and wild type B cells stimulated for 72h. Each data point represents a mouse. H. Quantification of plasmablast differentiation of Gcn2-/- and wild type B cells following stimulation with LPS and IL-4 for 72h (n=3 mice per group). I. Viability of Gcn2-/- and wild type B cells stimulated for 72h (n=3 Gcn2-/- mice and n=9 wild type mice). J. CD45.2 Gcn2-/- naïve and GC B cell abundance relative to CD45.1 wild type counterparts, fed control or Asn-free diets (n=4 mice). K. GC B cell frequencies in the CD45.2+Gcn2-/- and CD45.1+ wild type B cell compartments under control or Asn-free diet (n=4 mice) settings. L. Viability of B cells from B-WT or Gcn2-/- mice (n=3 mice) stimulated for 72h, supplemented with adenosine, thymidine, uridine, cytidine, and guanosine at 0μM, 30μM or 100μM each. Statistical significance was determined by repeated measure two-way ANOVA with Tukey’s multiple testing correction (B,D,K) or Šidák’s multiple testing correction (G-I,M), one-way ANOVA with Tukey’s multiple testing correction (L). Data are representative of two independent experiments (A, D-F) or pooled from two (B,H,J-L) or ≥3 experiments (G, I). Data are presented as the mean ± SEM.

References

    1. Victora D, Nussenzweig MC. Germinal Centers. Annu Rev Immunol. 2022;40:413–442. - PubMed
    1. Boothby M, Rickert RC. Metabolic Regulation of the Immune Humoral Response. Immunity. 2017;46:743–755. doi: 10.1016/j.immuni.2017.04.009. - DOI - PMC - PubMed
    1. Chen D, Wang Y, Manakkat Vijay GK, Fu S, Nash CW, Xu D, He D, Salomonis N, Singh H, Xu H. Coupled Analysis of Transcriptome and BCR Mutations Reveals Role of OXPHOS in Affinity Maturation. Nat Immunol. 2021;22:904–913. - PubMed
    1. Weisel FJ, Mullett SJ, Elsner RA, Menk AV, Trivedi N, Luo W, Wikenheiser D, Hawse WF, Chikina M, Smita S, Conter LJ, et al. Germinal Center B Cells Selectively Oxidize Fatty Acids for Energy While Conducting Minimal Glycolysis. Nat Immunol. 2020;21:331–342. doi: 10.1038/s41590-020-0598-4. - DOI - PMC - PubMed
    1. Urbanczyk S, Baris OR, Hofmann J, Taudte RV, Guegen N, Golombek F, Castiglione K, Meng X, Bozec A, Thomas J, Weckwerth L, et al. Mitochondrial Respiration in B Lymphocytes Is Essential for Humoral Immunity by Controlling the Flux of the TCA Cycle. Cell Rep. 2022;39:110912. - PubMed

Publication types

LinkOut - more resources