. 2024 Dec 13;10(50):eadm7928.
doi: 10.1126/sciadv.adm7928. Epub 2024 Dec 13.

Ex vivo expansion and hydrogel-mediated in vivo delivery of tissue-resident memory T cells for immunotherapy

Affiliations

Ex vivo expansion and hydrogel-mediated in vivo delivery of tissue-resident memory T cells for immunotherapy

Shuyi Li et al. Sci Adv. .

Erratum in

Abstract

Tissue-resident memory T (TRM) cells preferentially reside in peripheral tissues, serving as key players in tumor immunity and immunotherapy. The lack of effective approaches for expanding TRM cells and delivering these cells in vivo hinders the exploration of TRM cell-mediated cancer immunotherapy. Here, we report a nanoparticle artificial antigen-presenting cell (nano-aAPC) ex vivo expansion approach and an in vivo delivery system for TRM cells. Using the nano-aAPC platform, we expanded functional antigen-specific murine and human TRM-like CD8+ T cells ex vivo. We also developed an injectable macroporous hyaluronic acid (HA) hydrogel to deliver TRM-like cells. TRM-like cells delivered in the optimized HA hydrogel trigger robust local and systemic antitumor immunity and show synergistic effects with anti-PD-1 treatment. Our findings suggest that nano-aAPC-induced TRM-like cells, coupled with a hydrogel delivery system, offer an efficient way to advance the understanding of TRM cell-mediated cancer therapy.


Figures

Fig. 1.
Fig. 1.. Schematics of TRM-like cell generation stimulated and expanded by nano-aAPCs conjugated with pMHC-I and anti-CD28 antibodies in the presence of IL-2, IL-15, and TGF-β, and delivery of TRM-like cells by HA hydrogel in vivo.
Created with BioRender.com.
Fig. 2.
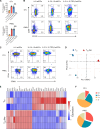
Fig. 2.. Nano-aAPCs with IL-2, IL-15, and TGF-β induce functional antigen-specific mouse CD8+ T cells with TRM phenotype and transcriptional profile.
(A) Fold expansion of PMEL and OT-I CD8+ T cells expanded by nano-aAPCs in the presence of various cytokine mixes over 6 days. Each bar represents means ± SEM. n = 3. One-way analysis of variance (ANOVA) with Tukey’s multiple comparisons test. ***P < 0.001. (B) Expression of TRM marker (CD69 and CD103) on PMEL and OT-I CD8+ T cells on day 6. (C) Expression of homing marker (CD62L) on PMEL and OT-I CD8+ T cells on day 6. (D) Principal components analysis (PCA) of top 1000 differentially expressed gene (DEG) expression data from OT-I CD8+ T cells expanded by aAPCs in the presence of IL-2 (TEff) or IL-2, IL-15, and TGF-β (TRM-like). (E) Heatmap of TRM-related signature genes expression in OT-I CD8+ T cells expanded by aAPCs in the presence of IL-2 (TEff) or IL-2/IL-15/TGF-β (TRM-like) (F) Pie charts showing the polyfunctionality profile of PMEL and OT-I CD8+ T cells expanded in the medium containing nano-aAPCs, IL-2, IL-15, and TGF-β. Pie charts represent the fractions of expanded T cells secreting none or any (1, 2, or 3) of the three cytokines IFN-γ, TNF-α, and IL-2.
Fig. 3.
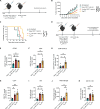
Fig. 3.. Injectable HA macroporous hydrogel–released TRM-like cells display robust antigen-specific cytolytic activity.
(A) Scanning electron microscopy (SEM) image of HA hydrogel showing macroporous structure throughout the hydrogel; scale bars, 250 μm. (B) Pore sizes of HA hydrogel. n = 49. Two tailed unpaired Student’s t test with Welch’s correction. ***P < 0.001. (C) The confocal microscopy three-dimensional (3D) reconstruction images of activated PMEL CD8+ T cells migration in different HA hydrogels; scale bars, 500 μm. (D) Quantitative analysis of infiltrating distance of CD8+ T cells in the HA hydrogel. (E) Schematic of the experimental setup to measure T cell release from HA hydrogel. Created with BioRender.com. (F) Percentage of cells released from HA hydrogel. (G) Schematic of the experimental setup to access antigen-specific killing of adoptively transferred CD8+ T cells. sc, subcutaneous; iv, intravenous. PMEL TRM-like cells induced in vivo killing in the (H) spleens and (I) draining lymph nodes. Each bar represents means ± SEM. n = 5. One-way ANOVA with Tukey’s multiple comparisons test. *P < 0.05 and **P < 0.01.
Fig. 4.
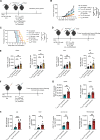
Fig. 4.. TRM-EH exhibits higher antitumor efficacy than intravenously administered TRM-like cells.
(A) Schematic of the experimental design. Mice were administered either naïve OT-I CD8+ T cells (intravenous), OT-I TRM CD8+ T cells (intravenous), or OT-I TRM-EH (subcutaneous) 1 day before subcutaneous MC38-OVA tumor cell injection. (B) MC38-OVA tumor growth curves with means ± SEM. n = 5 to 6. Two-way ANOVA with Tukey’s multiple comparisons test. *P < 0.05 and ***P < 0.001. (C) Mouse survival curve. n = 5 to 6. Log-rank test. **P < 0.01. (D) Schematic of the experimental design. Mice were administered either naïve OT-I CD8+ T cells (intravenous), OT-I TRM-like CD8+ T cells (intravenous), or OT-I TRM-EH (subcutaneous) 1 day before subcutaneous MC38-OVA tumor cell injection. On day 13, tumors were isolated, and tumor-infiltrating immune cells were analyzed. Quantification of total (E) CD45+, (F) CD8+, (G) CD8+ CD45.2+, (H) CD4+, (I) natural killer (NK), (J) macrophages, and (K) CD11b dendritic cells (DC) in the tumor is shown. Each bar represents means ± SEM. n = 3 to 4. One-way ANOVA with Tukey’s multiple comparisons test. *P < 0.05 and **P < 0.01. n.s., not significant.
Fig. 5.
Fig. 5.. TRM-EHs elicited robust local and systemic immune responses in a mouse colon carcinoma model.
(A) Schematic of the experimental design. OT-I TRM-EHs were subcutaneously injected on the same or opposite side of the MC38-OVA tumor 5 days after tumor inoculation. (B) MC38-OVA tumor growth curves with means ± SEM. n = 5 to 6. Two-way ANOVA with Tukey’s multiple comparisons test. *P < 0.05, **P < 0.01, and ***P < 0.001. (C) Mice survival curve. n = 5. Log-rank test. *P < 0.05 and **P < 0.01. (D) Schematic of the experimental design. OT-I TRM-EHs were subcutaneously injected on the same or opposite side of the MC38-OVA tumor 5 days after tumor inoculation. On day 12, tumors were isolated, and tumor-infiltrating immune cells were analyzed. (E) Quantification of total CD45+, CD8+, CD45.2+, CD4+, and NK cells in the tumor is shown. n = 9. One-way ANOVA with Tukey’s multiple comparisons test. *P < 0.05 and ***P < 0.001. (F) Schematic of the experimental design. OT-I CD8+ TRM-EHs were subcutaneously injected on the same side of the MC38-OVA tumor 5 days after tumor cell injection. On day 14, we isolated the tumors and analyzed tumor-infiltrating immune cells. Quantification of total (G) CD45+, CD8+ (H) CD4+, NK cells, CD11b+ dendritic cells, and macrophages in the tumors is shown. Each bar represents means ± SEM. n = 8. Two-tailed unpaired Student’s t test. *P < 0.05, **P < 0.01, and ***P < 0.001.
Fig. 6.
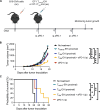
Fig. 6.. TRM-EHs synergized with PD-1 blockade therapy in a mouse melanoma model.
(A) Schematic of the experimental design. Mice were subcutaneously injected with B16-OVA tumor cells. OT-I TRM-EHs were subcutaneously injected 5 days after tumor cell injection. The TRM-EHs were injected on the same flank as the tumor, followed by three anti–PD-1 injections on days 5, 8, and 12. (B) B16-OVA tumor growth curve with means ± SEM. n = 5. Two-way ANOVA with Tukey’s multiple comparisons test. ***P < 0.001. (C) Mouse survival curve. n = 5. Log-rank test. *P < 0.05 and **P < 0.01. ip, intraperitoneal.
Fig. 7.
Fig. 7.. Nano-aAPCs induce functional antigen-specific human CD8+ T cells with TRM-like phenotype.
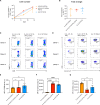
(A) Cell number of MART-1+ CD8+ T cells expanded by nano-aAPCs in the presence of various cytokine mixes on days 0, 7, and 14. Each bar represents means ± SEM. n = 3 donors. (B) Fold expansion of MART-1+ CD8+ T cells expanded by nano-aAPCs in the presence of various cytokine mixes over 14 days. Each bar represents means ± SEM. n = 3 donors. (C) Tetramer staining of MART-1+ CD8+ T cells expanded by nano-aAPCs in the presence of various cytokine mixes on day 14 from three healthy donors. (D) Granzyme B expression of MART-1+ CD8+ T cells on day 14. Mean fluorescence intensity of (E) CD69 expression, (F) CD103 expression, and (G) CD62L expression of MART-1+ CD8+ T cells on day 14. Each bar represents means ± SEM. n = 3 donors. One-way ANOVA with Tukey’s multiple comparisons test. *P < 0.05 and ***P < 0.001.

References

    1. Beura L. K., Wijeyesinghe S., Thompson E. A., Macchietto M. G., Rosato P. C., Pierson M. J., Schenkel J. M., Mitchell J. S., Vezys V., Fife B. T., Shen S., Maspust D., T cells in nonlymphoid tissues give rise to lymph-node-resident memory T cells. Immunity 48, 327–338.e5 (2018). - PMC - PubMed
    1. Walsh D. A., Da Silva H. B., Beura L. K., Peng C., Hamilton S. E., Masopust D., Jameson S. C., The functional requirement for CD69 in establishment of resident memory CD8+ T cells varies with tissue location. J. Immunol. 203, 946–955 (2019). - PMC - PubMed
    1. Kok L., Masopust D., Schumacher T. N., The precursors of CD8+ tissue resident memory T cells: From lymphoid organs to infected tissues. Nat. Rev. Immunol. 22, 283–293 (2022). - PMC - PubMed
    1. Amsen D., van Gisbergen K. P. J. M., Hombrink P., van Lier R. A. W., Tissue-resident memory T cells at the center of immunity to solid tumors. Nat. Immunol. 19, 538–546 (2018). - PubMed
    1. Byrne A., Savas P., Sant S., Li R., Virassamy B., Luen S. J., Beavis P. A., Mackay L. K., Neeson P. J., Loi S., Tissue-resident memory T cells in breast cancer control and immunotherapy responses. Nat. Rev. Clin. Oncol. 17, 341–348 (2020). - PubMed

Publication types