. 2024 Dec 13;10(50):eadr0664.
doi: 10.1126/sciadv.adr0664. Epub 2024 Dec 13.

Predicting optimal mixotrophic metabolic strategies in the global ocean

Affiliations

Predicting optimal mixotrophic metabolic strategies in the global ocean

Holly V Moeller et al. Sci Adv. .

Abstract

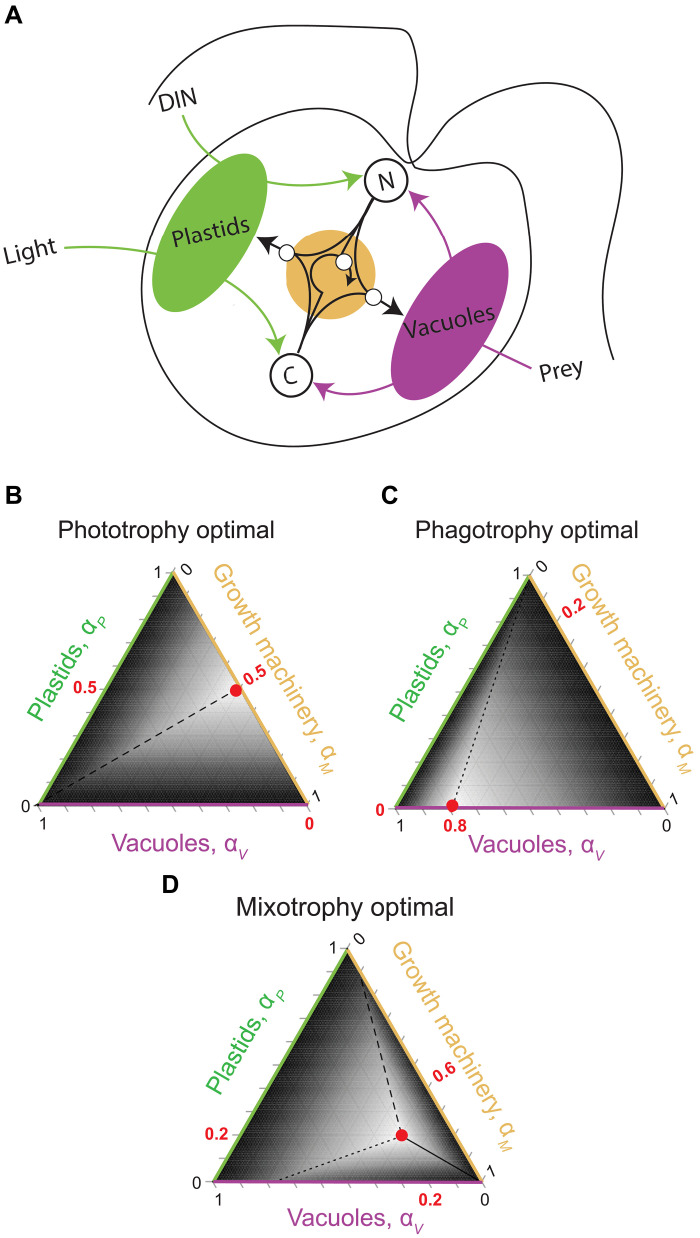
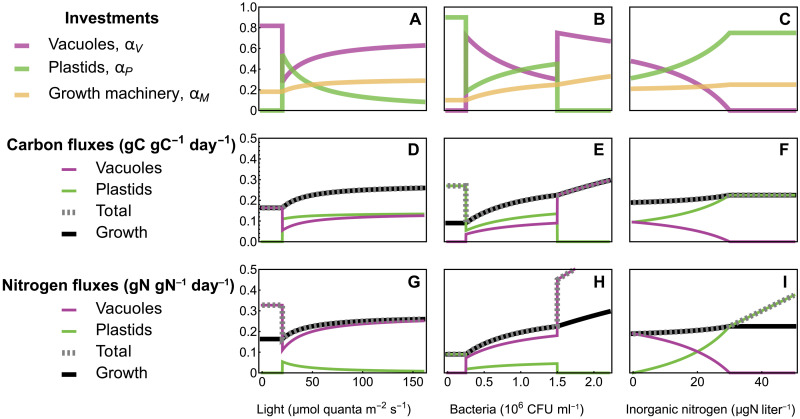
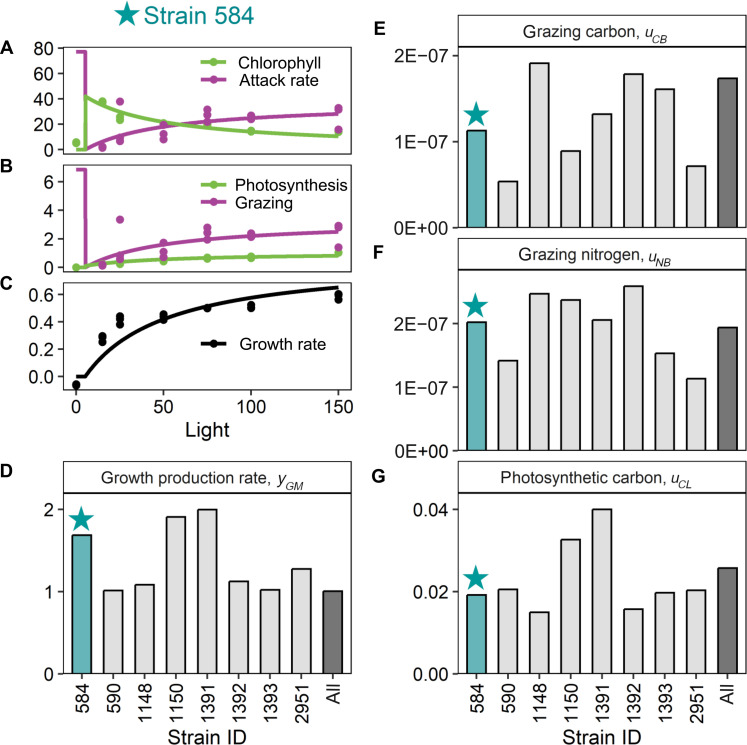
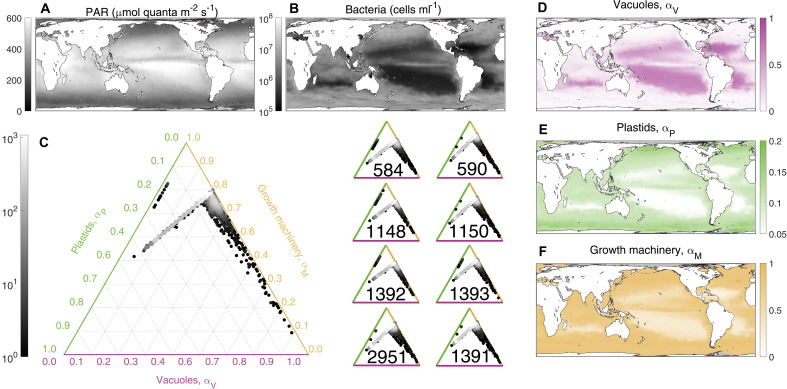
Mixotrophic protists combine photosynthesis with the ingestion of prey to thrive in resource-limited conditions in the ocean. Yet, how they fine-tune resource investments between their two different metabolic strategies remains unclear. Here, we present a modeling framework (Mixotroph Optimal Contributions to Heterotrophy and Autotrophy) that predicts the optimal (growth-maximizing) investments of carbon and nitrogen as a function of environmental conditions. Our model captures a full spectrum of trophic modes, in which the optimal investments reflect zero-waste solutions (i.e., growth is colimited by carbon and nitrogen) and accurately reproduces experimental results. By fitting the model to data for Ochromonas, we were able to predict metabolic strategies at a global scale. We find that high phagotrophic investment is the dominant strategy across different oceanic biomes, used primarily for nitrogen acquisition. Our results therefore support empirical observations of the importance of mixotrophic grazers to upper ocean bacterivory.


Figures

Fig. 1.
Fig. 1.. The MOCHA model.
(A) Model schematic illustrating the cell of a constitutive mixotroph that can obtain carbon (C) and nitrogen (N) by investing in phototrophy and/or prey consumption and then use C and N to build three structures: plastids (green), feeding vacuoles (magenta), and growth machinery (gold). The optimal strategies vary with environmental conditions so that (B) phototrophy is optimal if prey is limited but light and external inorganic nitrogen (DIN) are replete, (C) phagotrophy is optimal if prey is abundant but light and DIN are limited, and (D) mixotrophy is optimal if light and prey are replete but DIN is limited. Ternary plots [(B) to (D)] show heatmaps of growth rate as a function of the three-structure investment strategy (dark gray = slow or negative growth; white = fast growth). Lines indicate strategies that produce equivalence of growth components: Solid lines represent C flux = N flux, dashed lines represent C flux = growth flux, and dotted lines represent N flux = growth flux. Note that when strict phagotrophy or strict phototrophy are optimal, only one of these equalities is true. The growth-maximizing strategy (red dot) is at the convergence point of the lines (or, in the cases of strict phagotrophy or phototrophy, where the nonoptimal metabolic investment is set to zero).
Fig. 2.
Fig. 2.. Resource dependence of mixotroph strategies.
We computed the mixotroph’s optimal allocation strategy (A to C) and corresponding biomass production normalized fluxes of carbon (D to F) and nitrogen (G to I) as a function of light (left column), bacterial abundance (middle column), and inorganic nitrogen (right column). When the optimal strategy is mixotrophy (i.e., αP,αV>0), the total C (in gC gC−1 day−1) and N (in gN gN−1 day−1) fluxes both converge to the growth rate, indicating a zero-waste strategy. However, in some circumstances, a single metabolic investment is optimal. For example, when light is low or bacterial abundance is high, strict phagotrophy maximizes growth, but bacterial stoichiometric differences produce a surplus of N. In contrast, if bacteria are scarce and strict phototrophy is optimal, the organism produces a surplus of C. This plot shows the qualitative behavior of the model, but the parameter values do not correspond to any specific mixotroph species. The environmental parameters are as follows (when they are not the focal parameter on the x axis): light L=30 μmol quanta m−2 s−1, bacteria B=106 CFU ml−1, and dissolved nitrogen I=10 μgN liter1.
Fig. 3.
Fig. 3.. The MOCHA model reproduces patterns in empirical data.
The MOCHA model reproduces patterns in empirical data. We use data from eight strains of Ochromonas to parameterize our model. Here, we show empirical data (points) and model fits (lines) from strain 584 as an example [(A) to (C)]; data and model fits from all strains are given in fig. S5. Empirical data include the following: (A) photosynthetic investment (chlorophyll content per Ochromonas biomass, mgChl gC−1) and heterotrophic investment (attack rate, a.k.a. “clearance rates,” in units of ×107 ml per Ochromonas biomass per day, ml gC−1 day−1), (B) photosynthetic rate (carbon fixed per Ochromonas biomass per day, gC gC−1 day−1) and grazing rate (bacteria per Ochromonas per day, CFU μgC−1 day−1), (C) and growth rate (day−1). On the basis of the model fits, we were able to estimate different parameters in MOCHA [(D) to (G)]. The estimated parameters for strain CCMP 584 (blue bars) were derived from the model fits shown in (A) to (C). The gray bars indicate how variable these parameters were across different strains while the black bar reports the estimated values for an “average Ochromonas cell” based on a global fit to pooled data from all eight strains. Strains varied in their growth factor production rate [yGM, day−1 (D)]; carbon acquisition from bacteria in carbon acquired per carbon vacuole structure, day, and bacteria density [uCB, gC gC−1 day−1 (CFU ml−1)−1 (E)]; nitrogen acquisition from bacteria in nitrogen acquired per carbon vacuole structure, day, and bacteria density [uNB, gN gC−1 day−1 (CFU ml−1)−1 (F)]; and photosynthetic carbon acquisition in carbon acquired per carbon plastid structure, day, and light intensity [uCL, gC gC−1 day−1 (μmol quanta m−2 s−1)−1 (G)].
Fig. 4.
Fig. 4.. Global distributions of mixotroph strategies.
Light (A) and bacteria (B) resource drivers of the model, interpolated from satellite observations and the output of the Darwin model, respectively. Ternary plots (C) show the global distribution of mixotroph strategies in investment space. Shading represents frequency across the global domain, with brighter points indicating a more widespread strategy. The larger ternary plot (left) shows the simulation assuming an average Ochromonas cell with the strategy for each of the individual Ochromonas strains given by the eight smaller ternary plots (right). Maps of optimal investments in digestive vacuoles [αV (D)], plastids [αP (E)], and growth machinery [αM (F)] are given for a mixotroph with uptake, production, and assimilation traits modeled after an average Ochromonas cell. Note the different axes for the color bar range, chosen to highlight global variability in investment strategy. To generate the bacterial abundance, we assumed a uniform ratio of 10 fg C per bacterial cell.

Similar articles

References

    1. Worden A. Z., Follows M. J., Giovannoni S. J., Wilken S., Zimmerman A. E., Keeling P. J., Rethinking the marine carbon cycle: Factoring in the multifarious lifestyles of microbes. Science 347, 1257594 (2015). - PubMed
    1. Selosse M.-A., Charpin M., Not F., Mixotrophy everywhere on land and in water: The grand écart hypothesis. Ecol. Lett. 20, 246–263 (2017). - PubMed
    1. Tittel J., Bissinger V., Zippel B., Gaedke U., Bell E., Lorke A., Kamjunke N., Mixotrophs combine resource use to outcompete specialists: Implications for aquatic food webs. Proc. Natl. Acad. Sci. U.S.A. 100, 12776–12781 (2003). - PMC - PubMed
    1. Crane K. W., Grover J. P., Coexistence of mixotrophs, autotrophs, and heterotrophs in planktonic microbial communities. J. Theor. Biol. 262, 517–527 (2010). - PubMed
    1. Mitra A., Flynn K. J., Burkholder J. M., Berge T., Calbet A., Raven J. A., Granéli E., Glibert P. M., Hansen P. J., Stoecker D. K., Thingstad F., Tillmann U., Våge S., Wilken S., Zubkov M. V., The role of mixotrophic protists in the biological carbon pump. Biogeosciences 11, 995–1005 (2014).

LinkOut - more resources