. 2024 Dec 13;10(50):eadq3073.
doi: 10.1126/sciadv.adq3073. Epub 2024 Dec 13.

Integrated analysis of immunometabolic interactions in Down syndrome

Affiliations

Integrated analysis of immunometabolic interactions in Down syndrome

Lucas A Gillenwater et al. Sci Adv. .

Abstract

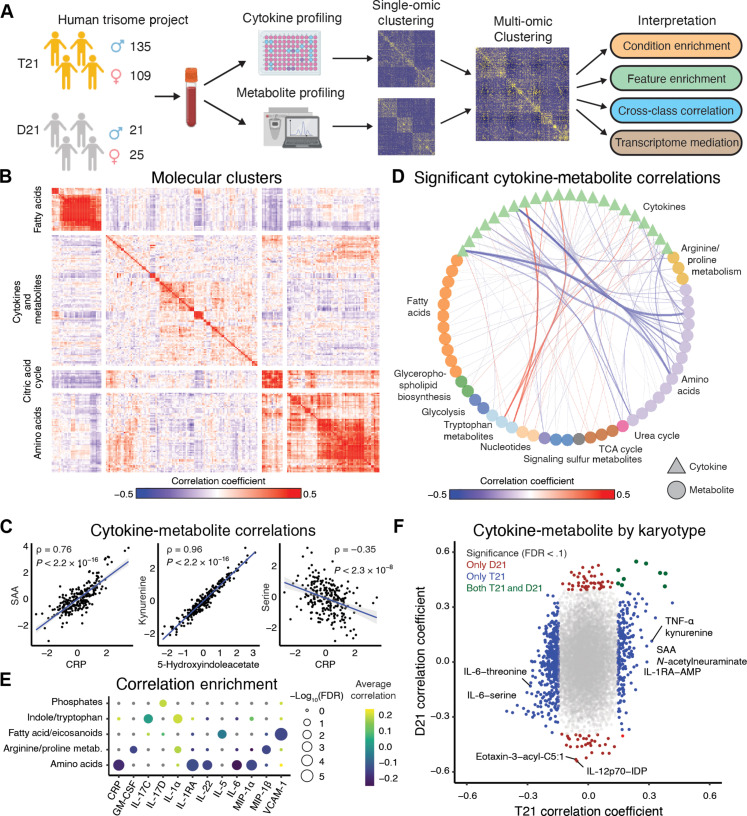
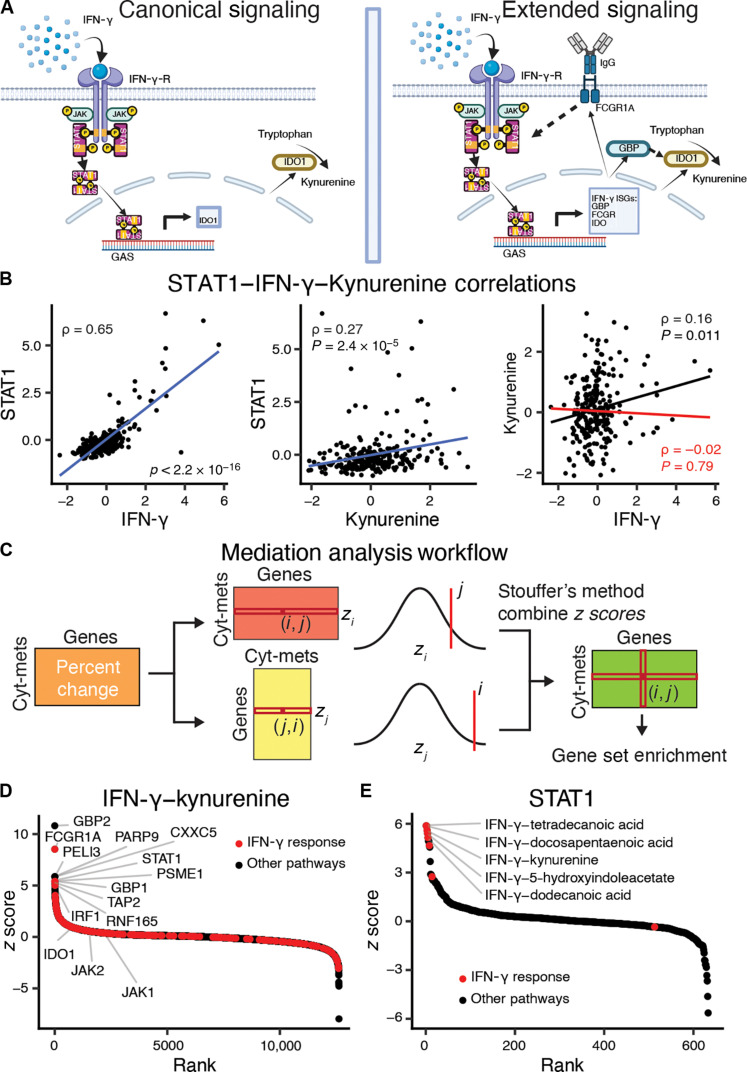
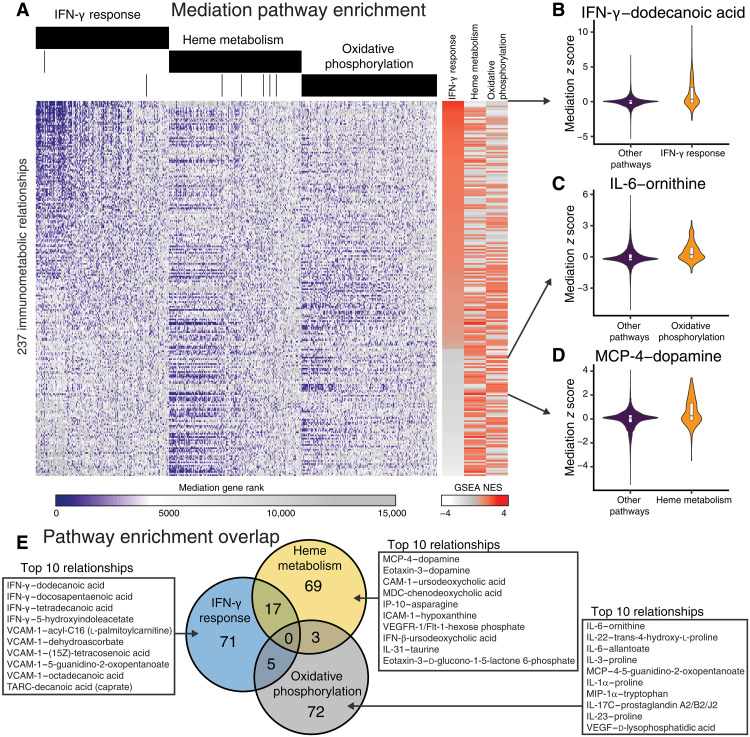
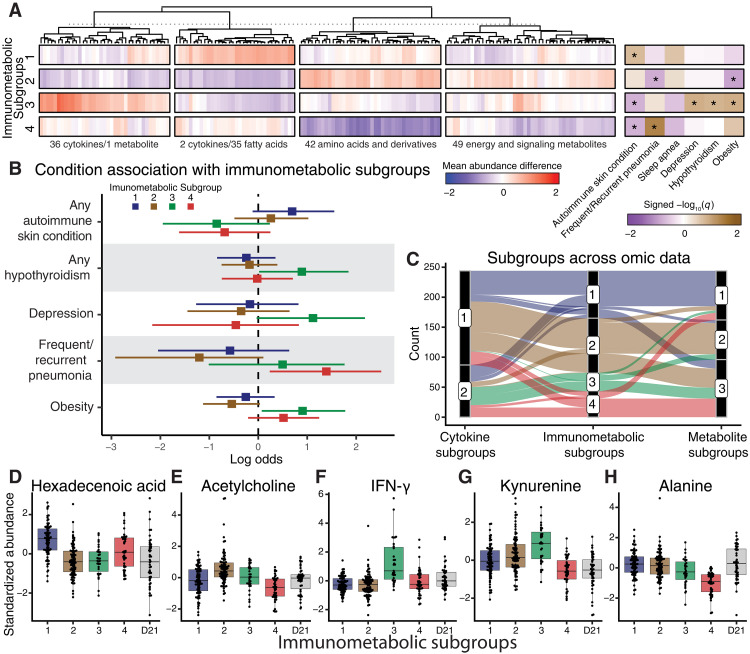
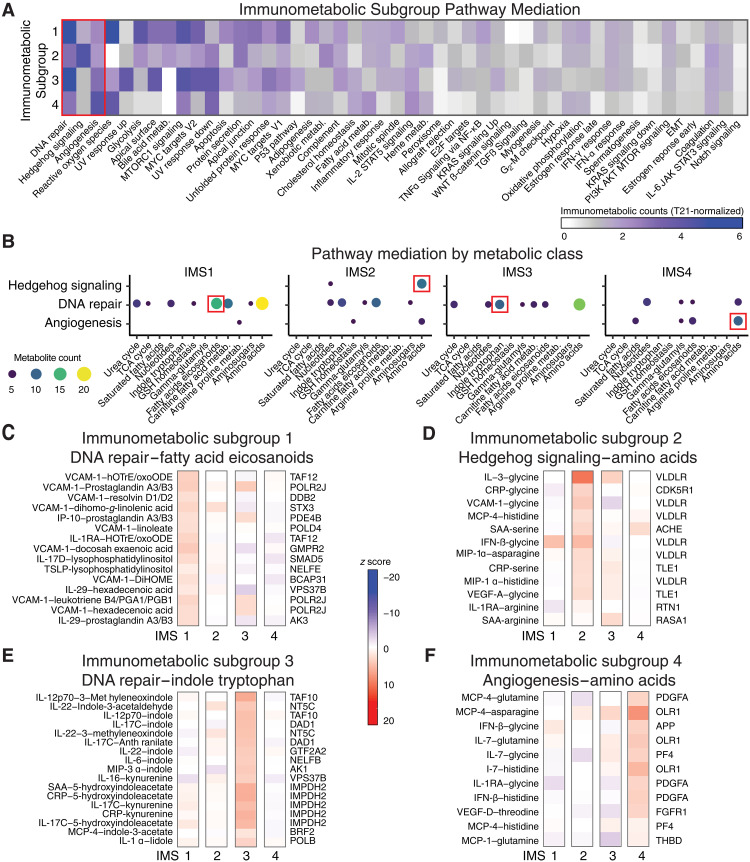
Down syndrome (DS), caused by trisomy 21 (T21), results in immune and metabolic dysregulation. People with DS experience co-occurring conditions at higher rates than the euploid population. However, the interplay between immune and metabolic alterations and the clinical manifestations of DS are poorly understood. Here, we report an integrated analysis of immunometabolic pathways in DS. Using multi-omics data, we infered cytokine-metabolite relationships mediated by specific transcriptional programs. We observed increased mediation of immunometabolic interactions in those with DS compared to euploid controls by genes in interferon response, heme metabolism, and oxidative phosphorylation. Unsupervised clustering of immunometabolic relationships in people with DS revealed subgroups with different frequencies of co-occurring conditions. Across the subgroups, we observed distinct mediation by DNA repair, Hedgehog signaling, and angiogenesis. The molecular stratification associates with the clinical heterogeneity observed in DS, suggesting that integrating multiple omic profiles reveals axes of coordinated dysregulation specific to DS co-occurring conditions.


Figures

Fig. 1.
Fig. 1.. The immunometabolic profile of DS differs from the general population.
(A) Overview of analysis workflow. Whole-blood samples collected from individuals with T21 and D21 karyotypes were used to quantify plasma cytokines and metabolites. Individual-omic profiles were evaluated and an integrated analysis was performed. Identification of gene mediators of cytokine-metabolite relationships was performed, and immunometabolic subgroups were defined. Further analysis was performed on the subgroups. (B) Heatmap of Spearman correlation coefficients between standardized cytokine and metabolite abundances. Clustering with k-means defined four groups. (C) Representative scatterplots of standardized values between cytokines, metabolites, and across molecular assay type. Blue lines represent the lines of best fit between the features; gray areas represent the 95% confidence interval. Spearman correlation statistics are reported. (D) Statistically significant (FDR < 0.1) correlations between cytokines and metabolites, aggregated by metabolite class. The thickness of the edges between nodes represents the absolute value of aggregated correlations coefficients. (E) Overrepresentation enrichment of significant correlations between cytokines and metabolites (FDR < 0.1) annotated to metabolite classes using a Fisher’s exact test. (F) Spearman correlation coefficients between cytokines and metabolites in people with T21 and D21. Points are colored blue if the relationships are only significant (FDR < 0.1) in T21, red if they are only significant in D21, and dark green if they are significant in both T21 and D21 individuals. GM-CSF, granulocyte-macrophage colony-stimulating factor; FDR, false discovery rate; CRP, C-reactive protein; IL-17C, interleukin-17C; VCAM-1, vascular cell adhesion molecule–1; AMP, adenosine 5′-monophosphate; IDP, inosine 5′-diphosphate; SAA, serum amyloid A.
Fig. 2.
Fig. 2.. Cytokines induce gene expression changes that mediate metabolite levels.
(A) Indoleamine 2,3-dioxygenase 1 (IDO1) is the rate-limiting enzyme in the conversion of tryptophan to kynurenine and is induced by IFN-γ signaling. IFN-γ signals through the IFN-γ receptor activating STAT1, which then up-regulates IDO1 via binding to the gamma interferon activation site (GAS). The right panel extends this signaling pathway based on the mediation analysis to include other ISGs. Created using BioRender.com. (B) Scatterplots for IFN-γ–STAT1, kynurenine-STAT1, and IFN-γ–kynurenine. Blue lines represent the lines of best fit between the features. The red line represents the linear fits of the partial correlation coefficient after adjustment for STAT1 expression. Spearman direct correlation (black) and partial correlation (red) statistics are reported. (C) Overview of the mediation analysis algorithm to identify immunometabolic relationships that are conditioned on gene expression. The partial Spearman correlation coefficients between cytokines and metabolites after adjusting for transcript abundances is compared to the direct Spearman correlations between cytokines and metabolites. The percentage changes between the partial and direct correlations over all cytokine-metabolite relationships and gene transcripts are calculated, and then both the cytokine-metabolite and gene axes are z-score normalized. Last, the z scores are combined using Stouffer’s method to combine z scores. (D) Gene mediation rankings for IFN-γ–kynurenine with IFN-γ response genes highlighted in red. (E) Cytokine-metabolite rankings for mediation by STAT1 with cytokine-metabolite relationships enriched for IFN-γ response genes are highlighted in red. FCGR, Fcγ receptor; GBP, guanylate-binding protein; IgG, immunoglobulin G; JAK, Janus kinase; PARP9, poly(ADP-ribose) polymerase.
Fig. 3.
Fig. 3.. Mediation analysis reveals signaling pathways driving cytokine-metabolite relationships in DS.
(A) Gene mediation rankings over all genes for cytokine-metabolite relationships. Genes (x axis) are ordered by aggregate ranking across immunometabolic relationships and separated by pathway annotation. Cytokine-metabolite relationships (y axis) are ordered by the normalized gene set enrichment scores IFN-γ response pathway genes. (B to D) Mediation scores for the immunometabolic relationship most enriched for mediation by (B) IFN-γ response, (C) oxidative phosphorylation, or (D) heme metabolism. (E) Overlap of cytokine-metabolite relationships with significant enrichments for gene mediation in IFN-γ response pathway genes, heme metabolism, and oxidative phosphorylation. The top 10 significant relationships specific to each pathway are listed in the insets. GSEA, gene set enrichment analysis; NES, normalized enrichment score.
Fig. 4.
Fig. 4.. Immunometabolic relationships define clinical subgroups in DS.
(A) Hierarchically clustered differences in mean feature abundance (IMS versus all others) separated by immunometabolic subgroups. Co-occurring conditions were tested for enrichment across subgroups (signed −log10 q values of one-sided Fisher’s exact tests; *FDR < 0.2). (B) Log odds ratios for reported co-occurring conditions in relation to each immunometabolic subgroup. (C) Alluvial plot demonstrating the distribution of individuals across subgroups based on cytokine profiles, metabolite profiles, or immunometabolic profiles. (D to H) Standardized abundances of individual cytokines or metabolites across immunometabolic subgroups and in relationship to individuals with D21 karyotype. TCA, tricarboxylic acid.
Fig. 5.
Fig. 5.. Immunometabolic subgroups reveal differential mediation of cytokine-metabolite relationships.
(A) Number of immunometabolic relationships that were significantly (FDR < 0.05) and positively enriched (NES > 0) for mediation by genes in gene sets across each immunometabolic subgroup (IMS). Counts of enriched gene sets within each IMS were normalized to the counts of enriched gene sets across all individuals with T21. (B) Enrichment of metabolite classes for the cytokine-metabolite relationships mediated by the gene sets that were most differential across IMSs [red box in (A): DNA repair, Hedgehog signaling, and angiogenesis). (C to F) Top gene mediators and their relative strength of mediation (z scores) for cytokine-metabolite relationships within a selected metabolite class for each IMS [red boxes in (B)] are reported. (C) For IMS1, the top genes within DNA repair that mediate fatty acid/eicosaniod cytokine-metabolite relationships are shown. (D) For IMS2, the top genes within Hedgehog signaling that mediate amino acid cytokine-metabolite relationships are shown. (E) For IMS3, the top genes within DNA repair that mediate indole and tryptophan cytokine-metabolite relationships are shown. (F) For IMS4, the top genes within Angiogenesis that mediate amino acid cytokine-metabolite relationships are shown.

References

    1. Mai C. T., Isenburg J. L., Canfield M. A., Meyer R. E., Correa A., Alverson C. J., Lupo P. J., Riehle-Colarusso T., Cho S. J., Aggarwal D., Kirby R. S., National Birth Defects Prevention Network , National population-based estimates for major birth defects, 2010–2014. Birth Defects Res. 111, 1420–1435 (2019). - PMC - PubMed
    1. CDC, Facts about Down Syndrome (CDC, 2020); www.cdc.gov/ncbddd/birthdefects/downsyndrome.html.
    1. Shin M., Besser L. M., Kucik J. E., Lu C., Siffel C., Correa A., Prevalence of Down syndrome among children and adolescents in 10 regions of the United States. Pediatrics 124, 1565–1571 (2009). - PubMed
    1. Bittles A. H., Glasson E. J., Clinical, social, and ethical implications of changing life expectancy in Down syndrome. Dev. Med. Child Neurol. 46, 282–286 (2004). - PubMed
    1. Hartley D., Blumenthal T., Carrillo M., DiPaolo G., Esralew L., Gardiner K., Granholm A.-C., Iqbal K., Krams M., Lemere C., Lott I., Mobley W., Ness S., Nixon R., Potter H., Reeves R., Sabbagh M., Silverman W., Tycko B., Whitten M., Wisniewski T., Down syndrome and Alzheimer’s disease: Common pathways, common goals. Alzheimers Dement. 11, 700–709 (2015). - PMC - PubMed