Observational Study
. 2024 Dec;56(12):2755-2762.
doi: 10.1038/s12276-024-01368-y. Epub 2024 Dec 13.

Single-cell RNA sequencing reveals transcriptional changes in circulating immune cells from patients with severe asthma induced by biologics

Affiliations
Observational Study

Single-cell RNA sequencing reveals transcriptional changes in circulating immune cells from patients with severe asthma induced by biologics

Kyungtaek Park et al. Exp Mol Med. 2024 Dec.

Abstract

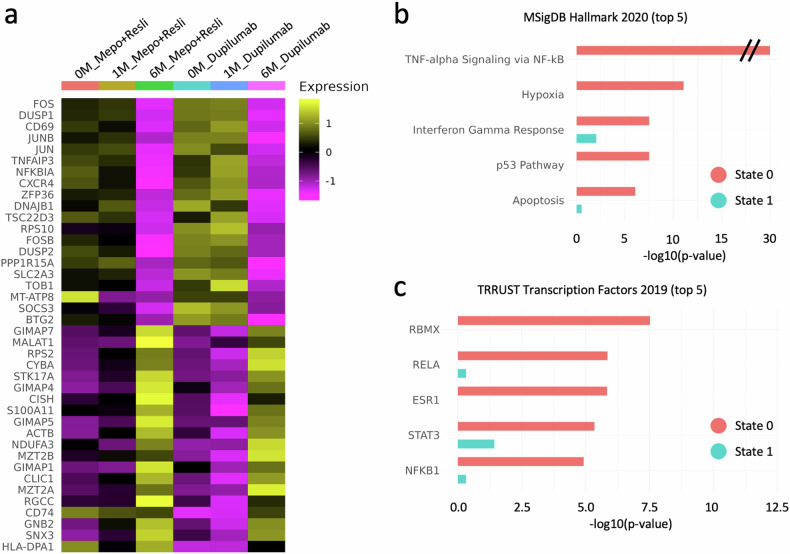
Patients with severe eosinophilic asthma often require systemic medication, including corticosteroids and anti-type 2 (T2) cytokine biologics, to control the disease. While anti-IL5 and anti-IL4Rα antibodies suppress the effects of IL-4, IL-5 and IL-13, the molecular pathways modified by these biologics that are associated with clinical improvement remain unclear. Therefore, we aimed to describe the effects of T2-targeting biologics on the gene expression of blood immune cells. We conducted single-cell RNA sequencing (scRNA-seq) of peripheral blood mononuclear cells (PBMCs) from eight patients with severe eosinophilic asthma treated with mepolizumab, reslizumab, or dupilumab. PBMCs were obtained before the initiation of biologics and at 1- and 6-month timepoints after the initiation of treatment to elucidate treatment-induced changes. During treatment, the proportions of T cells/natural killer (NK) cells, myeloid cells, and B cells did not change. However, the composition of classical monocytes (CMs) changed: IL1B+ CMs were reduced, and S100A+ CMs were increased. The subsets of T cells also changed, and significant downregulation of the NF-κB pathway was observed. The genes related to the NF-κB pathway were suppressed across T/NK, myeloid, and B cells. The transcriptional landscape did not significantly change after the first month of treatment, but marked changes occurred at six-month intervals. In conclusion, regardless of the type of biologics used, suppression of T2-mediated pathways ultimately reduces the expression of genes related to NF-κB signaling in circulating immune cells. Further studies are warranted to identify potential biomarkers related to treatment response and long-term outcomes.Clinical trial registration number: NCT05164939.


Conflict of interest statement

Competing interests: The authors declare no competing interests.

Figures

Fig. 1
Fig. 1. Changes in the transcriptional profiles of blood immune cells at least one month after treatment with biologics.
a Experimental design illustrating the sample preparation for the study. b UMAP plots of all cells classified into T/NK cells, myeloid cells, B cells, or platelets and separated according to treatment duration. c UMAP plots showing the subtypes of myeloid cells (left panel) and their distributions according to treatment duration (right panel). d Line plots displaying the frequencies of myeloid cell subtypes, where the x-axis represents the treatment duration and the y-axis represents the frequency. Each line type represents a patient, and the colors indicate the biologics with which they were treated: mepolizumab/reslizumab or dupilumab. Asterisks denote significant differences between the two treatment durations with an FDR of 0.01. e Dot plots showing the top 5 highly expressed genes in IL-1B+ CMs (first five) and S100A+ CMs (last five) compared with other myeloid cell subtypes.
Fig. 2
Fig. 2. Altered subsets of CD4+ T cells in the blood after six months of treatment with biologics.
a UMAP plots showing the subtypes of CD4+ T cells (left panel) and their distributions according to treatment duration (right panel). b Line plots displaying the subtypes, where the x-axis and y-axis represent the treatment duration and frequency, respectively. The line types and colors correspond to the conditions, and asterisks indicate significant changes between the treatment durations with an FDR of 0.01. S0 and S1 represent States 0 and 1, respectively.
Fig. 3
Fig. 3. Downregulation of genes involved in the NF-κB pathway across all cell types.
a Heatmap displaying the expression levels of DEGs that were significantly different between S0 and S1 CD4+ T cells and categorized by treatment duration and biologic conditions. The top 20 downregulated and upregulated DEGs in CD4+ T S1 cells compared with S0 cells are shown on the y-axis. b Top 5 MSigDB hallmark 2020 pathways and their p values associated with upregulated DEGs in State 0. The y-axis represents the names of the pathways, and the x-axis represents the −log10 of their p values. Each pathway has two bars representing p values calculated for upregulated DEGs in S0 (red) and S1 (turquoise). c The top 5 TRRUST transcription factors and their p values associated with upregulated DEGs in S0 (red). The turquoise bars represent p values of the corresponding pathways associated with upregulated DEGs in State 1.
Fig. 4
Fig. 4. Different effects of biologics on CD4+ T cells according to their mechanisms of action.
a Dimension plots of CD4+ T S1 cells plotted according to subtype (left panel) and biologics type (right panel). On the right panel, the cells associated with mepolizumab/reslizumab and dupilumab are colored red and turquoise, respectively. b Pie charts show the frequencies of the subtypes according to the biologics type. c Dot plots of DEGs included in the MSigDB hallmark 2020 pathways were significantly associated with upregulated DEGs in TCM S1 cells compared with naïve S1 cells (the first five), and vice versa (the last). The colored bars and circles represent the average expression and percent expression of the corresponding genes according to subtype, respectively. d Chord plots of the MHC-II signaling pathway network of the 0/1 M and 6 M groups of the mepolizumab/reslizumab and dupilumab groups. e Chord plots of the CD40 signaling pathway network of the 0/1 M and 6 M groups in patients in the mepolizumab/reslizumab and dupilumab groups. S0 and S1 represent States 0 and 1, respectively.

References

    1. Song, W. J., Lee, J. H., Kang, Y., Joung, W. J. & Chung, K. F. Future risks in patients with severe asthma. Allergy Asthma Immunol. Res.11, 763–778 (2019). - PMC - PubMed
    1. Lee, J. H. et al. Clinical characteristics and disease burden of severe asthma according to oral corticosteroid dependence: real-world assessment from the Korean Severe Asthma Registry (KoSAR). Allergy Asthma Immunol. Res.14, 412–423 (2022). - PMC - PubMed
    1. McGregor, M. C., Krings, J. G., Nair, P. & Castro, M. Role of biologics in asthma. Am. J. Respir. Crit. Care Med.199, 433–445 (2019). - PMC - PubMed
    1. Maglio, A. et al. Severe asthma remissions induced by biologics targeting IL5/IL5r: results from a multicenter real-life study. Int. J. Mol. Sci.24, 2455 (2023). - PMC - PubMed
    1. Salter, B., Lacy, P. & Mukherjee, M. Biologics in asthma: a molecular perspective to precision medicine. Front. Pharm.12, 793409 (2021). - PMC - PubMed

Publication types

MeSH terms

Associated data