. 2024 Dec 11;52(22):14112-14132.
doi: 10.1093/nar/gkae1112.

Optimization of ACE-tRNAs function in translation for suppression of nonsense mutations

Affiliations

Optimization of ACE-tRNAs function in translation for suppression of nonsense mutations

Joseph J Porter et al. Nucleic Acids Res. .

Abstract

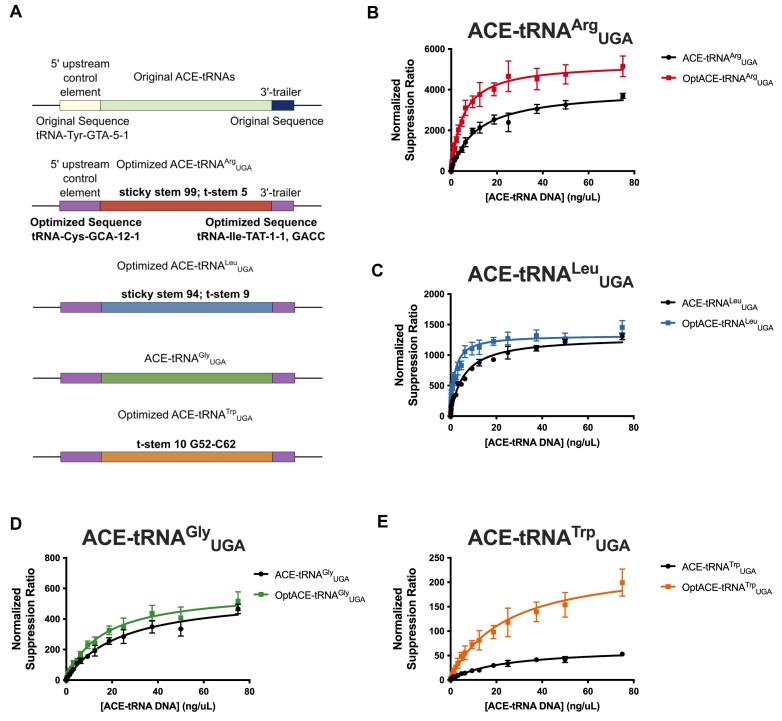
Nonsense suppressor transfer RNAs (tRNAs) or AntiCodon-Edited tRNAs (ACE-tRNAs) have long been envisioned as a therapeutic approach to overcome genetic diseases resulting from the introduction of premature termination codons (PTCs). The ACE-tRNA approach for the rescue of PTCs has been hampered by ineffective delivery through available modalities for gene therapy. Here we have screened a series of ACE-tRNA expression cassette sequence libraries containing >1800 members in an effort to optimize ACE-tRNA function and provide a roadmap for optimization in the future. By optimizing PTC suppression efficiency of ACE-tRNAs, we have decreased the amount of ACE-tRNA required by ∼16-fold for the most common cystic fibrosis-causing PTCs.


Figures

Graphical Abstract
Graphical Abstract
Figure 1.
Figure 1.
Optimization of ACE-tRNA extragenic sequences (A) tRNA gene components and layout of tRNA high-throughput cloning (HTC) site for determining optimal 5′ upstream control element (UCE) sequences for ACE-tRNA nonsense suppressor function. SapI Type IIS restriction enzyme sites flank a negative selection marker (ccdB) for HTC of 5′ UCE sequences cloned via Golden Gate assembly. (B) Heat map representing the results of screening a 386-member library of 55-bp 5′ UCE sequences derived from each unique tRNA gene 5′ UCE in the human genome in 16HBE14o- cells. (C) tRNA gene components and layout of tRNA HTC site for determining optimal 3′ trailer sequences for ACE-tRNA nonsense suppressor function. BbsI Type IIS restriction enzyme sites flank a negative selection marker (ccdB) for HTCS of 3′ trailer sequences cloned via Golden Gate assembly. (D) Heat map representing the results of screening a 256-member library of 4-bp 3′ trailer sequences representing every 4-bp combination of nucleotides following the ACE-tRNA in 16HBE14o- cells. (E) Heat map representing the results of screening a 292-member library of 850-bp 5′ UCE sequences derived from every synthetically accessible, unique, 5′ UCE in the human genome in 16HBE14o- cells. (F) Heat map representing the results of screening a 389-member library of 35-bp 3′ trailer sequences derived from every unique 35-bp 3′ trailer in the human genome in 16HBE14o- cells. All values displayed in these heat maps represent the average of six independent transfections of HTCS library members. The normalized suppression ratio shown here is calculated from the equation [PTC-NanoLuciferase luminescence (+ACE-tRNA)/Firefly luminescence]/[PTC-Nanoluciferase luminescence (no ACE-tRNA)/Firefly luminescence]. Each cell within each heat map represents a single ACE-tRNA cassette sequence, while the columns do not denote any different conditions. In all panels, the scales are referenced to the PTC suppression efficiency of tRNA-Arg-TCT→UCA-3–1 (centered in white), with the tRNA-Tyr-GTA-5–1 55bp 5′ UCE and 4bp 3′ Trailer GTCCTTTTTTT sequences cloned into the individual screening plasmids. Blue indicates increased PTC suppression efficiency and red indicates reduced PTC suppression activity from the original sequence.
Figure 2.
Figure 2.
Optimization of ACE-tRNA intragenic sequences (A) Diagram indicating sites of ‘sticky stem’ mutations for ACE-tRNAArgUGA. The ‘sticky stem’ library is composed of every combination of each of the original base pairs indicated in the tRNA cloverleaf or the C–G or G–C pair indicated to the side. (B) Heat map representing the results of screening the 128-member ACE-tRNAArgUGA ‘sticky stem’ library in 16HBE14o- cells. (C) Diagram indicating sites of ‘sticky stem’ mutations for ACE-tRNALeuUGA. (D) Heat map representing the results of screening the 128-member ACE-tRNAArgUGA ‘sticky stem’ library in 16HBE14o- cells. (E) Diagram indicating the sites of t-stem mutations for the ACE-tRNA t-stem libraries. The t-stem mutations in these libraries were derived from (50) as they represent a range of affinities for EF1a. Heat maps representing the results of screening the 28-member ACE-tRNAArgUGA (F), ACE-tRNALeuUGA (G) and ACE-tRNAGlyUGA (H) t-stem libraries in 16HBE14o- cells. (I) Diagram indicating the sites of mutations for the ACE-tRNAArgUGA anticodon loop library. Each of these sites was mutated to every combination of the 4 nucleotides. (J) Heat map representing the results of screening the 256-member ACE-tRNAArgUGA anticodon loop library in 16HBE14o- cells. (K) Plasmid map of the HTCS vector for determining optimal intragenic sequences for ACE-tRNA nonsense suppressor function. BbsI Type IIS restriction enzyme sites flank a negative selection marker (ccdB) for HTCS of ACE-tRNA sequences cloned via Golden Gate assembly. As previously reported, the PTC-containing NanoLuciferase expression cassette reports on PTC suppression efficiency of the ACE-tRNA(18), while the firefly luciferase expression cassette allows for normalization of the signal to transfection efficiency. This dual luciferase reporter is denoted pNanoRePorter 2.0. All values displayed in these heat maps represent the average of six independent transfections of HTCS library members. The normalized suppression ratio shown here is calculated from the equation [PTC-NanoLuciferase luminescence (+ACE-tRNA)/Firefly luminescence]/[PTC-Nanoluciferase luminescence (no ACE-tRNA)/Firefly luminescence]. Each cell within each heat map represents a single ACE-tRNA cassette sequence, while the columns do not denote any different conditions. The scales are normalized to the PTC suppression activity of the ‘original’ ACE-tRNAArgUGA sequence, presented as white. Blue indicates increased PTC suppression efficiency and red indicates reduced PTC suppression activity from the orginal sequence.
Figure 3.
Figure 3.
Applicability of optimized sequences for all ACE-tRNAs and determination of general sequences for improved ACE-tRNA function (A) Diagram of ACE-tRNA sequences to determine the general applicability of the optimized 5′ UCE, 3′ trailer, and t-stem sequences determined from screens shown in Figures 1 and 2. Each top ACE-tRNA for each isoacceptor/PTC determined previously (18) was tested in concert with either the top 5′ UCE/3′ trailer combination (light blue boxes) or the top t-stem (purple box). (B) Each of the optimized 5′ UCE/3′ trailer sequences was cloned flanking each ACE-tRNA and transfected into HEK293 cells. The data shown here is normalized to the original 5′ UCE/3′ trailer sequences flanking the ACE-tRNA with the dashed line representing the normalized suppression efficiency of the original 5′ UCE/3′ trailer. (C) Each ACE-tRNA containing the top t-stem sequence was cloned and transfected into HEK293 cells. The data shown here is normalized to the original ACE-tRNA t-stem sequence with the dashed line representing the normalized suppression efficiency of the original t-stem. (D, E) Show PWM representing the nonsense suppression efficiency of ACE-tRNAArgUGA paired with each 55-bp 5′ UCE (D) or 35-bp 3′ trailer (E) as either the frequency or probability for each nucleotide. The sequences shown below represent those tested. Each sequence determined from the PWMs was cloned into either the 5′ UCE (F) or 3′ trailer (G) HTCS vector and transfected into HEK293 cells. The data shown here is normalized to the original 5′ UCE or 3′ trailer sequence with the dashed line representing the normalized suppression efficiency of the originals.
Figure 4.
Figure 4.
Determination of the steady-state ACE-tRNA expression using the TTT (A) Diagram of a tRNA gene with ribozyme sequence appended (TTT, purple box). (B) RNA Pol III-dependent transcription of the tRNA gene results in production of the pre-tRNA with appended TTT ribozyme (purple circles display a general ribozyme secondary structure). Following transcription, the ribozyme self-cleaves the RNA backbone (indicated by arrow). (C) After tRNA transcription a number of nucleotides are modified (orange circles) which inhibit reverse transcriptase, preventing direct quantification of ACE-tRNAs via RT-qPCR. Instead, the TTT serves as a proxy for ACE-tRNA expression allowing for direct measurement of relative steady-state expression via RT-qPCR. (D) The indicated 5′ UCE sequences representing those which promote high nonsense suppression function when paired with the ACE-tRNAArgUGA (green bars), medium function (purple bars) or low function (orange bars) were paired with ACE-tRNAArgUGA with appended ribozyme TTT. The constructs indicated were transfected into 16HBE14o- cells and the steady-state concentration of TTT was assayed via RT-qPCR. The TTT was appended to several different optimized ACE-tRNA sequences as indicated in the figure for each of ACE-tRNAArgUGA (E), ACE-tRNALeuUGA (F), ACE-tRNAGlyUGA (G) and ACE-tRNATrpUGA (H). Each data point represents the average of three technical replicates for total RNA isolated from a single transfection with the error bars representing the standard error of the mean.
Figure 5.
Figure 5.
DNA concentration dependence of PTC-protein rescue for optimized ACE-tRNA expression cassettes (A) Diagram displaying the sequence elements included for each of original or optimized ACE-tRNAArgUGA (red), ACE-tRNALeuUGA (blue), ACE-tRNAGlyUGA (green) and ACE-tRNATrpUGA (orange) expression cassettes. In all cases the purple boxes represent the tRNA-Cys-GCA-12–1 optimized 5′ UCE sequence and the tRNA-Ile-TAT-1–1, GACC optimized 3′ trailer sequence. Other optimized sequences are denoted for each ACE-tRNA. (B–E) A range of ACE-tRNA concentrations for both original (black data points) and optimized (colored data points) expression cassettes along with a constant amount of pNanoRePorter 2.0 were transfected into HEK293 cells. The concentration dependence of PTC-Nanoluciferase rescue was determined for each of (B) ACE-tRNAArgUGA (red), (C) ACE-tRNALeuUGA (blue), (D) ACE-tRNAGlyUGA (green) and (E) ACE-tRNATrpUGA (orange). All values here represent the average of six independent transfections. The normalized suppression ratio shown here is calculated from the equation [PTC-NanoLuciferase luminescence (+ACE-tRNA)/Firefly luminescence]/[PTC-Nanoluciferase luminescence (no ACE-tRNA)/Firefly luminescence]. The error bars represent the standard error of the mean.
Figure 6.
Figure 6.
Optimized ACE-tRNA sequences maintain fidelity in translation (A) A pcDNA3.1/Hygro(+) plasmid encoding a sGFP with a UGA PTC at amino acid position 150 and a C-terminal Strep-8xHis-Strep tag was co-transfected with a plasmid containing four copies of either the original or optimized (Opt) ACE-tRNA expression cassette into HEK293 cells. (B) Forty-eight hours following transfection the cells were harvested, lysed via dounce homogenization, a fraction of which was mixed with 6× Laemmli resolving buffer without heating and resolved on a 10–20% gradient SDS-PAGE gel. The GFP fluorescence was imaged in the gel, with total protein being subsequently assayed via silver stain. (C) The remainder of the soluble cell lysate was subjected to purification using Strep-Tactin XT Superflow resin with the eluted sfGFP protein resolved via SDS-PAGE and the protein visualized with Coomassie stain. (D) The sfGFP protein band was excised from the gel and subjected to trypsin digest followed by mass spectrometric determination of the resulting peptide masses. The mass of each peptide which contained the amino acid at site 150 in sfGFP was determined and the amino acid with the most consistent mass for site 150 in that peptide was determined.
Figure 7.
Figure 7.
cDNA concentration dependence of PTC-CFTR rescue for optimized ACE-tRNA expression cassettes (A) CFTR topology diagram displaying the positions of the four most common PTC variants found and the C-terminal nanoluciferase tag (NLuc) used for the in-gel luminescence assay. (B) HEK293T cells were co-transfected with original or optimized (Opt) ACE-tRNAs at the amounts shown, along with PTC-containing CFTR variants with a C-terminal translationally fused Nluc tag, and WT sfGFP as a transfection control. Forty-eight hours after transfection the cells were lysed in RIPA buffer containing protease inhibitor cocktail and resolved on a 10–20% SDS-PAGE gel, a GFP fluorescence image was taken, and then the gel was exposed to Nluc luminescence reagent (furimazine) and a luminescence image acquired with representative images shown here. (C) C-band intensity (fully glycosylated CFTR) was determined by densitometry and then normalized to the GFP fluorescence intensity for that sample to normalize for any differences in transfection efficiency. The values plotted represent the normalized C-band luminescence as compared to CFTR-WT-Nluc expressed as a percent for four independent transfections. Solid colored bars represent the optimized ACE-tRNA cassette, while light colored bars represent the original ACE-tRNA cassette, with bars representing the mean and error bars representing the standard error of the mean. Significance was determined by unpaired two-tailed t-test where *P < 0.05, **P < 0.01, ***P < 0.001, ****P < 0.0001 comparing original and optimized ACE-tRNA cassettes at the same cDNA amount. (D) W1282XUGA CFTR PTC mRNA rescue was assayed by RT-qPCR with varying amounts of ACE-tRNALeuUGA and OptACELeuUGA cDNA transfected. (E) The function of optimized ACE-tRNALeuUGA encoded as two copies in a scAAV vector was determined by transduction of a 16HBE14o- cell line harboring a genomic PiggyBac transposon containing an EF1a-driven UGA-interrupted nanoluciferase (24). (F) PB-NLuc-UGA 16HBE14o- cells were subjected to increasing MOIs (multiplicity of infection; viral genomes per 16HBE14o- cell) of ACE-tRNA-containing scAAV. PTC readthrough was expressed as the ratio of NLuc signal for treated cells versus untreated control with bars representing the mean and error bars representing the standard error of the mean. Significance was determined by unpaired two-tailed t-test where ****P < 0.0001 comparing original and optimized ACE-tRNA cassettes.

Similar articles

Cited by

References

    1. Kurosaki T., Popp M.W., Maquat L.E.. Quality and quantity control of gene expression by nonsense-mediated mRNA decay. Nat. Rev. Mol. Cell Biol. 2019; 20:406–420. - PMC - PubMed
    1. Mort M., Ivanov D., Cooper D.N., Chuzhanova N.A.. A meta-analysis of nonsense mutations causing human genetic disease. Hum. Mutat. 2008; 29:1037–1047. - PubMed
    1. Flanigan K.M., Dunn D.M., von Niederhausern A., Soltanzadeh P., Howard M.T., Sampson J.B., Swoboda K.J., Bromberg M.B., Mendell J.R., Taylor L.E.et al. .. Nonsense mutation-associated Becker muscular dystrophy: interplay between exon definition and splicing regulatory elements within the DMD gene. Hum. Mutat. 2011; 32:299–308. - PMC - PubMed
    1. Mitsios A., Dubis A.M., Moosajee M.. Choroideremia: from genetic and clinical phenotyping to gene therapy and future treatments. Ther. Adv. Ophthalmol. 2018; 10:2515841418817490. - PMC - PubMed
    1. Ballabio A., Gieselmann V.. Lysosomal disorders: from storage to cellular damage. Biochim. Biophys. Acta. 2009; 1793:684–696. - PubMed

LinkOut - more resources