. 2025 Mar;65(3):575-587.
doi: 10.1111/trf.18101. Epub 2024 Dec 14.

Enhanced oxygen availability and preserved aggregative function in platelet concentrates stored at reduced platelet concentration

Affiliations

Enhanced oxygen availability and preserved aggregative function in platelet concentrates stored at reduced platelet concentration

Jamie Nash et al. Transfusion. 2025 Mar.

Abstract

Background: Storage of platelets as platelet concentrates for transfusion is limited to 7 days in the United Kingdom due to deleterious effects on platelet quality and function that occur over time. Oxygen (O2) availability and sufficient gaseous exchange are known to be essential in maintaining the viability and function of platelets stored for transfusion. Despite this, there is a paucity of studies undertaking direct measures of O2 and optimization of conditions throughout storage. We address this and modulate the storage conditions to improve platelet quality and function.

Study design and methods: Electron paramagnetic resonance oximetry was implemented to directly measure the [O2] experienced by stored platelet concentrates and the O2 consumption rate under standard blood banking conditions. From these direct measures the mathematical modeling was then applied to predict the main parameters contributing to effective O2 distribution throughout the unit.

Results: This study demonstrates reducing the storage [O2] to reflect near physiological levels significantly alters O2 distribution within the unit and negatively impacts platelet functionality and quality, and therefore is not a viable storage option.

Discussion: We show the reduction of platelet concentration within a unit improves O2 availability and pH, promotes a more uniform distribution of O2 throughout prolonged storage, and maintains platelet agonist-induced aggregation comparable to 100% platelet concentration. This may be a viable option and could potentially lead to reduced donor demand.

Keywords: blood component preparations; platelet transfusion; transfusion practices (adult).


Conflict of interest statement

The authors have disclosed no conflicts of interest.

Figures

FIGURE 1
FIGURE 1
Diagram to reflect the conceptual basis of the O2 modeling. Gray layer = the plastic film of the bag, dx = 0.035 cm is the film thickness, s = 1 cm2 is the surface area, d = 0.53 cm is half the width of the platelet concentrate unit.
FIGURE 2
FIGURE 2
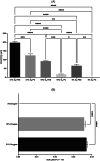
The effect of a reduced external [O2] on direct [O2] and oxygen consumption rate (OCR) in platelet concentrates (PCs). (A) Direct [O2] within PC units stored on day 2 at different external [O2]. (B) OCR under corresponding conditions. Error bars denote SEM. Significance was assessed by one‐way ANOVA followed by a Tukey's test. Graphs denoted as follows: ns = no significance, * = p < .05, ** = p < .01, *** = p < .001, **** = p < .0001, n = 3 (n = 6 control).
FIGURE 3
FIGURE 3
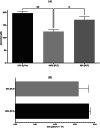
The effect of a reduced [PLT] on direct O2 and oxygen consumption rate (OCR) in platelet concentrates (PCs). (A) Direct [O2] measurement within PC units on day 2 storage at 100% and 50% [PLT]. (B) OCR at 100% and 50% [PLT], when normalized for PLT number. Error bars denote SEM. Significance was assessed by one‐way ANOVA followed by a Tukey's test (A) or a paired T test (B). Graphs denoted as follows: * = p < .05, ** = p < .01, n = 4.
FIGURE 4
FIGURE 4
Modeled O2 distribution within platelet concentrate (PC) units incubated at different external [O2]. Modeling was undertaken using Equation (3). The X axis describes the distance from the bag midpoint, with 0 representing the bag center, and 0.53 representing the bag surface. The Y axis shows the oxygen concentration. The part figure (A) compares the O2 distribution for 100% [PLT] stored at 21%, 10%, and 5% external [O2], and 50% [PLT] stored at 21% [O2]. The part figure (B) is expanded Y axis showing the O2 distribution for 100% [PLT] at 21% [O2], (C) shows the O2 distribution for 50% [PLT] stored at 21% [O2], (D) shows the O2 distribution for 10% [O2] with 100% [PLT], and (E) shows the O2 distribution for 5% [O2] with 100% [PLT]. The curve highlighted in red, or orange correspond to the predicted internal O2 distribution for PCs stored at 100% and 50% [PLT], respectively, stored at an external O2 of 21% [O2] (panels B and C), the blue curve represents the internal O2 distribution predicted at an external [O2] of 10% (panel D) and the green curve represents the internal O2 distribution predicted with the external [O2] at 5% (panel E). The dashed lines denote the experimental average [O2] measured by electron paramagnetic resonance at each condition. [Color figure can be viewed at wileyonlinelibrary.com]
FIGURE 5
FIGURE 5
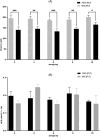
The effect of a reduced [PLT] on direct O2 and oxygen consumption rate (OCR) in platelet concentrates (PCs) over 10 days of storage. (A) Direct [O2] measurement within PC units at 100% and 50% [PLT]. (B) OCR at 100% and 50 [PLT], when normalized for platelet number. Error bars denote SEM. Significance was assessed by two‐way ANOVA following by a Bonferroni test and graphs are denoted as follows: * = p < .05, ** = p < .01, *** = p < .001, n = 4.
FIGURE 6
FIGURE 6
Platelet concentrate (PC) function and quality control measures over 10 days of storage. (A) Platelet (PLT) aggregation responses to TRAP‐6. (B) PLT aggregation responses to Ristocetin. (C) pH of PCs. Error bars denote SEM. Significance was assessed by two‐way ANOVA following by a Bonferroni test and graphs are denoted as follows: * = p < .05, ** = p < .01, *** = p < .001, **** = p < .0001. n = 3 (n = 6 for control).
FIGURE 7
FIGURE 7
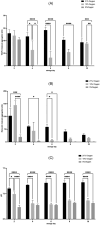
Platelet concentrate (PC) function and quality control measures over 10 days storage when reducing [PLT]. (A) Platelet (PLT) aggregation responses to TRAP‐6. (B) PLT aggregation responses to Ristocetin. (C) pH of PC units over time at 100% [PLT] and 50% [PLT]. Error bars denote SEM. Significance was assessed by two‐way ANOVA followed by a Bonferroni test and denoted as follows: * = p < .05, ** = p < .01, *** = p < .001, **** = p < .0001, n = 4.

Similar articles

References

    1. Murphy S, Gardner FH. Platelet storage at 22°C: role of gas transport across plastic containers in maintenance of viability. Blood. 1975;46(2):209–218. - PubMed
    1. Murphy S, Gardner FH. Platelet storage at 22°C; metabolic, morphologic, and functional studies. J Clin Invest. 1971;50(2):370–377. - PMC - PubMed
    1. Kilkson H, Holme S, Murphy S. Platelet metabolism during storage of platelet concentrates at 22°C. Blood. 1984;64(2):406–414. - PubMed
    1. Wallvik J, Akerblom O. Platelet concentrates stored at 22°C need oxygen. The significance of plastics in platelet preservation. Vox Sang. 1983;45(4):303–311. - PubMed
    1. Murphy S, Kahn RA, Holme S, Phillips GL, Sherwood W, Davisson W, et al. Improved storage of platelets for transfusion in a new container. Blood. 1982;60(1):194–200. - PubMed

LinkOut - more resources