. 2024 Dec 23;197(1):kiae632.
doi: 10.1093/plphys/kiae632.

All together now: A mixed-planting experiment reveals adaptive drought tolerance in seedlings of 10 Eucalyptus species

Affiliations

All together now: A mixed-planting experiment reveals adaptive drought tolerance in seedlings of 10 Eucalyptus species

Chris J Blackman et al. Plant Physiol. .

Abstract

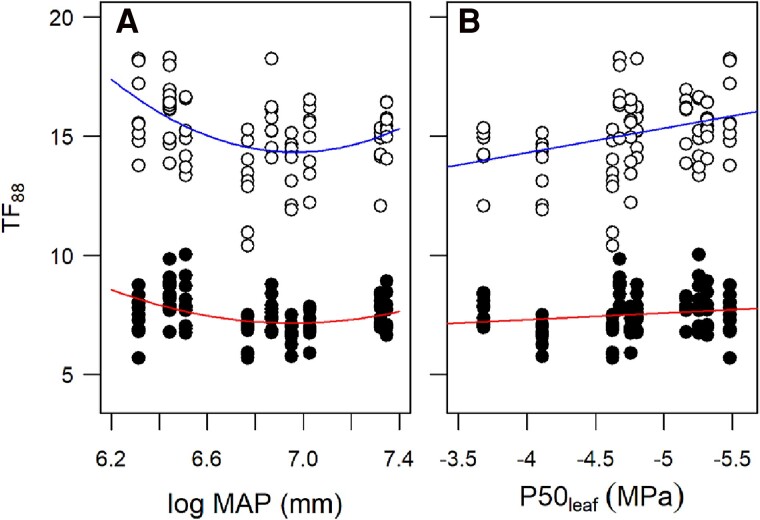
The negative impacts of drought on plant productivity and survival in natural and crop systems are increasing with global heating, yet our capacity to identify species capable of surviving drought remains limited. Here, we tested the use of a mixed-planting approach for assessing differences in seedling drought tolerance. To homogenize dehydration rates, we grew seedlings of 10 species of Eucalyptus together in trays where roots of all individuals were overlapping in a common loam soil. These seedling combinations were dried down under cool and warm temperature conditions, and seedling responses were quantified from measurements of chlorophyll fluorescence (Fv/Fm). The day of drought (T) associated with an 88% decline in Fv/Fm (TF88) varied significantly among species and was unrelated to seedling size. No significant differences in water potentials were detected among seedlings dehydrated under warm conditions prior to leaf wilt. The rank-order of species TF88 was consistent under both temperature treatments. Under cool conditions, seedling TF88 increased with decreasing cavitation vulnerability measured on adult foliage. Under both treatments, a quadratic function best fit the relationship between seedling TF88 and sampling site mean annual precipitation. These results provide evidence for adaptive selection of seedling drought tolerance. Our findings highlight the use of mixed-planting experiments for comparing seedling drought tolerance with applications for improving plant breeding and conservation outcomes.


Conflict of interest statement

Conflict of interest statement. None declared.

Figures

Figure 1.
Figure 1.
The response of Fv/Fm in seedlings of each species during the dry-down to death treatments. A) Shows the Fv/Fm response under warm treatment conditions. B) Shows the Fv/Fm response under cool treatment conditions. Each curve (and associated 95% CI) represents a Weibull function fitted to the pooled data for each species across trays within each treatment (see Supplementary Figs. S1 to S3 for curves fitted to individual seedlings). Dotted and dashed vertical lines indicate the day of drought associated with the visual signs of leaf wilt and shoot meristem death, respectively, averaged across seedlings of all species within each treatment.
Figure 2.
Figure 2.
Differences among species in the time for seedling Fv/Fm to decline by 88% (TF88) under drought. A) Shows species differences under warm conditions. B) Shows species differences under cool conditions. Data points (solid circles) and whiskers represent species means and 95% CIs, respectively. Differences in TF88 between species in each experiment were tested using Anova. Significant differences (P ≤ 0.05) between species are denoted by different letters.
Figure 3.
Figure 3.
Consistency in the rank-order of species seedling drought tolerance as measured by TF88 under warm and cool temperature treatments. Spearman's rank correlation of ρ = 0.64. Level of significance: *P ≤ 0.05.
Figure 4.
Figure 4.
Changes in predawn plant water potential in response to soil drying measured at 4 time points in seedlings of 10 Eucalyptus species planted in each of 2 mixed-planting trays under warm temperature conditions. Individual colored lines represent species mean seedling responses across both trays. Box plots show the spread of species mean water potential values recorded on each measurement day, with each boxplot consisting of the center line, median; upper and lower quartiles; whiskers, 1.5 × inter-quartile range; and points, outliers. Differences in species mean predawn water potentials (n = 4) were tested using Anova at measurement dates: Day 3, 5, and 7. Levels of significance are indicated: ns = P > 0.05; ***P < 0.001. Vertical lines indicate the average (solid line ± Sd [dashed lines]) day of first leaf wilt recorded across individuals.
Figure 5.
Figure 5.
Relationships across species between seedling TF88 and climate and between seedling TF88 and adult cavitation vulnerability. A) Shows the relationship between TF88 and the log of MAP at each species sampling site. B) Shows the relationship between TF88 and species cavitation vulnerability (P50leaf) measured previously in adult foliage (Hartill et al. 2023). The best-fit quadratic functions in A) are shown for data from the warm (lower line; y = 125.7 + log[MAP] × −34.1 + log[MAP]2 × 2.4) and cool (upper line; y = 267.6 + log[MAP] × −72.7 + log(MAP)2 × 5.2) treatments. The best-fit linear functions in B) are shown for data from the warm (lower line; y = 6.1 + |P50| × 0.28) and cool (upper line; y = 10.3 + |P50| × 1.03) treatments (see P-values for all parameters in each model in Supplementary Table S2). In each plot, warm (filled circles) and cool (nonfilled circles) treatment conditions are indicated.
Figure 6.
Figure 6.
The progression of drought stress in seedlings growing together in a single tray dried-down to death over 10 d under warm treatment conditions. At day of drought (DOD) 1, all seedlings are hydrated; at DOD 5, most seedlings show signs of leaf wilt; and at DOD 10, all seedlings have reached Fv/Fm values <0.05 (representing a >88% decline from maximum) and have succumbed to water stress.

References

    1. Allen CD, Breshears DD, Mcdowell NG. On underestimation of global vulnerability to tree mortality and forest die-off from hotter drought in the Anthropocene. Ecosphere. 2015:6(8):1–55. 10.1890/ES15-00203.1 - DOI
    1. Ammitzboll H, Vaillancourt RE, Potts BM, Harrison PA, Brodribb T, Sussmilch FC, Freeman JS. Independent genetic control of drought resistance, recovery, and growth of Eucalyptus globulus seedlings. Plant Cell Environ. 2020:43(1):103–115. 10.1111/pce.13649 - DOI - PubMed
    1. Aspinwall MJ, Blackman CJ, Maier C, Tjoelker MG, Rymer PD, Creek D, Chieppa J, Griffin-Nolan RJ, Tissue DT. Aridity drives clinal patterns in leaf traits and responsiveness to precipitation in a broadly distributed Australian tree species. Plant Environ Interact. 2023:4(2):70–85. 10.1002/pei3.10102 - DOI - PMC - PubMed
    1. Atefi A, Ge Y, Pitla S, Schnable J. Robotic technologies for high-throughput plant phenotyping: contemporary reviews and future perspectives. Front Plant Sci. 2021:12:611940. 10.3389/fpls.2021.611940 - DOI - PMC - PubMed
    1. Baltzer JL, Davies SJ, Bunyavejchewin S, Noor NSM. The role of desiccation tolerance in determining tree species distributions along the Malay-Thai Peninsula. Funct Ecol. 2008:22(2):221–231. 10.1111/j.1365-2435.2007.01374.x - DOI

LinkOut - more resources