. 2024 Dec 13;38(24):e70247.
doi: 10.1096/fj.202400446R.

Excess shed mesothelin disrupts pancreatic cancer cell clustering to impair peritoneal colonization

Affiliations

Excess shed mesothelin disrupts pancreatic cancer cell clustering to impair peritoneal colonization

Theressa Ewa et al. FASEB J. .

Abstract

Peritoneum is the second most common site of metastasis in patients with pancreatic ductal adenocarcinoma (PDAC). Peritoneal colonization is impaired in PDAC cells with knockout (KO) of the cancer surface antigen mesothelin (MSLN) or by introducing Y318A mutation in MSLN to prevent binding to mucin-16 (MUC-16). MSLN has a membrane-bound form but is also shed to release soluble MSLN (sMSLN). Their individual roles in peritoneal metastasis are unknown. Here, a C-terminal truncated MSLN mutant (∆591) incapable of cell membrane insertion but proficient in secretion was engineered. Expression of ∆591 MSLN failed to rescue peritoneal metastasis in MSLN KO cells and inhibited peritoneal colonization when overexpressed in WT PDAC cells. Exposing PDAC cells to conditioned medium (CM) containing excess sMSLN impaired cancer cell clustering in vitro and in peritoneal fluid in vivo, while CM containing only Y318A sMSLN did not. These data demonstrate that interaction of membrane-bound MSLN with MUC-16 promotes cell clustering that is critical for efficient peritoneal metastasis. However, peritoneal colonization by MSLN KO cells was rescued by expression of ∆591 mutant MSLN bearing Y318A mutation, suggesting that sMSLN also has a MUC-16-independent role in peritoneal spread. Alterations in inflammatory signaling pathways occurred following KO cell exposure to CM containing sMSLN, and CM from cancer cells with intact peritoneal metastasis provoked increased KO cell secretion of IL-1α. While excess sMSLN inhibits cell clustering and peritoneal colonization, sMSLN may also promote PDAC peritoneal metastasis independent of MUC-16.

Keywords: IL‐1α; cell clustering; mesothelin; pancreatic cancer; peritoneal metastasis.


Figures

FIGURE 1
FIGURE 1
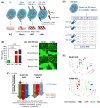
Experimental design. (A) Schema depicting experimental plan for testing pro‐tumorigenicity of protein products of MSLN gene. Red bar shows MPF protein, which is expected to be secreted. Blue bar shows MSLN protein. Lighter blue indicates residues C‐terminal to the GPI anchor which is required for membrane‐bound MSLN. Constructs missing the GPI‐anchor are expected to be secreted‐only. Darker blue residues indicate those which may contribute to sMSLN. Y318A point mutation ablates MSLN interaction with MUC‐16. (B) Schematic showing each MSLN variant complemented into KO cells.
FIGURE 2
FIGURE 2
Assessing the activity of MPF versus membrane‐bound mature MSLN. KLM1 MSLN KO cells were stably transfected with empty vector (KO+vec), MSLNf, or MPFf. (A) KLM1 derivative cells were assessed for membrane‐bound MSLN expression by flow cytometry. (B) Growth rate of the cell lines on tissue culture plastic was measured. There was no significant difference between the groups. (C–F) Cell lines were injected IP into nude mice and allowed to grow for ~6 weeks. (C) Total burden of peritoneal tumor was measured, ***p < .001. (D, E) MSLN and MPF concentration in tumor lysate was measured by ELISA assay. (F) Tumor burden of co‐injected +MSLNf and +MPFf cells was assessed, *p < .05; ns, not significant.
FIGURE 3
FIGURE 3
Assessing the activity of secreted‐only MSLN in KO cells. (A) Schema depicting truncation mutant (Δ591) to remove the GPI anchoring site and prevent membrane association of mature MSLN. KLM1 MSLN KO cells were stably transduced with WT and Y318A (Mu) Δ591 expression vectors and single cell clones were isolated. (B) Immunoblot of Δ591 clones to assess for MSLN expression. (C) Conditioned medium of Δ591 clones plated at equal density was assayed for MSLN concentration by ELISA. (D) Representative experiment showing growth rate of the KO+ Δ591 cell lines on tissue culture plastic as measured by counting cell number in triplicate wells. (E) Cells were suspended in soft agar and colonies were counted after ~3 weeks. Figure depicts raw data of triplicate wells (marker) in each experiment (bar). **p < .01 or ***p < .001 indicate statistically significant difference as compared to parent for at least 2 of 3 experiments (in same direction of change). (F, G) Cell lines were injected IP into nude mice and allowed to grow for ~6 weeks. (F) Tumors were lysed and MSLN expression was assayed by immunoblot. (G) Total burden of peritoneal tumor dissected from the mouse abdominal cavity, *p < .05. Each point represents one animal. Results were confirmed by repeat using other Δ591WT and Δ591Mu clones. (H) MUC‐16 surface expression was assessed by flow cytometry. Left—Representative tracing. Right—Summary of geometric means in relation to Parent over multiple experiments.
FIGURE 4
FIGURE 4
Overexpression of sMSLN inhibits the pro‐tumorigenic activity of cells expressing membrane‐bound MSLN. (A) Proposed model showing how sMSLN might block cell–cell association by interfering with interactions between MUC‐16 and membrane‐bound MSLN. (B–H) KLM1 cells were stably transduced with Δ591 MSLN expression vectors and pooled cells were used for experiments. (B) Expression of MSLN in conditioned medium as detected by ELISA. (C) Representative experiment showing growth rate of the cell lines on tissue culture plastic as measured by counting cell number in triplicate wells for each time point. No significant difference in growth was observed. (D–F) Cell lines were injected IP into nude mice and allowed to grow for ~6 weeks, *p < .05; ***p < .001; ****p < .0001; ns, not significant. (D) Total burden of peritoneal tumor dissected from the mouse abdominal cavity. Each point represents one animal. (E) Tumors were lysed and MSLN expression was assayed by immunoblot. Each lane is lysate from one mouse tumor. (F) Serum MSLN expression was assayed by ELISA. (G, H) Indicated cells were tagged with CellTracker dye and visualized by fluorescence microscopy. Representative images of multiple replicates with four to eight fields imaged per replicate. (G) Labeled cells were plated at equal density onto low adherence plates for 24 h before visualization. (H) Labeled cells were injected IP into nude mice. Mice were euthanized 4 h later and peritoneal lavage fluid was collected for visualization.
FIGURE 5
FIGURE 5
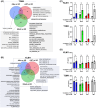
Excess of sMSLN prevents cell clustering. (A) Schema showing method used to produce MSLN‐containing CM. Mock cells underwent transient transfection with Cas9 vector like MSLN KO cells, but no gRNA was included, so they retain endogenous MSLN expression (MSLN+). Transduction of KO cells with full‐length MSLN WT or Y318A expression construct produces the KO+WT and KO+Mu cell lines which overexpress MSLN (MSLN++). (B) ELISA to assess MSLN concentration of CM from equal numbers of cells plated for each type. (C) Cells were tagged with CellTracker dye then plated at equal density onto low adherence plates for 24 h before visualization by fluorescence microscopy. Representative images of multiple replicates with 4–8 fields imaged per replicate. (D) Schema for treatment of KLM1 and T3M4 KO cells with CM prior to RNA harvest. (E) PCA plots following RNA deep‐sequencing of CM‐treated KO cells. (F) Quantitation and directionality of GSEA pathway changes in KO cells treated with KO CM (negative control) as compared to MSLN‐containing CMs.
FIGURE 6
FIGURE 6
Soluble MSLN exposure results in release of IL‐1α. (A, B) Venn diagrams outlining GSEA pathway changes that occur when MSLN KO cells are exposed to sMSLN‐containing CM as compared with exposure to CM from MSLN KO cells. Pathways with statistically significant differential expression are listed. Those in bold were significantly changed in both KLM1 and T3M4. (C, D) KO cells were treated with stock CM isolated from KO, Mock, +WT or +Mu cells for 0 or 4 h, **p < .01; ****p < .0001; ns, not significant. The concentration of IL‐1α (C) or LIF (D) in CM was then measured by ELISA.

Similar articles

References

    1. Siegel RL, Miller KD, Wagle NS, Jemal A. Cancer statistics, 2023. CA Cancer J Clin. 2023;73:17‐48. - PubMed
    1. Avula LR, Hagerty B, Alewine C. Molecular mediators of peritoneal metastasis in pancreatic cancer. Cancer Metastasis Rev. 2020;39:1223‐1243. - PMC - PubMed
    1. Hassan R, Thomas A, Alewine C, Le DT, Jaffee EM, Pastan I. Mesothelin immunotherapy for cancer: ready for prime time? J Clin Oncol. 2016;34:4171‐4179. - PMC - PubMed
    1. Winter JM, Tang LH, Klimstra DS, et al. A novel survival‐based tissue microarray of pancreatic cancer validates MUC1 and mesothelin as biomarkers. PLoS ONE. 2012;7:e40157. - PMC - PubMed
    1. Einama T, Kamachi H, Nishihara H, et al. Co‐expression of mesothelin and CA125 correlates with unfavorable patient outcome in pancreatic ductal adenocarcinoma. Pancreas. 2011;40:1276‐1282. - PubMed

MeSH terms