. 2025 Jan:111:105503.
doi: 10.1016/j.ebiom.2024.105503. Epub 2024 Dec 13.

OPG promotes lung metastasis by reducing CXCL10 production of monocyte-derived macrophages and decreasing NK cell recruitment

Affiliations

OPG promotes lung metastasis by reducing CXCL10 production of monocyte-derived macrophages and decreasing NK cell recruitment

Haitian Hu et al. EBioMedicine. 2025 Jan.

Abstract

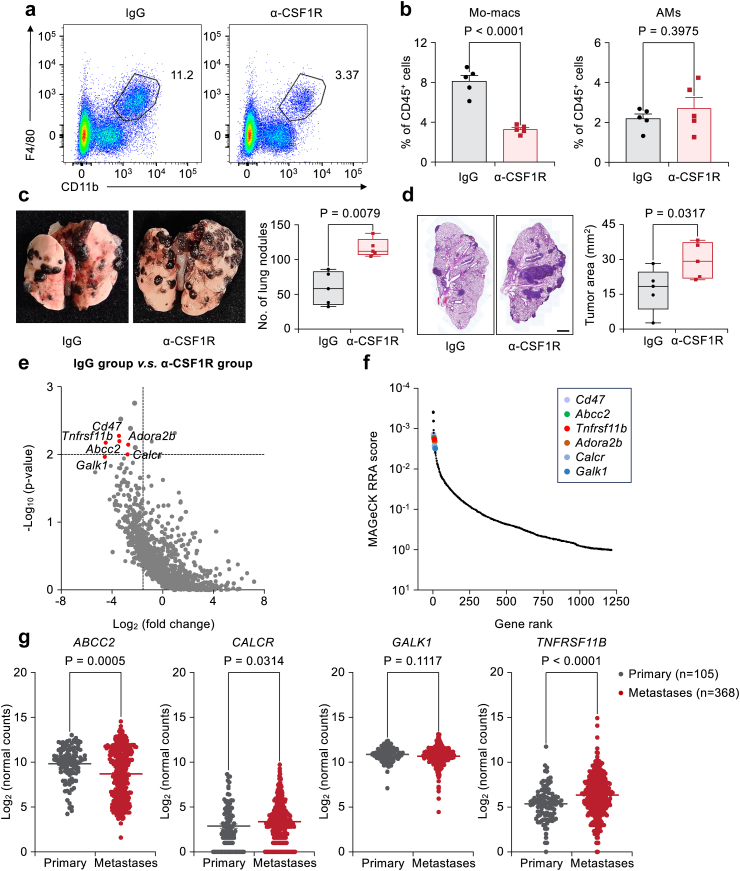
Background: Lung metastasis is a critical and often fatal progression in cancer patients, with monocyte-derived macrophages (Mo-macs) playing multifaceted roles in this process. Despite the recognized importance of Mac-macs, most studies focus on these cells themselves, while the precise mechanisms through which tumor cells manipulate Mo-macs to promote metastasis remain poorly understood.

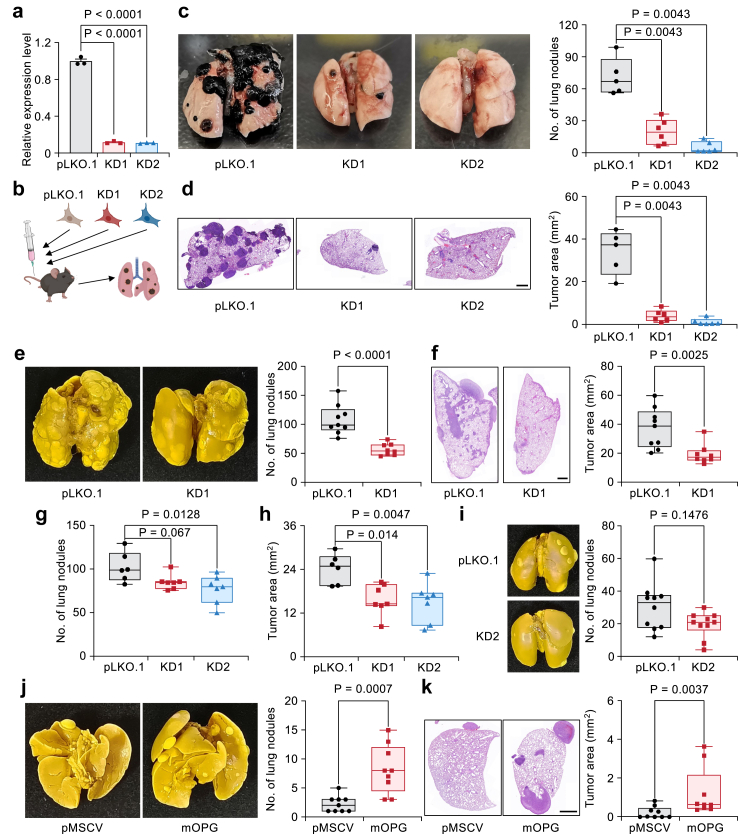
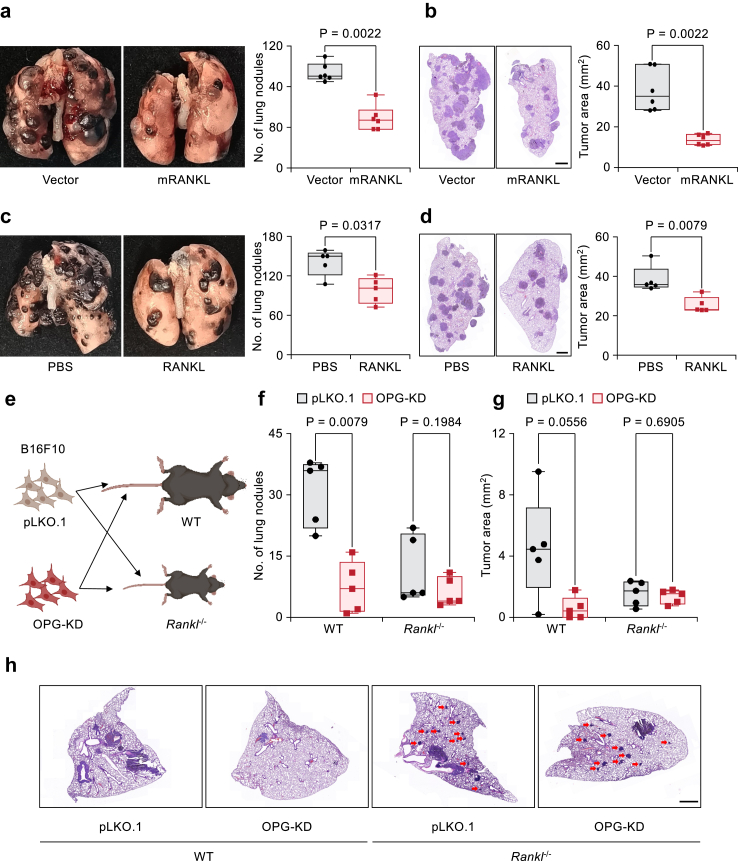
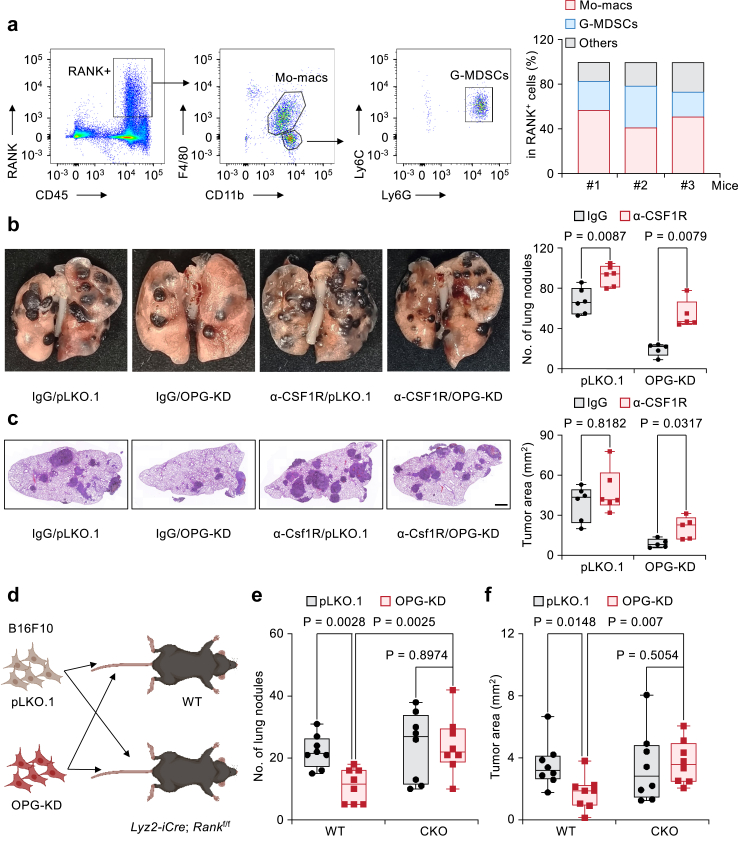
Methods: We developed an in vivo CRISPR screening system to identify genes involved in macrophage-dependent metastasis by depleting Mo-macs. Osteoprotegerin (OPG) was identified as the factor significantly enhances lung metastasis. We validated its function in lung metastasis by modulating the expression of OPG in an array of cell lines and performed spontaneous and experimental lung metastasis assays. Genetically engineered mice were utilized to confirm the role of RANKL-RANK signaling in OPG-mediated metastasis. Additionally, we employed different neutralizing antibodies to elucidate the roles of Mo-macs and NK cells and inhibitor to clarify the role of CXCL10 signaling.

Findings: Employing in vivo screening techniques, we elucidate the role of OPG, a protein secreted by cancer cells, in driving lung metastasis, contingent upon regulating Mo-mac activity. OPG blocks the signaling cascade between receptor activator of nuclear factor kappa-B ligand (RANKL) and its receptor RANK on Mo-macs, thereby hindering Mo-macs from secreting CXCL10, a chemokine crucial for recruiting natural killer (NK) cells that help control lung metastasis. Moreover, we observe an enrichment of OPG amplifications in metastatic cancer patients, and elevated levels of OPG expression in lung metastatic sites compared to paired primary breast cancer samples.

Interpretation: Our work revealed that OPG works as a lung metastasis promoting factor by blocking the RANKL-RANK-CXCL10 axis to drive the paucity of NK cells, which could be a therapeutic target for lung metastatic cancer patients.

Funding: The full list of funding supporting this study can be found in the Acknowledgements section.

Keywords: CXCL10; Lung metastasis; Macrophages; NK cells; OPG; RANKL.


Conflict of interest statement

Declaration of interests The authors declare no conflicts of interest in this study.

Figures

Fig. 1
Fig. 1
Genetic screening identified OPG as a lung metastasis promoter through Mo-macs. (a, b) Flow cytometry graphs (a) and quantification (b) showing the percentages of CD11b+F4/80+ Mo-macs (b, left) and AMs (b, right) among CD45+ immune cells in the lung after antibody injection. n = 5 mice per group. The data is presented as the mean ± s.e.m., Student's two-sided unpaired t test. (c, d) Female B6 mice were first treated with either IgG or α-CSF1R antibody and continued until the experimental endpoint. Cells were then tail vein injected with 2 × 10⁵ B16F10 cells. The whole-lung images show the lung surface nodules (c), and H&E staining (d) shows the tumor areas. n = 5 mice per group. Scale bar: 1 mm. Boxplots showed the minimum, first quartile, median, third quartile, and maximum of the data points. P values were obtained by Mann–Whitney U test. (e) Genes encoded by corresponding depleted sgRNAs in the IgG v.s. α-CSF1R group from the screening were identified. Candidate genes were plotted based on the mean log2 (fold change) of sgRNA counts, and p values were computed using MAGeCK. A horizontal line was drawn at a p value of 0.01, and a vertical line represented a fold change of 3. (f) MAGeCK RRA ranking of the top depleted genes compared with the IgG group v.s. the α-CSF1R group from the screening. (g) Candidate genes (ABCC2, CALCR, GALK1 andTNFRSF11B) mRNA levels in primary SKCM tumors and metastases in the TCGA cohort. The lings representing the mean values of all candidate genes. P values were calculated by Mann–Whitney U test.
Fig. 2
Fig. 2
OPG promotes lung metastasis. (a) Relative expression levels of Tnfrsf11b mRNA in B16F10 cells by shRNAs (n = 3 per group); the data is presented as the mean ± s.e.m., one-way ANOVA followed by Dunnett's multiple comparisons test. (b) Cartoon showing that OPG-KD cells were injected into mice through the tail vein to generate lung metastasis. (c, d) Analysis of lung metastasis in OPG-KD B16F10 cells. Whole-lung images showing lung surface nodules (c), and H&E staining (d) showing the metastatic tumor areas. n = 5–6 mice per group. (e, f) Pulmonary surface nodules (e) and tumor areas (f) of Yumm1.7 cells with OPG-KD. n = 9 (pLKO.1) or 8 (OPG-KD1) mice per group. (g, h) 4T1 cells with OPG-KD were injected into BALB/c mice through the tail vein. (g) Statistical analysis of lung surface nodules. (h) Pulmonary metastatic tumor area. n = 6 (pLKO.1) or 7 (KD1 and KD2) mice per group. (i) Representative whole-lung images and statistics of spontaneous lung metastasis of 4T1 cells with OPG-KD. n = 10 mice per group. (j, k) Whole-lung images (j) and H&E staining images (k) showing the representative lung metastasis samples generated by 4T07 cells overexpressing OPG. n = 9 mice per group. All H&E staining scale bars: 1 mm. (ck) Statistics are shown by boxplots, including the minimum, first quartile, median, third quartile, and maximum of the data points. Mann–Whitney U test was used for statistical analysis.
Fig. 3
Fig. 3
Clinical correlation of OPG amplification with lung metastasis in cancer patients. (a, b) The types and proportions of mutations in TNFRSF11B in the metastatic patient cohorts. The datasets and pictures (a) were obtained from cBioPortal. Pie charts (b) showed the statistics of mutations in the metastatic melanoma patient cohort, metastatic breast cancer patient cohort, and another metastatic breast cancer patient cohort from MBCProject. (c, d) Kaplan–Meier analysis showing overall survival (c) and relapse-free survival (d) of patients with breast cancer in the METABRIC dataset stratified into those with TNFRSF11B amplification (red line) and those with WT TNFRSF11B (gray line). P-values are obtained from log-rank test. (e) The mRNA expression level of TNFRSF11B in lung metastases compared with that in matched primary breast tumors from the human breast cancer AURORA cohort. n = 6. Wilcoxon matched-pairs signed-rank test. (f) The mRNA expression level of TNFRSF11B in lung metastases compared with that in matched primary breast tumors from the RAP cancer patient cohort. n = 8. Wilcoxon matched-pairs signed-rank test.
Fig. 4
Fig. 4
TGF-β increases OPG expression to promote lung metastasis. (a) IHC staining showed that OPG was expressed only within the metastatic colonies in the lungs of mice with B16F10 tumors. Scale bar: 200 μm. (b) The mRNA expression of Tnfrsf11b in the metastases compared to that in the parental cell line B16F10. n = 3 (cell line) or 4 (metastases) per group. The data is presented as the mean ± s.e.m., Student's two-sided unpaired t test was used for statistical analysis. (c) mRNA analyses showing the expression of OPG in the different cell lines after stimulation with TGF-β (5 ng/mL). n = 3 per group. The data is presented as the mean ± s.e.m., Student's two-sided unpaired t test was used. (d) Genes encoded by corresponding depleted sgRNAs in the IgG v.s. cell line group from the screening were identified. Candidate genes were plotted based on the mean log2 fold change in sgRNA counts, and p values were computed using MAGeCK. A horizontal line was drawn at a p value of 0.01, and a vertical line represented a fold change of 3. (e) MAGeCK RRA ranking of the top depleted genes in the IgG v.s. cell group from the screening. (f) The mRNA expression of Tnfrsf11b in B16F10 cells after stimulation with TGF-β (5 ng/mL) when Tgfbr2 was knocked out. n = 3 per group, data is presented as the mean ± s.e.m., Student's two-sided unpaired t test was used for statistical analysis. (g) Western blot showing the expression of TGFBR2 and OPG in B16F10 cells. (h, i) Presentative whole-lung images (h) and H&E staining images (i) showing the lung metastases of B16F10 cells with TGFBR2 knockout and OPG overexpression. n = 5 or 6 mice per group. Scale bar: 1 mm. Boxplots (h,i) showed the minimum, first quartile, median, third quartile, and maximum of the data points. P values were calculated by Mann–Whitney U test.
Fig. 5
Fig. 5
OPG promotes lung metastasis in a RANKL-dependent manner. (a, b) Representative whole-lung images (a) and H&E staining images (b) showing the lung metastases of B16F10 cells overexpressing RANKL. n = 6 mice per group. (c, d) Analysis of the lung metastases of B16F10 cells after treatment with recombinant RANKL protein (100 μg/mouse every 3 days). n = 5 mice per group. (e) Cartoon showing the strategy of cancer cell injection of the WT and Rankl−/− mice. (f, g) Analysis of lung metastasis of B16F10 cells with OPG knockdown in WT and Rankl−/− mice, as shown in (e). (f) Statistics of pulmonary surface nodules. (g), Statistics of the metastatic tumor area. n = 5 mice per group. (h) H&E staining of (g). Red arrows indicate the metastatic clones within the lungs of the Rankl−/− mice. H&E staining scale bar: 1 mm. All boxplots showed the minimum, first quartile, median, third quartile, and maximum of the data points. P values were determined by Mann–Whitney U test.
Fig. 6
Fig. 6
OPG promotes lung metastasis by blocking RANKL-RANK signalling on Mo-macs. (a) Gating strategy for RANK-positive cells. Among the live and single cells, most RANK+ cells were CD45 positive. These cells were then subjected to CD11b+F4/80+ staining (Mo-Macs) and Ly6G+Ly6C+ staining (G-MDSCs). n = 3 mice per group. (b, c) Analysis of lung metastasis in B16F10 cells with OPG knockdown. Mice were treated with IgG or an α-CSF1R antibody to deplete Mo-macs in the lung. (b) Representative whole-lung images and statistics of surface metastatic nodules. (c) H&E staining and statistics of the metastatic area. n = 5–6 mice per group. All H&E staining scale bars: 1 mm. (d) Cartoon showing the cancer cell injection strategy used for the WT and Lyz2-iCre;Rankf/f (CKO) mice. (e, f) Analysis of lung metastasis of B16F10 cells with OPG knockdown in WT and CKO mice, as shown in (d). (e), Statistics of pulmonary surface nodules. (f), Statistics of the metastatic tumor area. n = 8 mice per group. All boxplots with all the data points show the minimum, first quartile, median, third quartile, and maximum values, as determined by Mann–Whitney U test.
Fig. 7
Fig. 7
The RANKL-RANK-CXCL10 signalling axis recruits NK cells to inhibit lung metastasis. (a) Flow cytometry graphs and statistics showing the percentages of CD3-; NK1.1+ NK cells among CD45+ immune cells in the lungs with metastatic nodules generated by control or OPG-KD B16F10 cancer cells. n = 10 mice per group. (b) Number of NK cell in the lungs with metastatic nodules generated by control or OPG-KD B16F10 cancer cells. n = 10 mice per group. (c) Correlation analysis between TNFRSF11B mRNA expression and the activated NK cell signature in lung metastasis samples from the AURORA and RAP cohorts. Statistics was analysed by Pearson correlation analysis. (dg) Analysis of lung metastases generated by control or OPG-KD B16F10 cells tail vein injected into female C57BL/6 mice. Mice were treated with IgG or an α-NK1.1 antibody. (d, e) Representative lung images and statistics of surface metastatic nodules. (f, g) H&E staining images and statistical analysis of the metastatic areas. n = 5 mice per group. Scale bar: 1 mm. (h) Top DEGs in lung Mo-Macs after treated with either PBS or recombinant RANKL protein (100 ng/mL) for 24 h. A horizontal line was drawn at a adj.p-value of 0.05, and vertical lines represented a fold change of 2. (i) Heat map of comparing chemokine gene expression levels of lung Mo-macs treated with either RANKL or PBS control. Data presented as relative log2 fold change (L2FC). (j, k) Representative whole-lung figures (j) and H&E staining images (k) showing the lung metastases of B16F10 cells overexpressing CXCL10. n = 6 mice per group. Scale bar: 1 mm. (l, m) Analysis of lung metastasis generated by B16F10 cells with OPG knockdown. Mice were treated with vehicle control or AMG-487 (5 mg/kg per mouse) every other day. (l) Statistical analysis of lung surface metastatic nodules and (m) statistical analysis of the metastatic tumor areas. n = 6 mice per group. All boxplots showed the minimum, first quartile, median, third quartile, and maximum of the data points. (a,b) Student's two-sided unpaired t test was used for statistical analysis. (e, g, j, k, l, m) Mann–Whitney U test was used for statistical analysis.
Fig. 8
Fig. 8
Schematic illustration. Metastatic tumor cells in the lung are stimulated by TGF-β to increase the expression and secretion of OPG. OPG, in turn, suppresses the RANKL-RANK signals on Mo-macs, resulting in decreased CXCL10 production and diminished presence of NK cells in the lung microenvironment. Consequently, this cascade promotes the progression of lung metastasis. Schematic presentation was created with BioRender.com.

References

    1. Ganesh K., Massague J. Targeting metastatic cancer. Nat Med. 2021;27(1):34–44. - PMC - PubMed
    1. Gentles A.J., Newman A.M., Liu C.L., et al. The prognostic landscape of genes and infiltrating immune cells across human cancers. Nat Med. 2015;21(8):938–945. - PMC - PubMed
    1. Qian B.Z., Li J.F., Zhang H., et al. CCL2 recruits inflammatory monocytes to facilitate breast-tumour metastasis. Nature. 2011;475(7355):222–225. - PMC - PubMed
    1. Mantovani A., Allavena P., Marchesi F., Garlanda C. Macrophages as tools and targets in cancer therapy. Nat Rev Drug Discov. 2022;21(11):799–820. - PMC - PubMed
    1. Casanova-Acebes M., Dalla E., Leader A.M., et al. Tissue-resident macrophages provide a pro-tumorigenic niche to early NSCLC cells. Nature. 2021;595(7868):578–584. - PMC - PubMed

MeSH terms