. 2024 Dec 24;43(12):115059.
doi: 10.1016/j.celrep.2024.115059. Epub 2024 Dec 13.

Analyses of translation factors Dbp1 and Ded1 reveal the cellular response to heat stress to be separable from stress granule formation

Affiliations

Analyses of translation factors Dbp1 and Ded1 reveal the cellular response to heat stress to be separable from stress granule formation

Naohiro Kuwayama et al. Cell Rep. .

Abstract

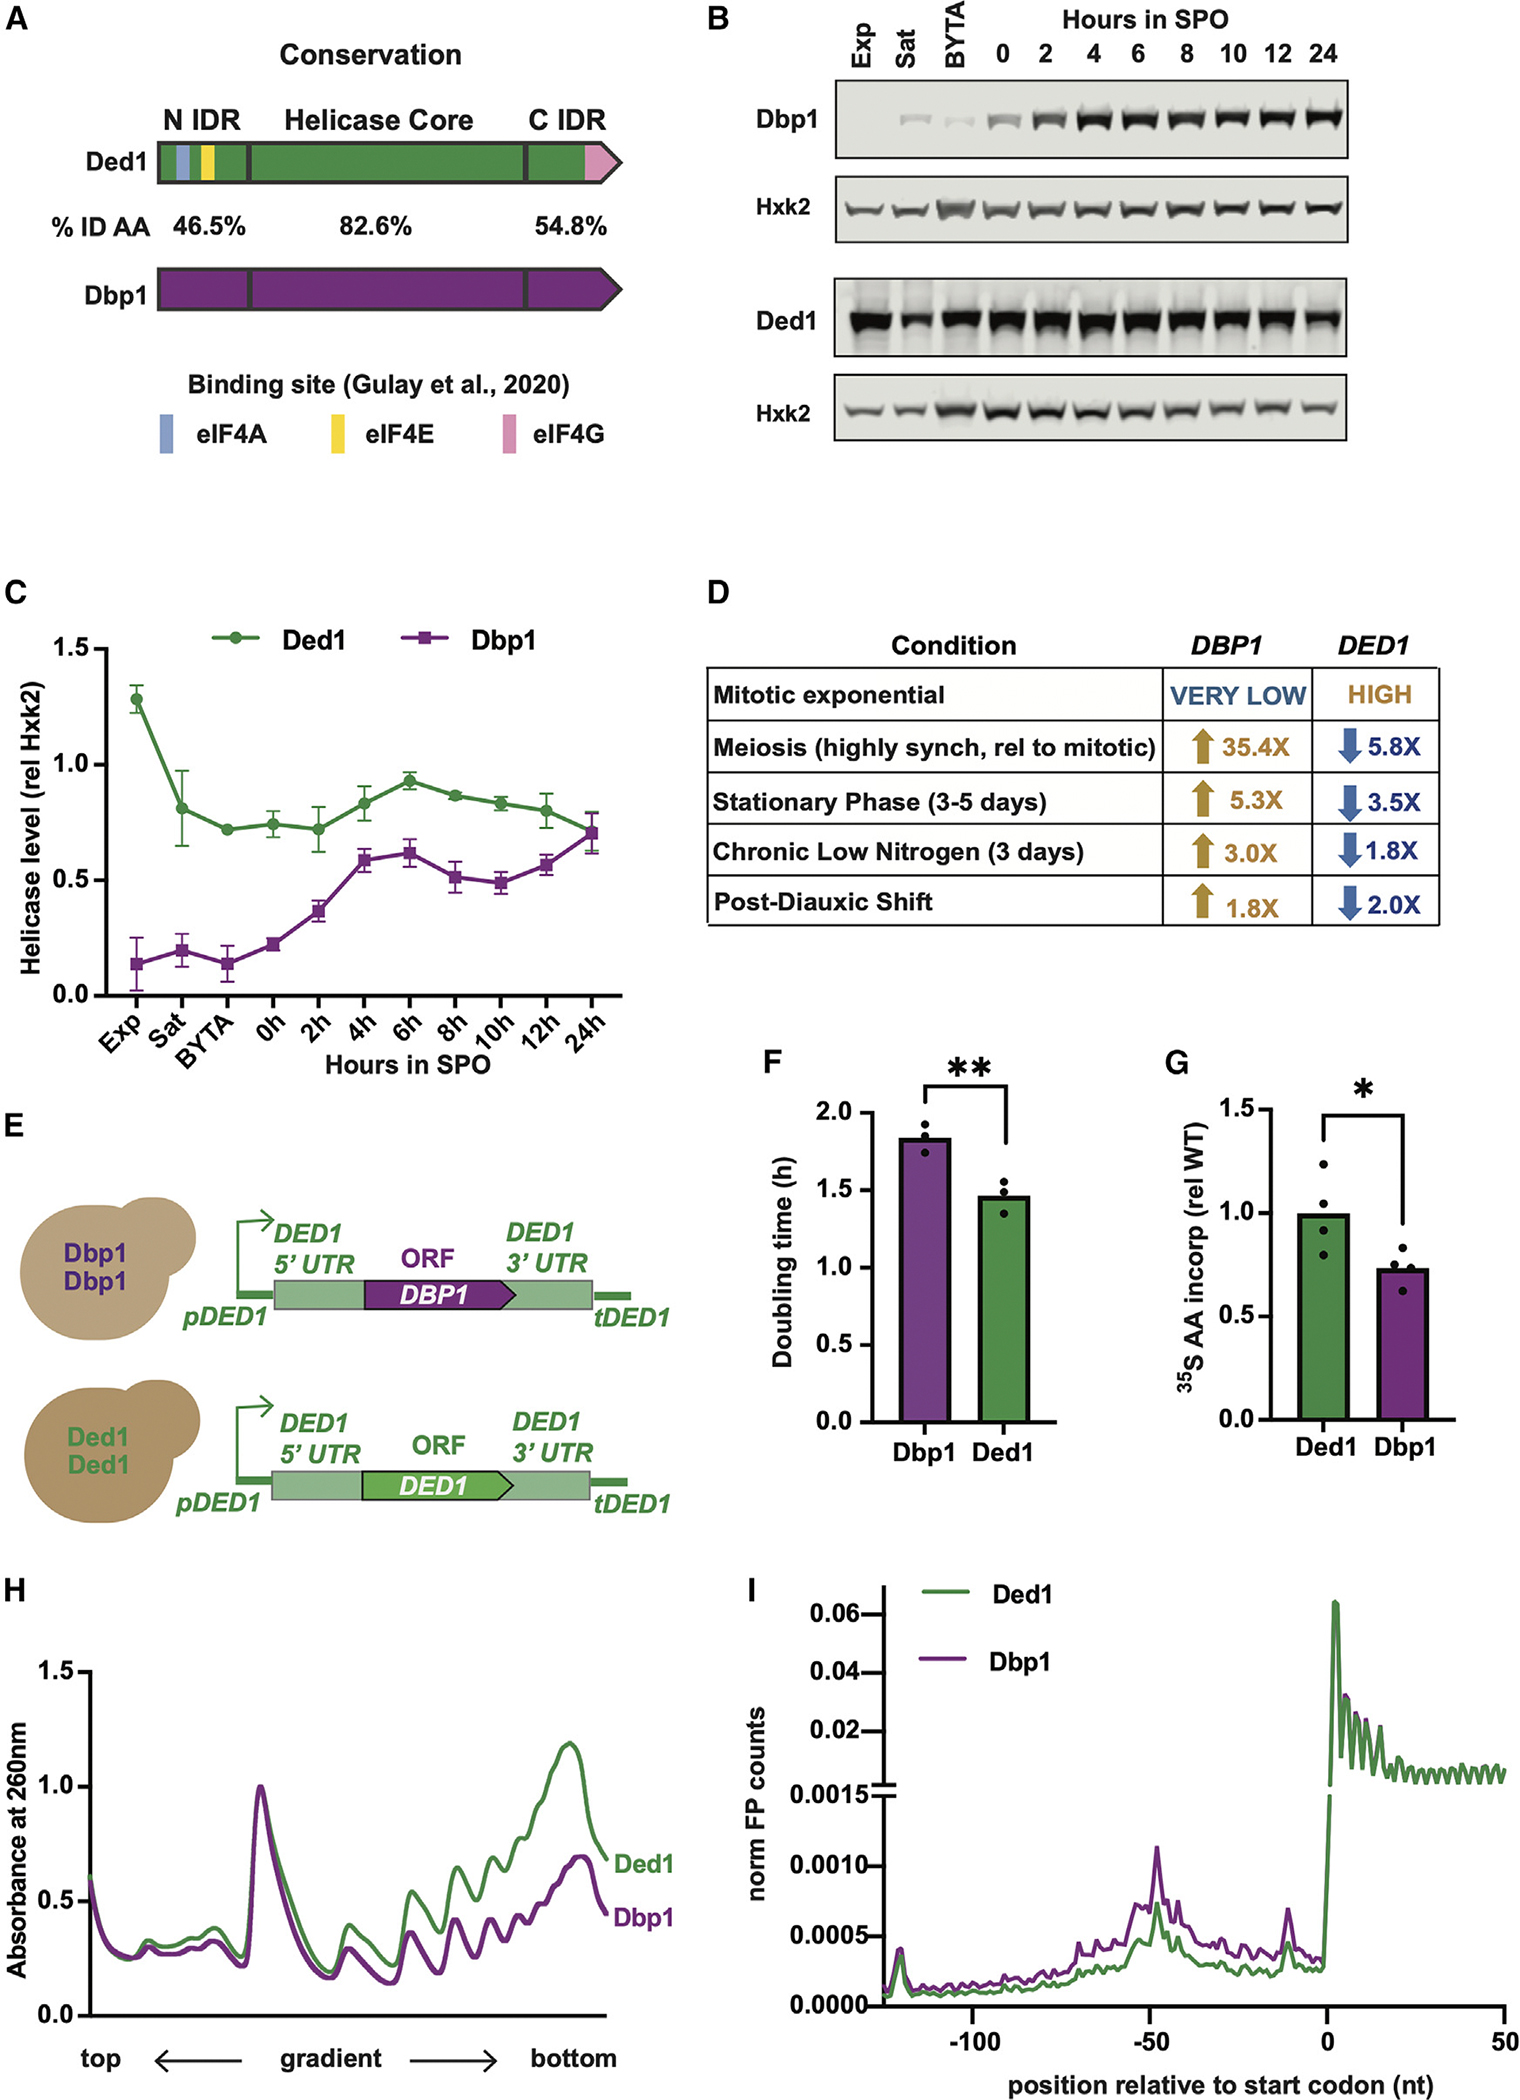
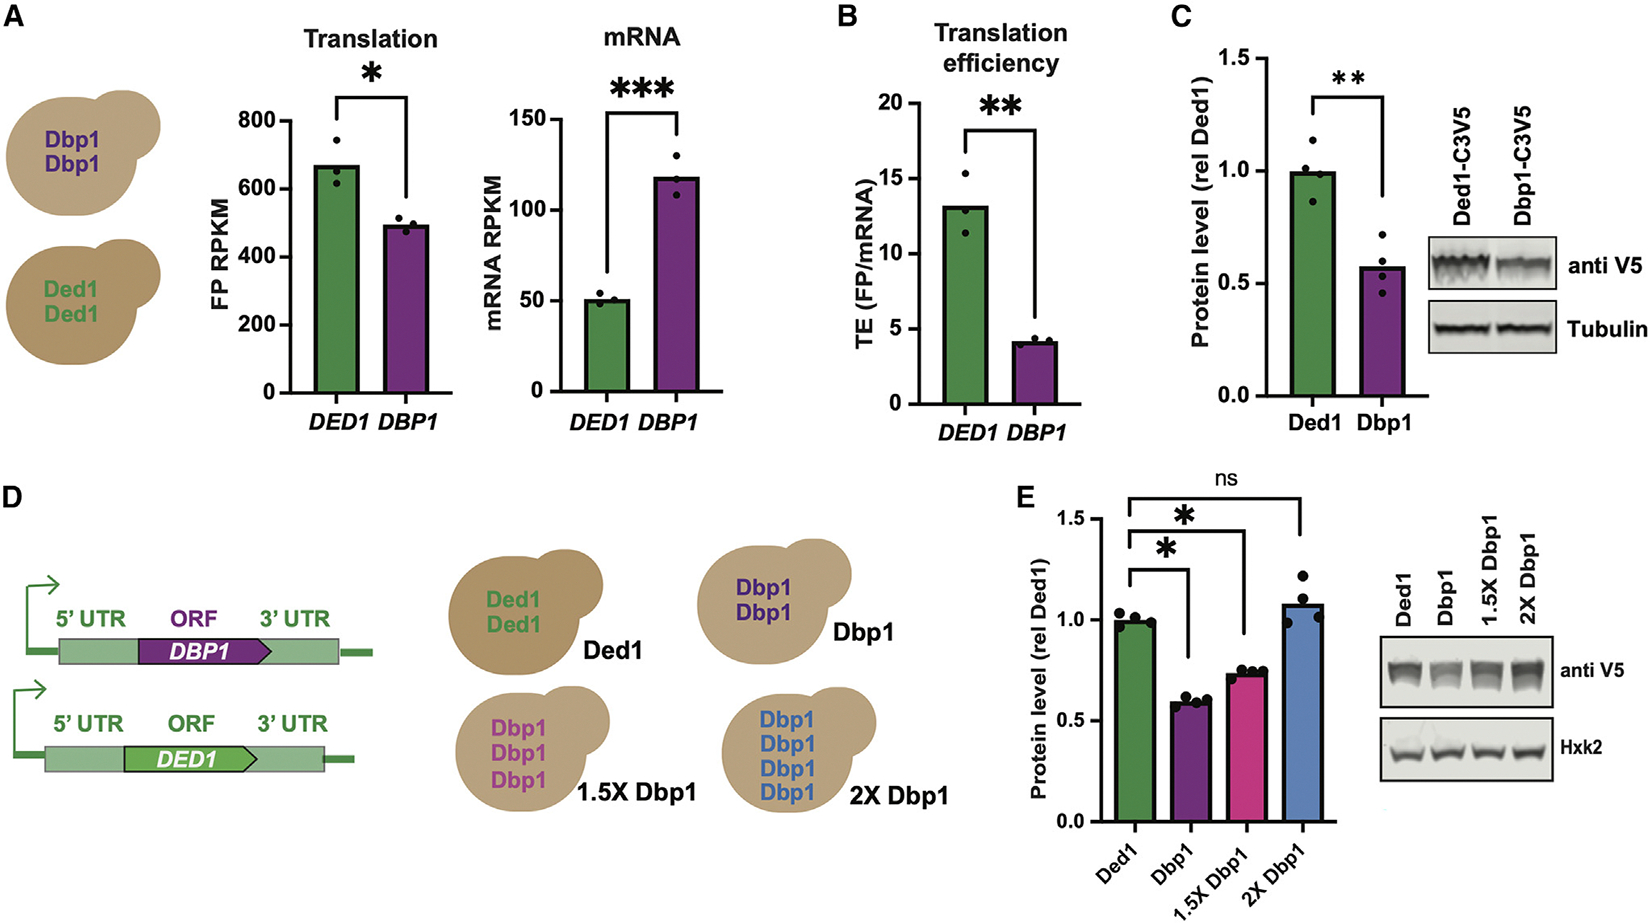
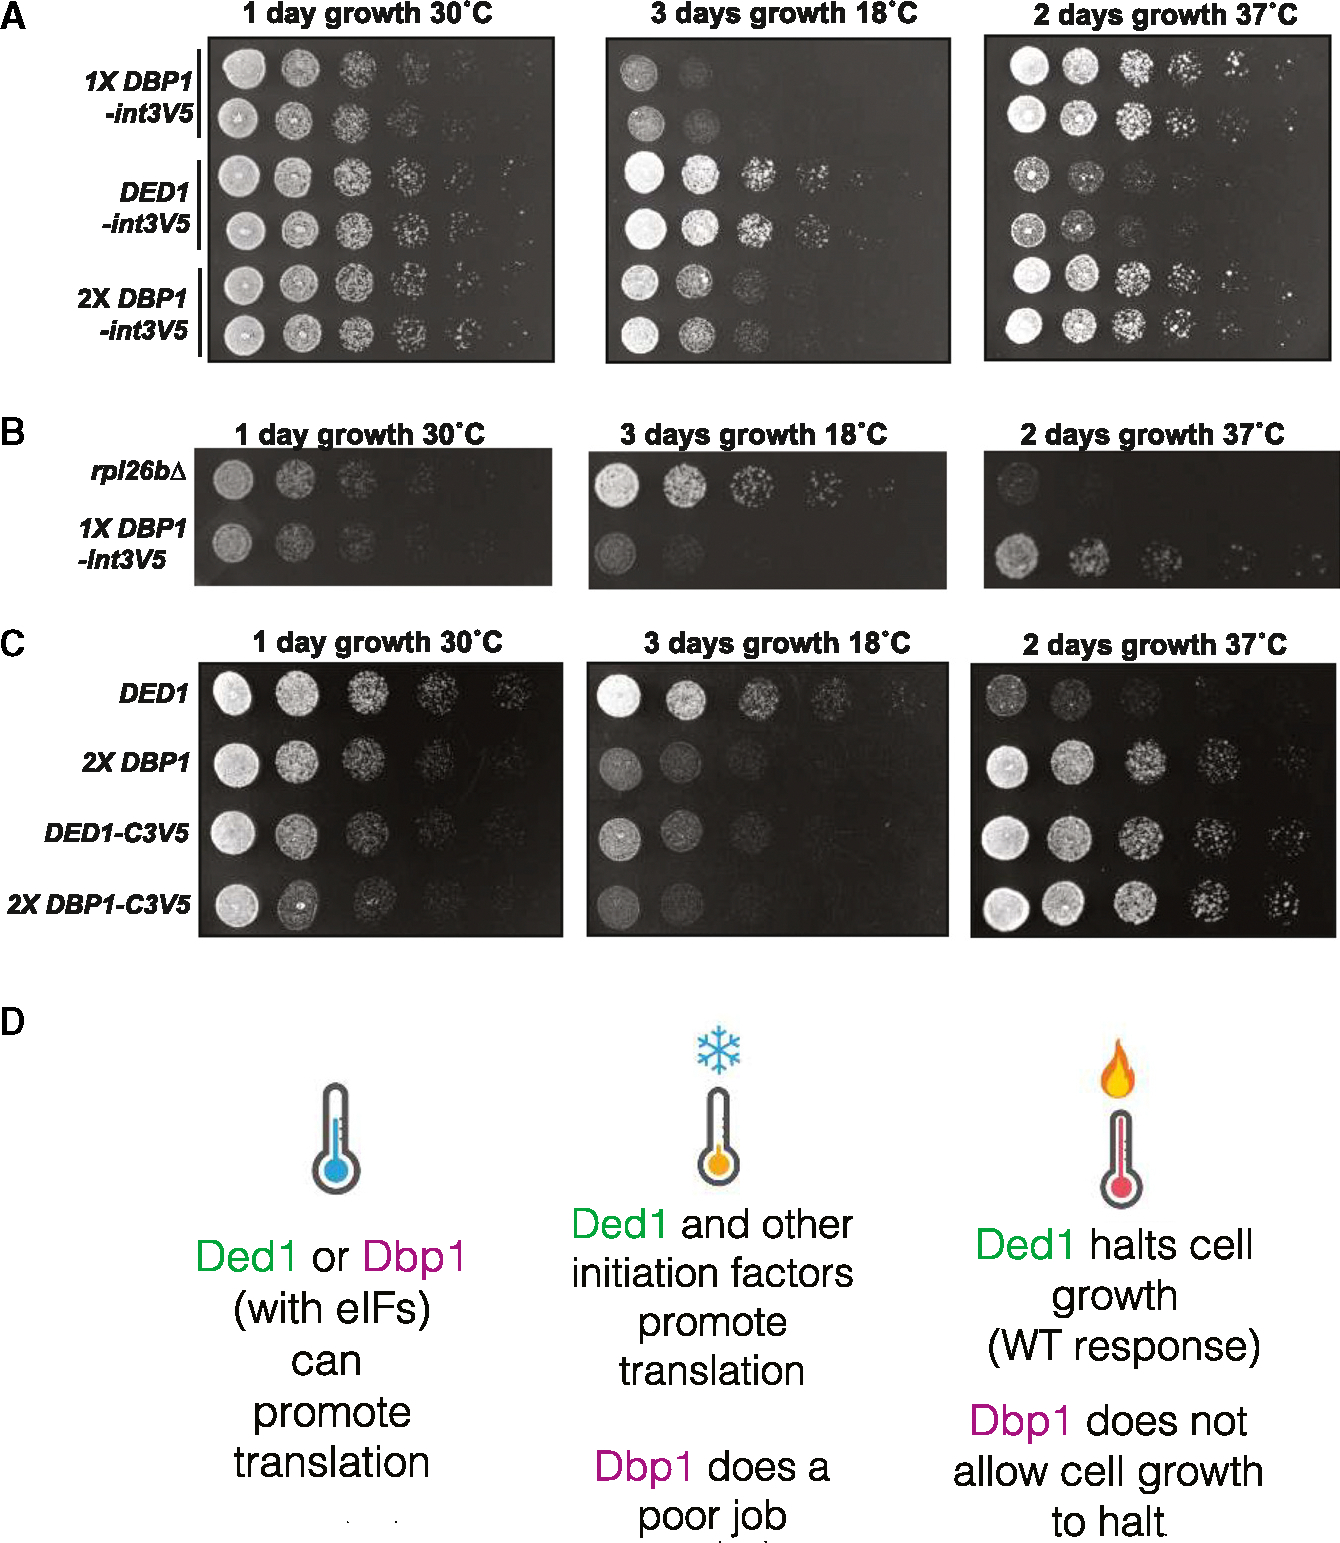
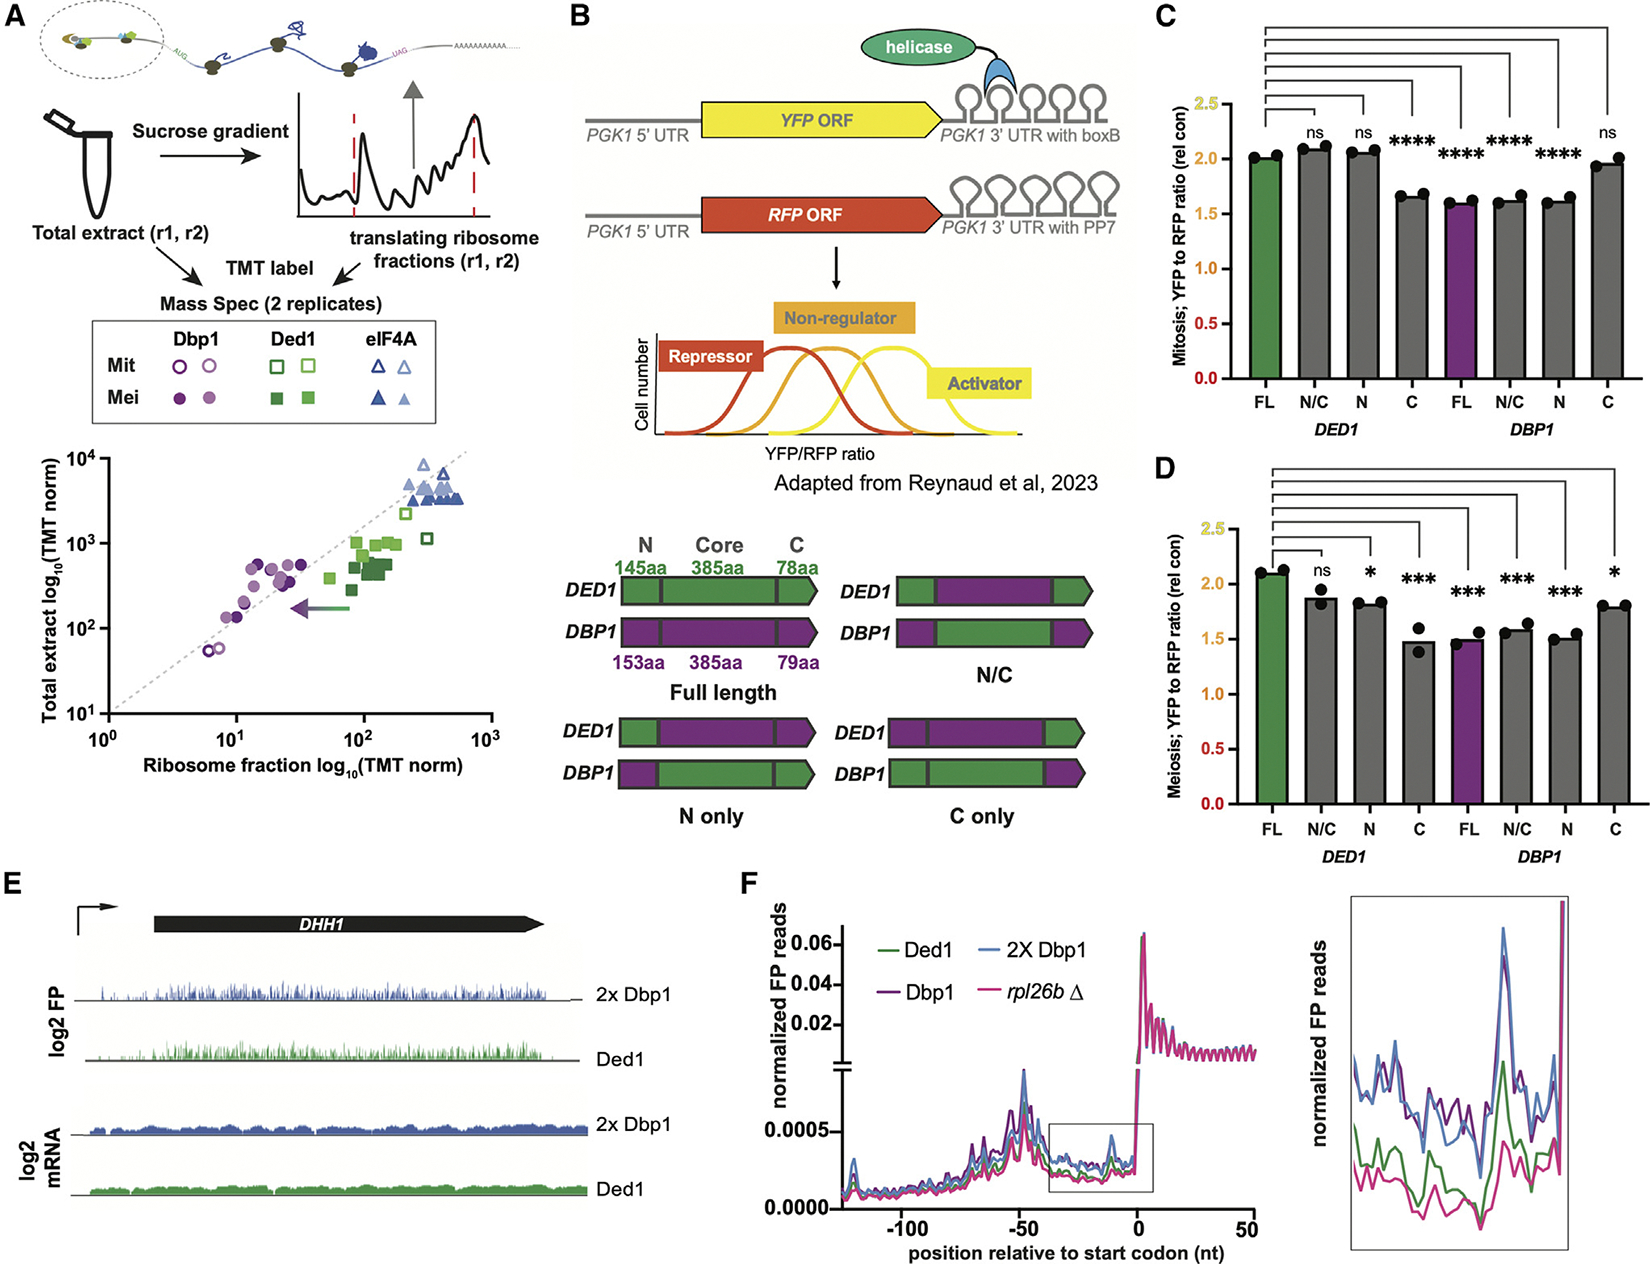
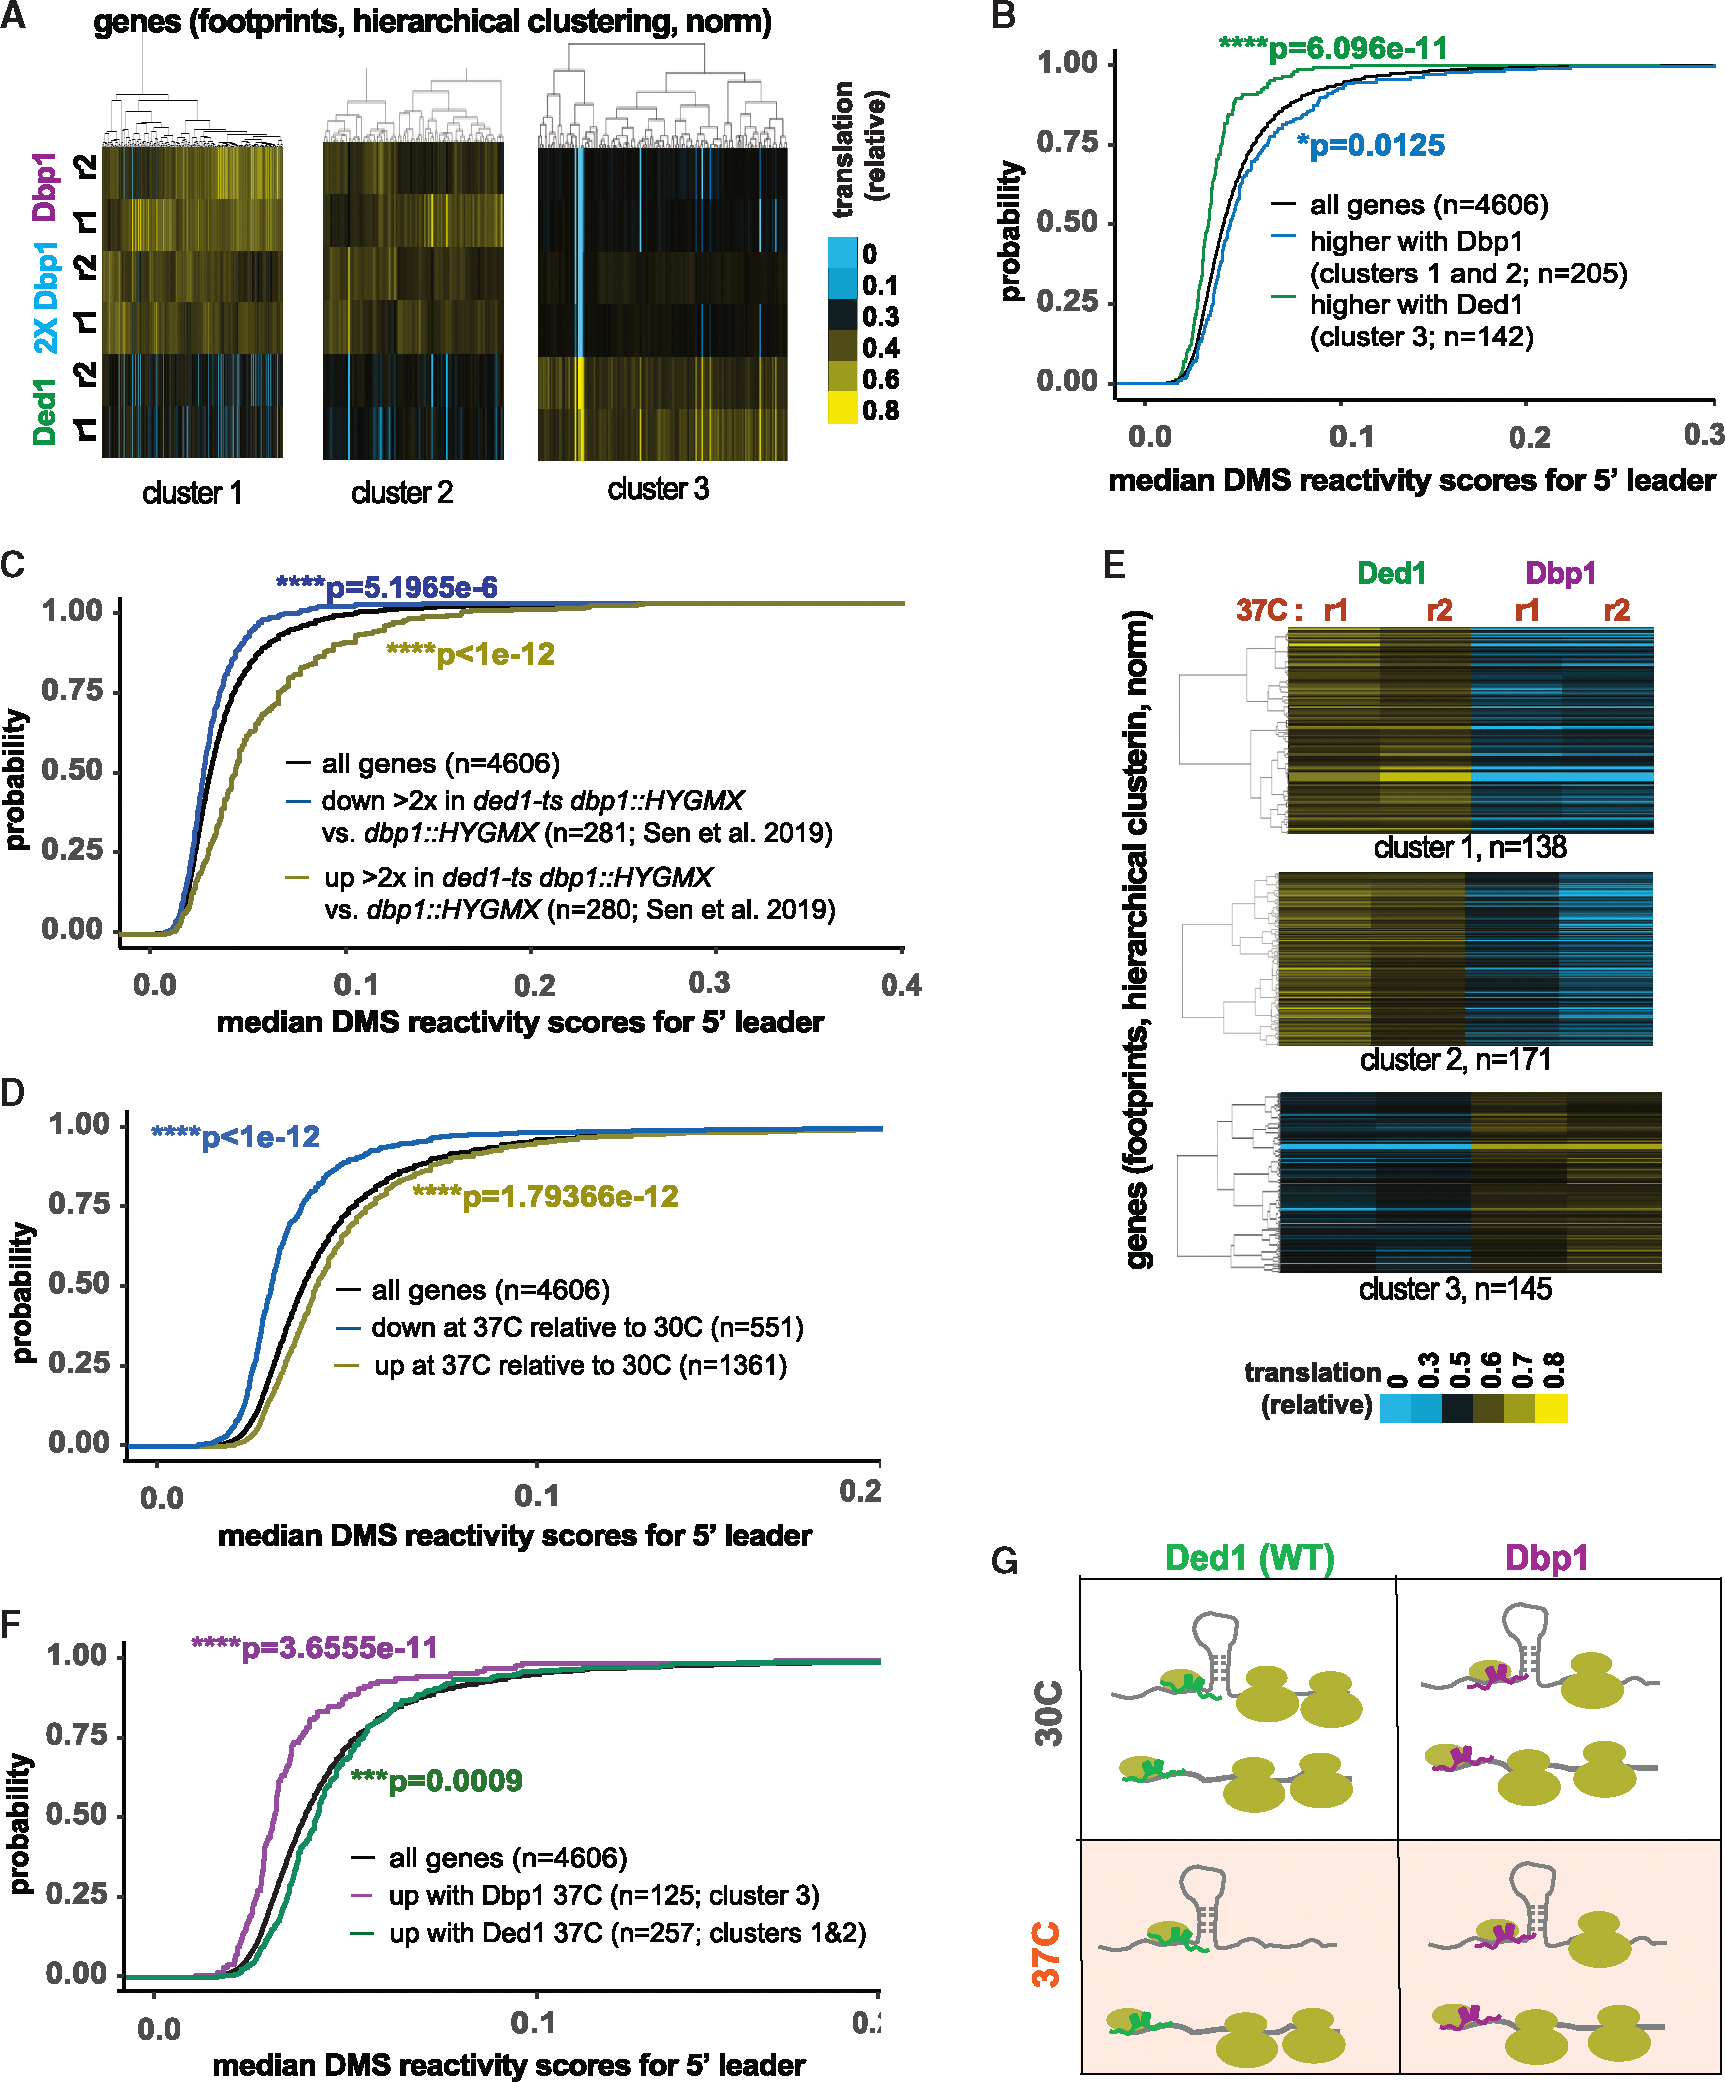
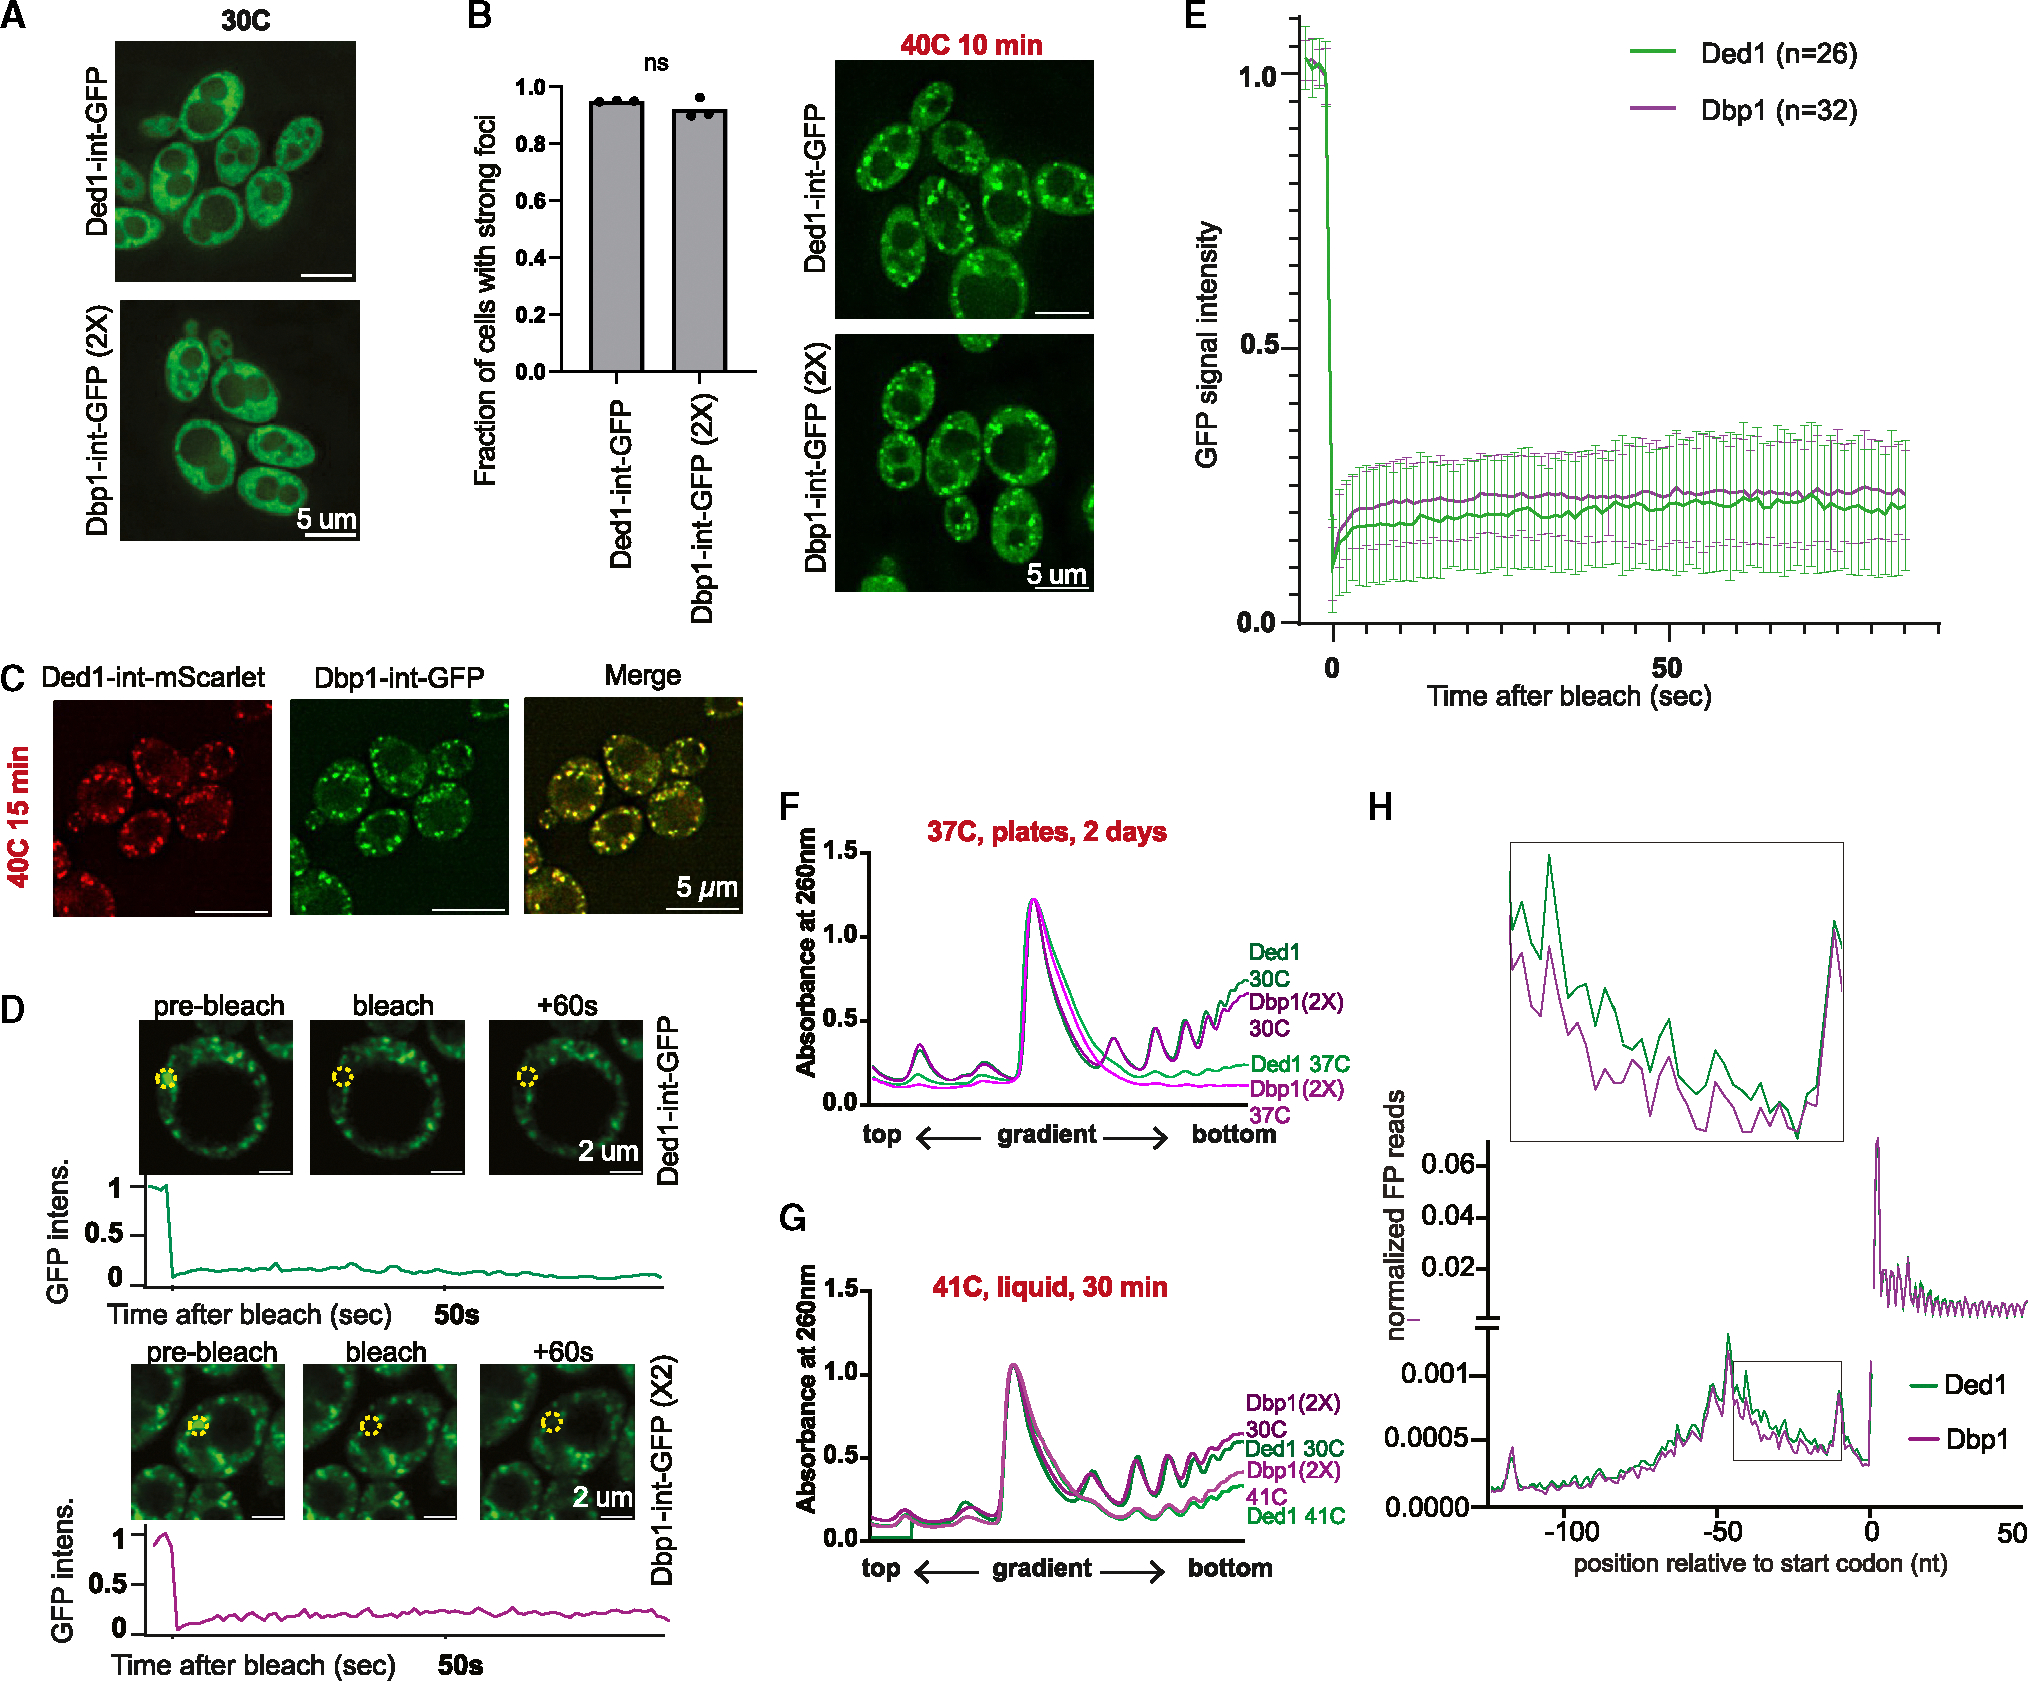
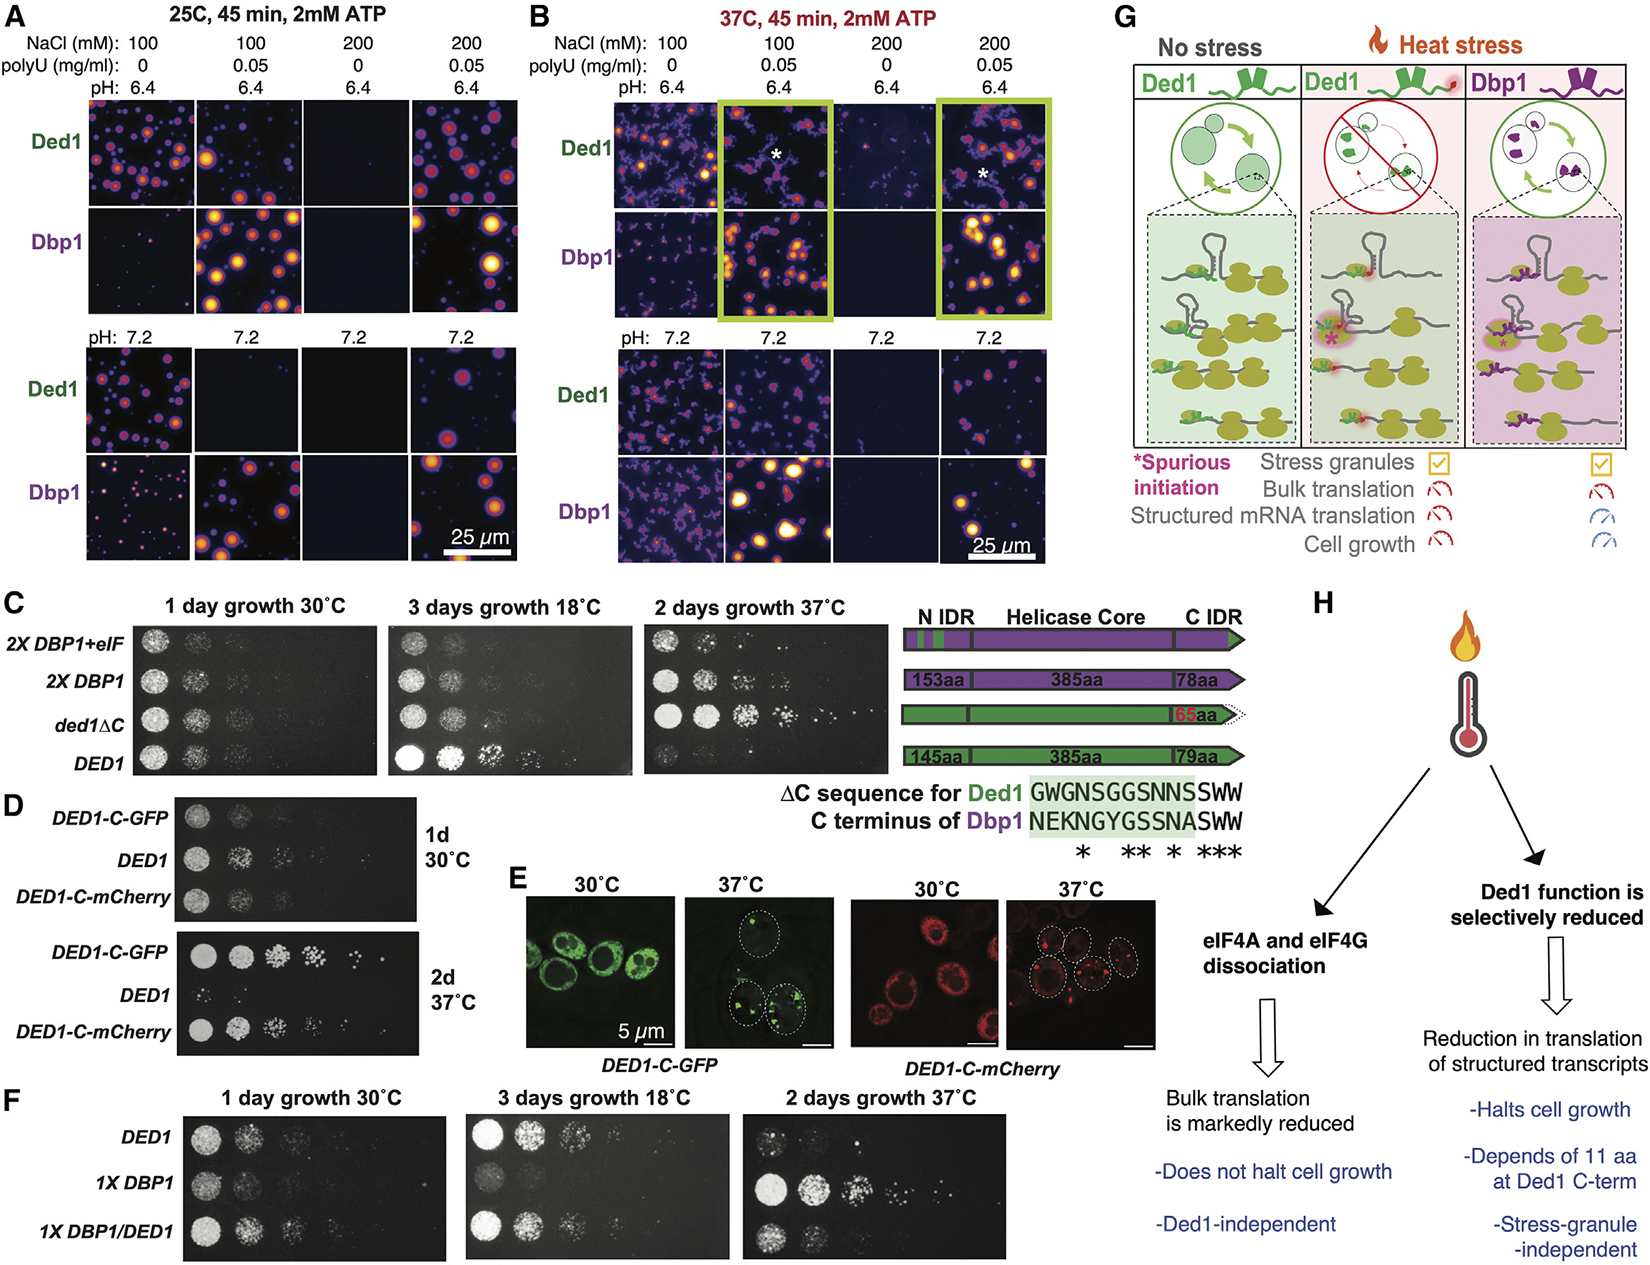
Ded1 and Dbp1 are paralogous conserved DEAD-box ATPases involved in translation initiation in yeast. In long-term starvation states, Dbp1 expression increases and Ded1 decreases, whereas in cycling mitotic cells, Dbp1 is absent. Inserting DBP1 in place of DED1 cannot replace Ded1 function in supporting mitotic translation, partly due to inefficient translation of the DBP1 coding region. Global translation measurements, activity of mRNA-tethered proteins, and growth assays show that-even at matched protein levels-Ded1 is better than Dbp1 at activating translation, especially for mRNAs with structured 5' leaders. Heat-stressed cells normally downregulate translation of structured housekeeping transcripts and halt growth, but neither occurs in Dbp1-expressing cells. This failure to halt growth in response to heat is not based on deficient stress granule formation or failure to reduce bulk translation. Rather, it depends on heat-triggered loss of Ded1 function mediated by an 11-amino-acid interval within its intrinsically disordered C terminus.

Keywords: CP: Molecular biology; DDX3; DEAD-box helicase; Dbp1; Ded1; Translation; heat stress; ribosome profiling; stress granules; translation initiation.


Conflict of interest statement

Declaration of interests The authors declare no competing interests.

Figures

Figure 1.
Figure 1.. Dbp1 is upregulated and Ded1 is downregulated during meiosis, relative to mitotic growth
(A) Dbp1 and Ded1 amino acid identity by region and known eIF-binding sites., (B) Anti-V5 western blots (WBs) and quantification of cells with internally tagged Ded1 or Dbp1. (C) Quantification of (B). N = 3; data are represented as mean ± SD. (D) Conditions in which changes in expression of DBP1 and DED1 are seen., (E) Schematic of constructs integrated at single-copy and homozygously in diploid cells. (F) Doubling times for strains in (E), grown in rich medium (YEPD; yeast extract peptone dextrose). N = 3; **p < 0.01 from unpaired t test. (G) 35S amino acid incorporation for strains in (E), grown in YEPD in exponential phase. N = 3; *p < 0.05 from unpaired t test. (H) Polysome profiles of untagged strains as in (E), matched to S1D. N = 3; representative trace shown. (I) Metagene plots of ribosome footprint (FP) occupancy relative to start codon for untagged strains, as in (E).
Figure 2.
Figure 2.. DBP1 ORF cannot substitute for the DED1 ORF in supporting robust mitotic growth or translation
(A and B) (A) Translation, mRNA, and (B) translation efficiency (TE; footprint RPKM/mRNA RPKM) of untagged DBP1- and DED1-expressing cells, as in Figure 1E in exponential growth conditions. N = 3; *p < 0.05, **p < 0.01, and ***p < 0.001 by unpaired t test. (C) Levels of C-terminally 3V5-tagged Ded1 and Dbp1 in exponential growth conditions by WB. N = 4; **p < 0.01 as determined by unpaired t test. (D) Schematic of single-copy integrations as in Figures S3A and 1E. (E) Dbp1/Ded1 protein levels as determined by WB for internally 3V5-tagged strains. Representative blot shown. N = 4; *adjusted p (padj) <0.05 by ordinary oneway ANOVA, corrected for multiple comparisons using Dunnett’s multiple comparison test.
Figure 3.
Figure 3.. Dbp1 fails to support growth at low temperature and growth reduction at high temperature
Growth of diploid cells on YEPD, with serial 1:5 dilution at 30°C, 18°C, and 37°C. (A) Internally 3V5-tagged proteins, as in Figure 2E. (B) Growth-matched rpl26bΔ cells and 1× Dbp1 cells in Figure 2E. (C) Untagged strains expressing matched levels of Ded1 or Dbp1 at top. C-terminal 3V5 tagged strains below. Protein levels in Figures S4I and S4J. (D) Summary of the ability of Dbp1 and Ded1 to support translation and mitotic growth at different temperatures.
Figure 4.
Figure 4.. Dbp1 is less effective at driving translation activation than Ded1
(A) Levels of Dbp1, Ded1, and eIF4A that sediment with translating ribosome pools during mitosis or meiosis as determined by TMT mass spectrometry. N = 2; matched to experiment in Figure S1A. An example of the species of interest is circled above. (B) Experimental setup for mRNA tethering assay. Schematics of full-length and chimeric C-terminally tagged proteins below. (C and D) Mitotic (C) or meiotic (D) cells were analyzed by flow cytometry. N = 2; one-way ANOVA corrected for multiple comparisons using Dunnett’s multiple comparison test, *padj < 0.05,**padj < 0.01, ***padj < 0.001, ****padj < 0.0001. (E) Positional data for ribosome footprints (FPs) and mRNA over DHH1 in mitosis for untagged strains in Figures 2D and S3A. (F) Metagene plots relative to all annotated start codons for the same strains.
Figure 5.
Figure 5.. mRNAs with structured 5′ leaders are poorly translated by Dbp1 at 30°C, and even more poorly by Ded1 at 37°C
(A) Ribosome profiling data of untagged strains in Figures 2D and S3A were clustered for all transcripts measured (n = 6,218). The three sub-clusters shown had RNA-remodeler-dependent differences. (B–D) Median 5′ leader DMS reactivity scores. Significance assessed by K-S test. (B) Analysis of transcripts in (A). (C) Analysis of transcripts up- or downregulated with Ded1 inactivation. (D) Analysis of transcripts in S6A. (E) Ribosome profiling data for untagged Ded1- vs. Dbp1-expressing cells grown at 37°C were clustered for all transcripts (n = 6,218). The three sub-clusters shown had helicase-dependent differences. (F) Median 5′ leader DMS reactivity scores for transcripts in (E). Significance by K-S test. (G) Summary of cytosolic translation of structured transcripts with Ded1 or Dbp1 expression at 30°C vs. 37°C.
Figure 6.
Figure 6.. Dbp1- and Ded1-expressing cells form stress granules and reduce bulk translation in response to heat stress
(A and B) Representative images of cells expressing internally GFP-tagged Ded1 or Dbp1 (2×) (A) grown at 30°C or (B) shifted from liquid growth at 30°C to 40°C for 10 min. >100 cells per experiment, quantification at left, N = 3, significance by Student’s t test. (C) Diploid cells expressing internally GFP-tagged Dbp1 and internally mScarlet-tagged Ded1 were imaged after shifting from liquid growth at 30°C to 40°C for 15 min. (D) FRAP images and traces for cells shifted to 37°C. (E) Compilation of FRAP data as in (D) for at least 26 cells each; data are represented as mean ± SD. (F) Representative polysome profiles of Ded1- or Dbp1-expressing cells grown at 30°C or 37°C on YEPD plates. (G) Representative polysome profiles of Ded1- or Dbp1-expressing cells grown at 30°C or 41°C in liquid YEPD. (H) Metagene plot relative to all annotated start codons for ribosome profiling data from untagged Dbp1- or Ded1-expressing cells at 37°C.
Figure 7.
Figure 7.. Ded1 undergoes heat-dependent loss in function at high temperature that depends on a short C-terminal region
(A and B) 5 μM purified untagged Ded1 or Dbp1 were imaged in the conditions shown. N = 3. In (B), yellow boxes indicate conditions in which Ded1 and Dbp1 morphology differs. Asterisks indicate non-spherical chain-like structures. (C) 1:5 serial dilution and growth of untagged diploid cells on YEPD plates at either 30°C, 18°C, or 37°C. Untagged strains are shown. Replicate in Figure S6L. Schematics of strains at right, with 14-amino-acid C-terminal sequence shown for Dbp1 and Ded1, with the 11-amino-acid “heat sensor” region of Ded1 in green. (D) Growth of C-terminally GFP- or mCherry-tagged diploid cells at 30°C or 37°C on YEPD plates, using serial 1:5 dilution, Replicate in Figure S6K. (E) Microscopy of strains in (D) grown at either 30°C or 37°C. (F) Growth of untagged diploid cells at 30°C, 18°C, or 37°C on YEPD plates, using serial 1:5 dilution. Replicate in Figure S6L. (G) Summary of the cellular effects of heat on Ded1, translation, and cell growth. (H) Summary of proposed two-pronged response to heat shock.

Similar articles

References

    1. Weis K, and Hondele M (2022). The Role of DEAD-Box ATPases in Gene Expression and the Regulation of RNA–Protein Condensates. Annu. Rev. Biochem. 91, 197–219. 10.1146/annurev-biochem-032620-105429. - DOI - PubMed
    1. Bohnsack KE, Yi S, Venus S, Jankowsky E, and Bohnsack MT (2023). Cellular functions of eukaryotic RNA helicases and their links to human diseases. Nat. Rev. Mol. Cell Biol. 24, 749–769. 10.1038/s41580-023-00628-5. - DOI - PubMed
    1. Putnam AA, and Jankowsky E (2013). DEAD-box helicases as integrators of RNA, nucleotide and protein binding. Biochim. Biophys. Acta 1829, 884–893. 10.1016/j.bbagrm.2013.02.002. - DOI - PMC - PubMed
    1. Sharma D, and Jankowsky E (2014). The Ded1/DDX3 subfamily of DEAD-box RNA helicases. Crit. Rev. Biochem. Mol. Biol. 49, 343–360. 10.3109/10409238.2014.931339. - DOI - PubMed
    1. Andreou AZ, and Klostermeier D (2013). The DEAD-box helicase eIF4A: Paradigm or the odd one out? RNA Biol. 10, 19–32. 10.4161/rna.21966. - DOI - PMC - PubMed

Publication types

MeSH terms

Substances

Associated data