. 2025 Feb:79:103467.
doi: 10.1016/j.redox.2024.103467. Epub 2024 Dec 12.

Sarcopenic obesity is attenuated by E-syt1 inhibition via improving skeletal muscle mitochondrial function

Affiliations

Sarcopenic obesity is attenuated by E-syt1 inhibition via improving skeletal muscle mitochondrial function

Chao Song et al. Redox Biol. 2025 Feb.

Abstract

In aging and metabolic disease, sarcopenic obesity (SO) correlates with intramuscular adipose tissue (IMAT). Using bioinformatics analysis, we found a potential target protein Extended Synaptotagmin 1 (E-syt1) in SO. To investigate the regulatory role of E-syt1 in muscle metabolism, we performed in vivo and in vitro experiments through E-syt1 loss- and gain-of-function on muscle physiology. When E-syt1 is overexpressed in vitro, myoblast proliferation, differentiation, mitochondrial respiration, biogenesis, and mitochondrial dynamics are impaired, which were alleviated by the silence of E-syt1. Furthermore, overexpression of E-syt1 inhibited mitophagic flux. Mechanistically, E-syt1 overexpression leads to mitochondrial calcium overload and mitochondrial ROS burst, inhibits the fusion of mitophagosomes with lysosomes, and impedes the acidification of lysosomes. Animal experiments demonstrated the inhibition of E-syt1 increased the capacity of endurance exercise, muscle mass, mitochondrial function, and oxidative capacity of the muscle fibers in OVX mice. These findings establish E-syt1 as a novel contributor to the pathogenesis of skeletal muscle metabolic disorders in SO. Consequently, targeting E-syt1-induced dysfunction may serve as a viable strategy for attenuating SO.

Keywords: E-syt1; Mitochondria; Mitophagy; Myogenesis; Sarcopenic obesity.


Conflict of interest statement

Declaration of competing interest The authors declare that they have no competing interests.

Figures

Fig. 1
Fig. 1
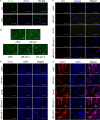
E-syt1 hinders the proliferation and differentiation of myoblasts. (A) Venn diagram illustrating the overlap between adipokines, exoadipokines, mRNA up-regulated during adipogenic differentiation, and protein up-regulated in aging muscle. (B) A heat map was used to reveal three candidate proteins. (C) A volcano plot presents three differentially expressed proteins. (D) Immunohistochemistry, immunofluorescence, Bodipy staining, and quantitative analysis of gastrocnemius muscle samples from young mice (4 months) and old mice (24 months). (E) The E-syt1 expression in young and aged human skeletal muscle (PXD011967). (F) Representative blot images and quantitative analysis of E-syt1 in differentiated differentiated (day 0, 4, 7) C2C12 cells. (G) qRT-PCR validated the efficiency of transfection. (H) CCK8 assay of the oeNC, oeE-syt1, shNC, shE-syt1-1 and shE-syt1-2 groups. (I) Representative blot images and quantitative analysis of Ki67 and E-syt1. (J) FCM for the cell cycle of each group. (K) Representative EDU staining and quantitative analysis of EDU-positive cells. (L) Measurement of mRNA expression of Myostatin, MuRF-1, and Atrogin-1 by qRT–PCR. (M) Representative blot images and quantitative analysis of the myogenic markers (Myod1, Myog, and MyHC) and muscle atrophic factors (MuRF-1, Atrogin-1, and Myostatin). (N) Representative image of immunofluorescence staining and quantitative analysis of Myog and MyHC in each group. (F-J, L-M) n = 3. Values are shown as mean ± SD. (D, K, N) n = 3, three fields per sample were selected. Values are shown as mean ± SD. ∗P < 0.05, ∗∗P < 0.01, ∗∗∗P < 0.001, ∗∗∗∗P < 0.0001. (D, K, N) Scale bar = 200 μm.
Fig. 2
Fig. 2
E-syt1 suppresses both mitochondrial respiration and biogenesis in C2C12 myoblasts. (A) Representative blot images and quantitative analysis of OXPHOS complexes (NDUFS1, SDHA, UQCRC2, COX IV, and ATP5A1). (B) Representative blot images and quantitative analysis of mitochondrial biogenesis markers (VDAC1, PGC-1α, and PGC-1β). (C) Representative oxygen consumption curves in the oeNC and oeE-syt1-treated C2C12 cells. (D) Representative oxygen consumption curves in the shNC and shE-syt1-treated C2C12 cells. (E) Quantification analysis of basal respiration, ATP-linked respiration, proton leak respiration, maximal respiration, spare respiration, and non-mitochondrial respiration in overexpression or silencing cells. (F) Genomic DNA was extracted from the overexpression or silencing of C2C12 myoblasts separately. The ratio of mitochondrial DNA and nuclear DNA determined mitochondrial content. (G) Representative images and quantitative analysis of the mitochondrial membrane potential. The bottom row is a magnified view of the area in the image from the top row, indicated with a yellow square. (A–F) n = 3. Values are shown as mean ± SD. (G) n = 3, three fields per sample were selected. Values are shown as mean ± SD. Ns, no significance, ∗P < 0.05, ∗∗P < 0.01, ∗∗∗P < 0.001, ∗∗∗∗P < 0.0001. (G) Scale bar = 200 μm.
Fig. 3
Fig. 3
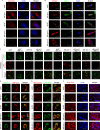
E-syt1 impaired mitochondrial dynamics in myoblasts. (A) Representative blot images and quantitative analysis of mitochondrial fusion proteins (Mfn1, Mfn2, Opa1) and fission proteins (Drp1, Fis1). (B) Representative images of mitochondria labeled with Mito-Tracker Red (100 nM, 30 min)., and 2D morphological analysis of each group. (C) Skeletonization of the mitochondrial objects identified in B and quantitative analysis of mitochondrial network connectivity. (D) Representative images of Rhod-2 AM-stained mitochondrial Ca2+ and MitoSOX-stained mitochondrial ROS. Quantitative analysis of the content of mitochondrial Ca2+ and relative ROS production. (E) Representative images of transmission electron microscopy. The bottom row is a magnified view of the area in the image from the top row, indicated with a black square (Yellow asterisks represented normal mitochondria. Red asterisks represented mitophagosome). Quantitative analysis of the number of mitophagosomes and morphologically normal mitochondria. (A) n = 3. Values are shown as mean ± SD. (B–E) n = 3, three fields per sample were selected. Values are shown as mean ± SD. Ns, no significance, ∗∗P < 0.01, ∗∗∗P < 0.001, ∗∗∗∗P < 0.0001. (B–D) Scale bar = 10 μm. (E) Top scale bar = 1 μm, bottom scale bar = 500 nm.
Fig. 4
Fig. 4
Overexpression of E-syt1 suppressed mitophagic flux. (A) Representative blot images and quantitative analysis of E-syt1, LC3B–I, LC3B-II, p62, Pink1, and Parkin. (B) Representative images of mitochondria labeled with red (TOM20) and mitophagy labeled with green (Parkin) were utilized. Profiles were obtained using ImageJ software along the white dashed line. (C) Representative blot images and quantitative analysis of LC3B–I, LC3B-II, p62, Pink1, and Parkin in groups with or without treatment with Baf A1. (D) Representative mt-keima image and quantitative analysis of mitophagy index (534/458 nm) in each group. (A, C) n = 3. Values are shown as mean ± SD. (B, D) n = 3, three fields per sample were selected. Values are shown as mean ± SD. Ns, no significance, ∗P < 0.05, ∗∗P < 0.01, ∗∗∗P < 0.001, ∗∗∗∗P < 0.0001. (B) Scale bar = 20 μm. (D) Scale bar = 10 μm.
Fig. 5
Fig. 5
E-syt1 inhibits the fusion of mitophagosomes with lysosomes and lysosomal activity. (A) The cells were transfected with GFP-LC3-RFP. The enlarged images are magnified from the boxed areas in the overlay images. Quantification of autophagosomes (yellow dots) and autolysosomes (red dots) in cells transfected with GFP-LC3-RFP was analyzed. (B) Representative co-localization images of MitoTracker and LysoTracker in each group. Profiles were obtained using ImageJ software along the white dashed line. (C) Magic Red, representative images and quantitative analysis of lysosomal cathepsin B activity analyzed the lysosomal activity and acidity. (D) Representative images and quantitative analysis of lysosome acidity. (A–D) n = 3, three fields per sample were selected. Values are shown as mean ± SD. ∗∗∗∗P < 0.0001. (A, B, D) Scale bar = 10 μm. (C) Scale bar = 200 μm.
Fig. 6
Fig. 6
Lack of E-syt1 improved physical performance and muscle quality in OVX mice. (A) Schematic diagram of animal experiments. (B) Physical performance assessment on a treadmill. After four weeks of treatment, measurements of maximal running speed, distance, and running time. (C) Grip strength was measured after treatment. (D) EGFP expression in individual tissues was monitored by IVIS-100 optical imaging 4 weeks post-injection. (E) Representative macro photographs of GA and body weight and GA mass. (F) Representative image of immunofluorescence staining and quantitative analysis of E-syt1 in each group. (G) Representative image of Bodipy staining and quantitative analysis of the fluorescence intensity of Bodipy. (H) A representative image of H&E and Masson staining and quantitative analysis of the minimum ferret diameter of GA myofibers. (B–C, E, H) n = 5. Values are shown as mean ± SD. (F, G) n = 5, three fields per sample were selected. Values are shown as mean ± SD. Ns, no significance, ∗P < 0.05, ∗∗P < 0.01, ∗∗∗P < 0.001, ∗∗∗∗P < 0.0001. (F, G) Scale bar = 200 μm.
Fig. 7
Fig. 7
E-syt1 ablation improved mitochondrial homeostasis and skeletal muscle remodeling in OVX mice. (A) Representative SDH staining and quantitative analysis of SDH-positive fibers percentage of each group. (B) Electron microscopy examination was performed on the GA samples. The bottom row, a magnified view of the area in the image from the top row, is indicated with a yellow square. Yellow asterisks represented normal mitochondria. Red asterisks represented abnormal mitochondria. Quantitative analysis of the abnormal mitochondria and mitochondrial number ratio in each group. (C) Representative image of immunofluorescence staining and quantitative analysis of PAX7 and Ki67. (D) Representative image of immunofluorescence staining and quantitative analysis of MHC I, IIa, IIb, and IIx myofibers. (B) n = 5. Values are shown as mean ± SD. (A, C, D) n = 5, three fields per sample were selected. Values are shown as mean ± SD. Ns, no significance, ∗P < 0.05, ∗∗P < 0.01, ∗∗∗P < 0.001, ∗∗∗∗P < 0.0001. (A, C, D) Scale bar = 200 μm. (B) Top scale bar = 1 μm, bottom scale bar = 500 nm.
Fig. 8
Fig. 8
Schematic figure showing that the E-syt1 is a negative regulator of muscle function. E-syt1 hinders myoblast mitochondrial respiration and biosynthesis, reduces mitochondrial membrane potential, promotes mitochondrial fission, and results in mitochondria calcium overload and mitochondrial ROS burst. Meanwhile, E-syt1 also inhibits mitophagosome fusion with lysosomes and lysosomal acidification, reducing mitophagic flux.
figs1
figs1
figs2
figs2
figs3
figs3

References

    1. Yuan S., Larsson S.C. Epidemiology of sarcopenia: prevalence, risk factors, and consequences. Metabolism. 2023 doi: 10.1016/j.metabol.2023.155533. - DOI - PubMed
    1. Takegahara Y., Yamanouchi K., Nakamura K., Nakano S., Nishihara M. Myotube formation is affected by adipogenic lineage cells in a cell-to-cell contact-independent manner. Exp. Cell Res. 2014;324:105–114. doi: 10.1016/j.yexcr.2014.03.021. - DOI - PubMed
    1. Lee D.-C., Shook R.P., Drenowatz C., Blair S.N. Physical activity and sarcopenic obesity: definition, assessment, prevalence and mechanism. Future Sci. OA. 2016;2 doi: 10.4155/fsoa-2016-0028. - DOI - PMC - PubMed
    1. Kemmler W., von Stengel S., Engelke K., Sieber C., Freiberger E. Prevalence of sarcopenic obesity in Germany using established definitions. Osteoporos. Int. 2016;27:275–281. doi: 10.1007/s00198-015-3303-y. - DOI - PubMed
    1. Xie W.-Q., Xiao G.-L., Fan Y.-B., He M., Lv S., Li Y.-S. Sarcopenic obesity: research advances in pathogenesis and diagnostic criteria. Aging Clin. Exp. Res. 2021;33:247–252. doi: 10.1007/s40520-019-01435-9. - DOI - PubMed

Substances

LinkOut - more resources