. 2025 Jan;301(1):108075.
doi: 10.1016/j.jbc.2024.108075. Epub 2024 Dec 13.

Dysregulation of PI4P in the trans Golgi regions activates the mammalian Golgi stress response

Affiliations

Dysregulation of PI4P in the trans Golgi regions activates the mammalian Golgi stress response

Kanae Sasaki et al. J Biol Chem. 2025 Jan.

Abstract

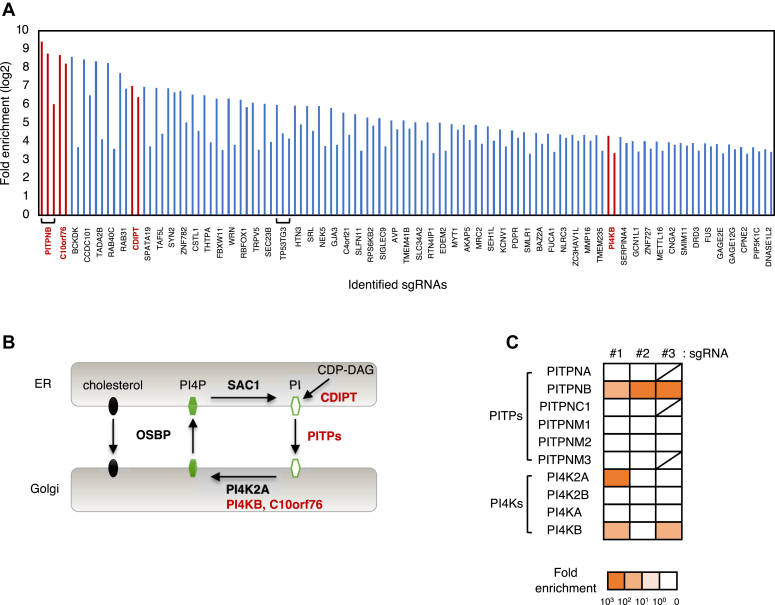
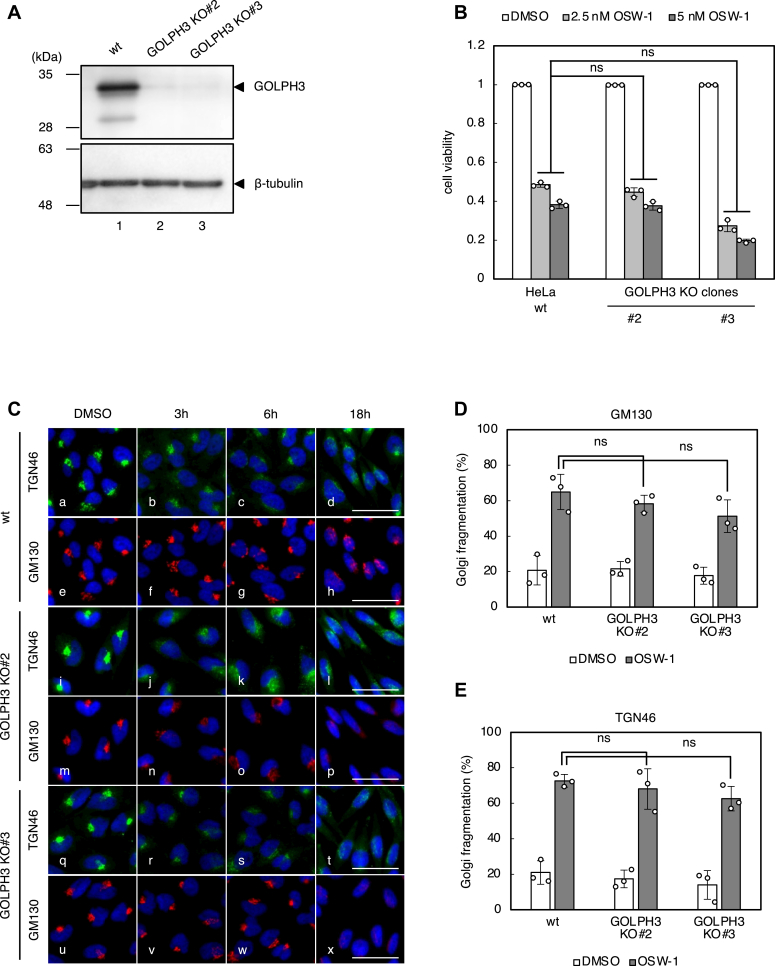
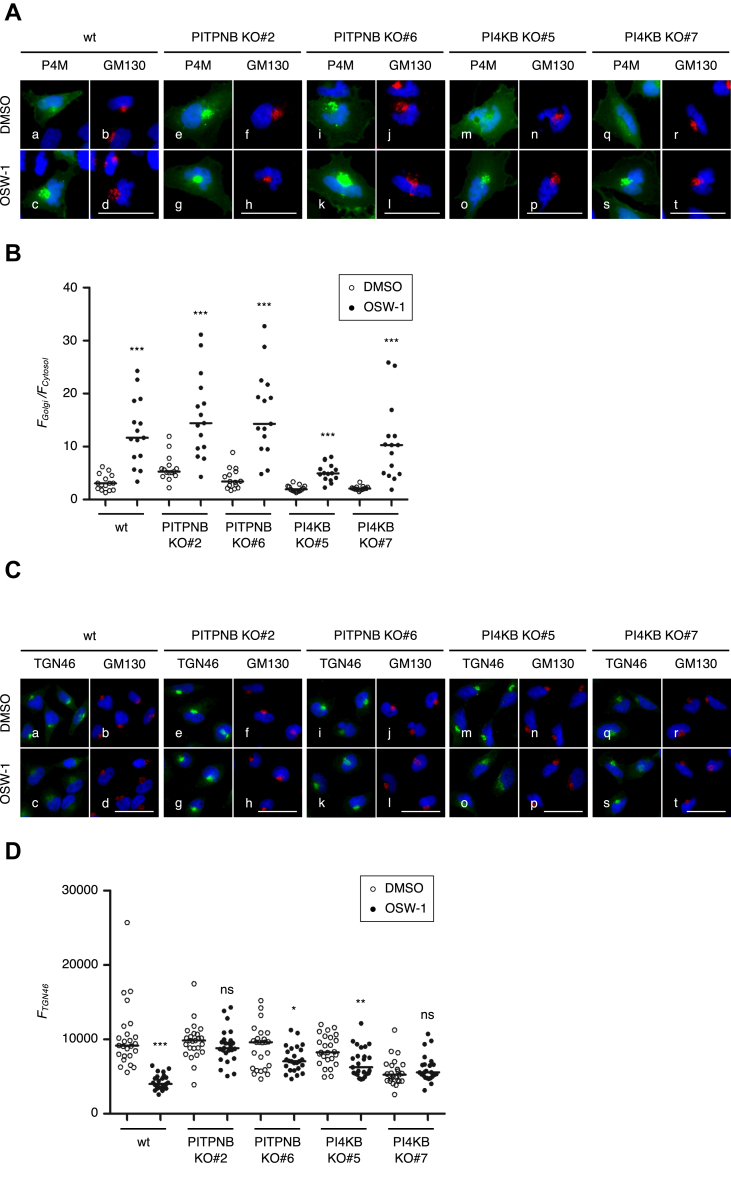
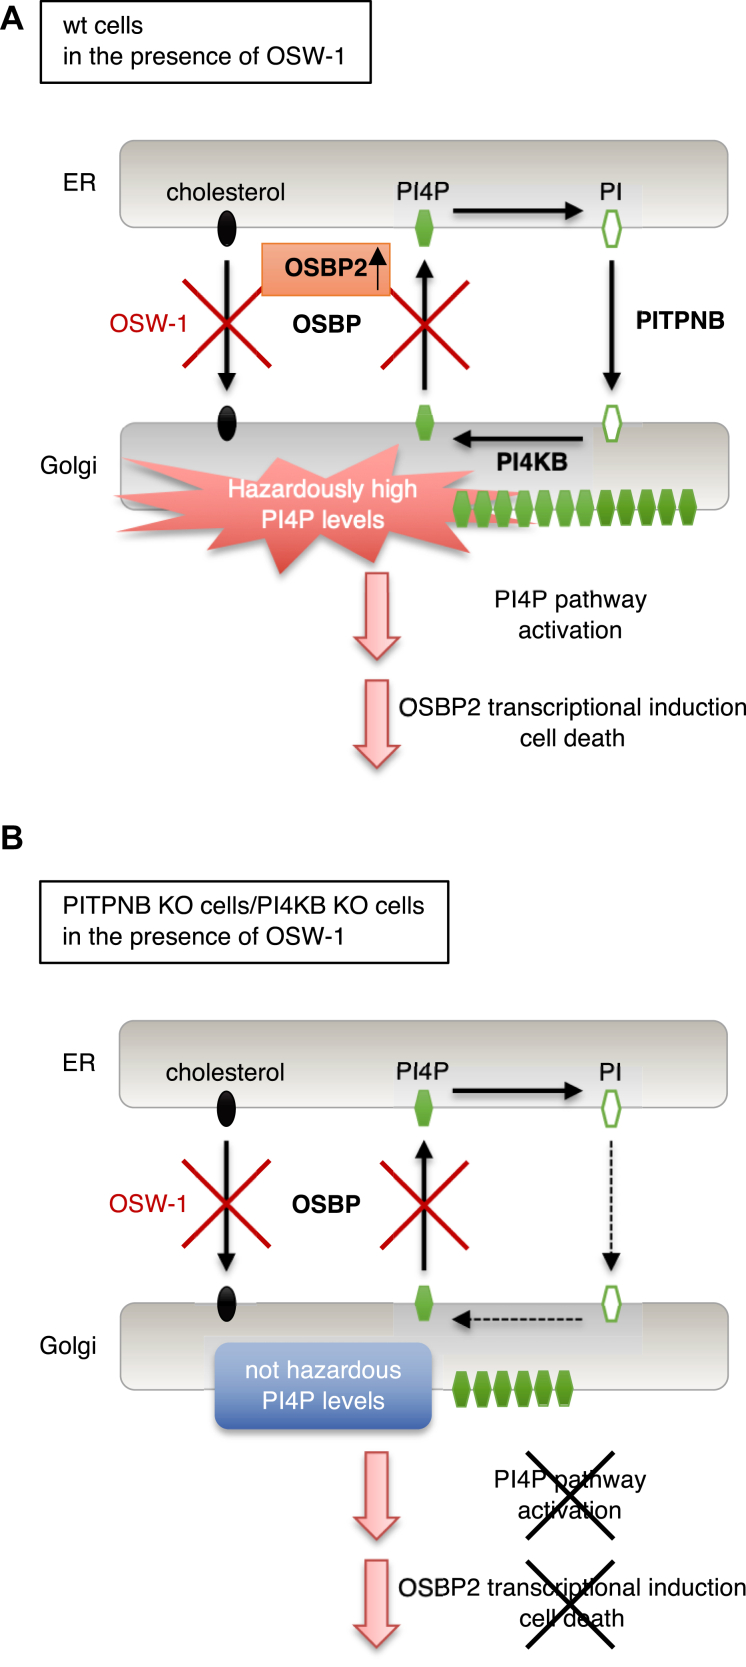
The Golgi stress response is an important cytoprotective system that enhances Golgi function in response to cellular demand, while cells damaged by prolonged Golgi stress undergo cell death. OSW-1, a natural compound with anticancer activity, potently inhibits OSBP that transports cholesterol and phosphatidylinositol-4-phosphate (PI4P) at contact sites between the endoplasmic reticulum and the Golgi apparatus. Previously, we reported that OSW-1 induces the Golgi stress response, resulting in Golgi stress-induced transcription and cell death. However, the underlying molecular mechanism has been unknown. To reveal the mechanism of a novel pathway of the Golgi stress response regulating transcriptional induction and cell death (the PI4P pathway), we performed a genome-wide KO screen and found that transcriptional induction as well as cell death induced by OSW-1 was repressed by the loss of regulators of PI4P synthesis, such as PITPNB and PI4KB. Our data indicate that OSW-1 induces Golgi stress-dependent transcriptional induction and cell death through dysregulation of the PI4P metabolism in the Golgi.

Keywords: Golgi stress response; OSW-1; cancer; phosphatidylinositol-4-phosphate; the genome-wide CRISPR-Cas9 KO screening.


Conflict of interest statement

Conflict of interest The authors declare that they have no conflicts of interest with the contents of this article.

Figures

Figure 1
Figure 1
The effect of OSW-1 treatment on transcription and the morphology of the Golgi. A, volcano plot showing differentially expressed genes in HeLa cells between groups treated with or without OSW-1. Total RNA extracted from HeLa cells treated with or without 5 nM OSW-1 for 18 h was subjected to RNA-seq analysis. Green (lipid metabolism-related), yellow (Golgi-related), and blue (other) dots represent significantly upregulated genes (FDR<0.05, Fold change>1.5). Gray dots represent downregulated and insignificantly differential expressed genes. BE, quantitative real-time PCR (qRT-PCR) analysis of OSBP and OSBP2 mRNA. Total RNA extracted from HeLa cells treated with or without OSW-1 (B and C) or OSBP-knockdown cells (D and E) was subjected to qRT-PCR. All mRNA levels were normalized to GAPDH mRNA, which was used as a reference. ∗p < 0.05 versus each control (analysis of variance followed by Dunnett’s test; mean ± S.D.; n = 4). F, immunofluorescence microscopic analysis of the Golgi. Wt HeLa cells were treated with or without 5 nM OSW-1 for 18 h and stained with murine anti-GM130 mAb (red, A and C), sheep anti-TGN46 pAb (green, B and D), and with DAPI (blue). The scale bars represent 10 μm. G, electron microscopy analysis of the Golgi. HeLa cells were treated without (A and B) or with 5 nM OSW-1 (C and D) for 18 h, and subjected to SEM analysis. The scale bars represent 500 nm. DAPI, 4′,6-diamidino-2-phenylindole; OSBP, oxysterol-binding protein; pAb, polyclonal antibody; RNA-seq, RNA sequencing; SEM, scanning electron microscopy; TGN, trans Golgi network.
Figure 2
Figure 2
Identification of genes involved in cell death induced by OSW-1 using GeCKO screening. A, identification of sgRNAs enriched in the OSW-1-resistant HeLa cells. Fold enrichment corresponds to the average of two independent experiments. Red bars show three sgRNAs targeting the PITPNB gene, two sgRNAs targeting the C10orf76 gene, 2 sgRNAs targeting the CDIPT gene, and 2 sgRNAs targeting the PI4KB gene. B, a schematic presentation of PI4P metabolism in the ER and the Golgi. Genes enriched in the screening are shown in red. C, heatmap showing fold enrichment of individual sgRNA (#1–3) targeting genes of PITPs and PI4Ks. The shaded lines mean that the third sgRNAs (#3) targeting PITPNA, PITPNC1, and PITPNM3 are not present. ER, endoplasmic reticulum; GeCKO, genome-wide CRISPR-Cas9 knockout; PI4K, PI 4-kinase; PI4P, phosphatidylinositol-4-phosphate; PITP, (PI)-transfer protein; sgRNA, single guide RNA.
Figure 3
Figure 3
OSW-1-induced cell death in PITPNB KO cells. A, immunoblot analysis of PITPNB protein. Wt HeLa cells and two individual clones (#2 and #6) of PITPNB KO cells were transfected with an empty vector (ctrl) or an expression plasmid of PITPNB (PITPNB). β-tubulin was used as a loading control. B, genomic sequences of exon 2 of human PITPNB gene in wt HeLa cells and PITPNB KO clones (#2 and #6). Deletion of two nucleotides was confirmed in both copies of the PITPNB gene in KO#2, resulting in a frameshift. Deletion of one nucleotide or six nucleotides was confirmed in each copy of the PITPNB gene in KO# 6. CF, cell viability assay. Wt HeLa cells and PITPNB KO clones (#2 and #6) were treated with or without the indicated concentrations of OSW-1, thapsigargin, or monensin for 48 h, and subjected to cell viability assay. ∗∗p < 0.01, ∗∗∗p < 0.001 versus wt cells supplemented with the same concentration of each reagent (the Bonferroni-corrected t test; mean ± S.D.; n = 3). ns, not significant. D, rescue experiments of PITPNB KO cells. Wt HeLa cells and PITPNB KO clones (#2 and #6) were transfected with an empty vector (ctrl) or an expression plasmid of PITPNB (PITPNB), treated with or without 5 nM OSW-1 for 48 h, and subjected to cell viability assay. ∗p < 0.05, ∗∗∗p < 0.001 (Student’s t test; mean ± S.D.; n = 4). PITP, (PI)-transfer protein.
Figure 4
Figure 4
OSW-1-induced cell death in PI4KB KO cells. A, immunoblot analysis of PI4KB protein in wt HeLa cells and two individual clones (#5 and #7) of PI4KB KO cells. β-tubulin was used as a loading control. B, genomic sequences of exon 7 of human PI4KB gene in wt HeLa cells and PI4KB KO clones (#5 and #7). Deletion of one nucleotide or two nucleotides was confirmed in each copy of the PI4KB gene in KO#5 and KO#7, resulting in a frameshift. C, cell viability assay. Wt HeLa cells and PI4KB KO clones (#5 and #7) were treated with or without the indicated concentrations of OSW-1 for 48 h, and subjected to cell viability assay. ∗p < 0.05 versus wt cells supplemented with the same concentration of each reagent (the Bonferroni-corrected t test; mean ± S.D.; n = 3). ns, not significant. D, cell viability assay. Wt HeLa cells were pretreated for 30 min with 500 nM PIK-93. Then the cells were treated with or without OSW-1 (2.5 nM or 5 nM) for 48 h without removal of PIK-93, and subjected to cell viability assay. ∗∗p < 0.01 versus wt cells supplemented with the same concentration of each reagent (Student’s t test; mean ± S.D.; n = 3). ns, not significant. E and F, cell viability assay. Wt HeLa cells and PI4KB KO clones (#5 and #7) were treated with or without the indicated concentrations of thapsigargin or monensin for 48 h, and subjected to cell viability assay. ∗p < 0.05 versus wt cells supplemented with the same concentration of each reagent (the Bonferroni-corrected t test; mean ± S.D.; n = 3). ns, not significant; PI4K, PI 4-kinase
Figure 5
Figure 5
Transcriptional induction of OSBP2 and FABP3 genes by OSW-1 in PITPNB KO and PI4KB KO cells. AD, qRT-PCR analysis of OSBP2 and FABP3 mRNA. Wt HeLa cells, PITPNB KO clones (#2 and #6), and PI4KB KO clones (#5 and #7) were treated with or without 5 nM OSW-1 for 18 h, and subjected to qRT-PCR analysis. All mRNA levels were normalized to GAPDH mRNA, which was used as a reference. ∗p < 0.05, ∗∗p < 0.01, ∗∗∗p < 0.001 (the Bonferroni-corrected t test; mean ± S.D.; n = 3). OSBP, oxysterol-binding protein; PITP, (PI)-transfer protein; PI4K, PI 4-kinase; qRT-PCR, quantitative real time PCR.
Figure 6
Figure 6
Golgi fragmentation by OSW-1 in PITPNB KO or PI4KB KO cells. A, immunofluorescence microscopic analysis of wt HeLa cells, PITPNB KO clones (#2 and #6), and PI4KB KO clones (#5 and #7) treated with or without 5 nM OSW-1 for the indicated time periods. Cells were stained with murine anti-GM130 mAb (red), sheep anti-TGN46 pAb (green), and DAPI (blue). The scale bars represent 50 μm. B and C, quantification of Golgi fragmentation in wt HeLa cells, PITPNB KO clones (#2 and #6), and PI4KB KO clones (#5 and #7) treated with or without 5 nM OSW-1 for 18 h. The percentage of cells with fragmented Golgi was calculated using images immunostained with anti-GM130 mAb or anti-TGN46 pAb. ∗p < 0.05, ∗∗p < 0.01 (the Bonferroni-corrected t test; mean ± S.D.; n = 3). DAPI, 4′,6-diamidino-2-phenylindole; mAb, monoclonal antibody; PITP, (PI)-transfer protein; PI4K, PI 4-kinase; pAb, polyclonal antibody; TGN, trans Golgi network.
Figure 7
Figure 7
Cell death and Golgi fragmentation by OSW-1 in GOLPH3 KO cells. A, immunoblot analysis of GOLPH3 protein in wt HeLa cells and two individual clones (#2 and #3) of GOLPH3 KO cells. β-tubulin was used as a loading control. B, cell viability assay. Wt HeLa cells and GOLPH3 KO clones (#2 and #3) were treated with or without the indicated concentrations of OSW-1 for 48 h, and subjected to cell viability assay. ns, not significant (the Bonferroni-corrected t test; mean ± S.D.; n = 3). C, immunofluorescence microscopic analysis of wt HeLa cells and GOLPH3 KO clones (#2 and #3) treated with or without 5 nM OSW-1 for the indicated time periods. Cells were stained with murine anti-GM130 mAb (red), sheep anti-TGN46 pAb (green), and DAPI (blue). The scale bars represent 50 μm. D and E, quantification of Golgi fragmentation in wt HeLa cells and GOLPH3 KO clones (#2 and #3) treated with or without 5 nM OSW-1 for 18 h. The percentage of cells with fragmented Golgi was calculated using images immunostained with anti-GM130 mAb or anti-TGN46 pAb. ns, not significant (the Bonferroni-corrected t test; mean ± S.D.; n = 3). DAPI, 4′,6-diamidino-2-phenylindole; mAb, monoclonal antibody; pAb, polyclonal antibody; TGN, trans Golgi network.
Figure 8
Figure 8
Glycosylation in the Golgi of PITPNB KO and PI4KB KO cells. A and B, immunoblot analysis of GM130, TGN46, and integrin β1 proteins. Whole cell lysates prepared from wt HeLa cells and PITPNB KO cells (A) or PI4KB KO cells (B), treated with or without 5 nM OSW-1 for 18 h, were subjected to immunoblot analysis. β-tubulin was used as a loading control. C, deglycosylation assay of TGN46 and integrin β1 proteins in wt HeLa cells treated with or without 5 nM OSW-1 for the indicated time periods. Deglycosylation enzymes used in this assay were as follows: N-glycanase, O-glycanase mix (O-glycanase, β (1–4) galactosidase and β-N-acetylglucosaminidase), and sialidase A. PITP, (PI)-transfer protein; PI4K, PI 4-kinase; TGN, trans Golgi network.
Figure 9
Figure 9
PI4P levels in the trans Golgi regions of PITPNB KO and PI4KB KO cells. A, microscopic observation of GFP-P4M (P4M) in the trans Golgi regions. Wt HeLa cells, PITPNB KO clones (#2 and #6), and PI4KB KO clones (#5 and #7) were transfected with an expression plasmid of GFP-P4M and treated with or without 20 nM OSW-1 for 1 h. Cells were stained with murine anti-GM130 mAb (red) and with DAPI (blue). The scale bars represent 50 μm. B, quantification of the fluorescent intensity of GFP-P4M-SidM in the trans Golgi regions of wt HeLa cells, PITPNB KO clones (#2 and #6) and PI4KB KO clones (#5 and #7) treated with or without 20 nM OSW-1 for 1 h. The dots represent the ratios of the fluorescent intensity of GFP-P4M-SidM in the trans Golgi regions to those in the cytosol. Central lines represent the median values (n = 15 cells). ∗∗∗p < 0.001 (Student’s t test). C, immunofluorescence microscopic analysis of wt HeLa cells, PITPNB KO clones (#2 and #6), and PI4KB KO clones (#5 and #7) treated with or without 20 nM OSW-1 for 1 h. Cells were stained with murine anti-GM130 mAb (red), sheep anti-TGN46 pAb (green), and DAPI (blue). The scale bars represent 50 μm. D, quantification of the fluorescent intensity of TGN46 in wt HeLa cells, PITPNB KO clones (#2 and #6), and PI4KB KO clones (#5 and #7) treated with or without 20 nM OSW-1 for 1 h. The dots represent the fluorescent intensity of TGN46, which was calculated using images immunostained with anti-TGN46 pAb. Central lines represent the median values (n = 25 cells). ∗p < 0.05, ∗∗p < 0.01, ∗∗∗p < 0.001 (Student’s t test). ns, not significant. DAPI, 4′,6-diamidino-2-phenylindole; mAb, monoclonal antibody; PI4P, phosphatidylinositol-4-phosphate; PITP, (PI)-transfer protein; PI4K, PI 4-kinase; pAb, polyclonal antibody; TGN, trans Golgi network.
Figure 10
Figure 10
Our working hypothesis for the activation of the PI4P pathway of the Golgi stress response. A, In wt cells, treatment of OSW-1 inhibits OSBP, leading to the accumulation of PI4P in the trans Golgi regions, which causes Golgi fragmentation, OSBP2 transcriptional induction through the activation of the PI4P pathway and cell death. B, in contrast, PITPNB or PI4KB KO cells are presumed to exhibit lower levels of PI4P upon treatment of OSW-1 since the PITPNB and PI4KB genes are involved in PI4P synthesis. Therefore, in PITPNB KO or PI4KB KO cells, OSW-1 treatment seems not to induce overaccumulation of PI4P at concentrations high enough to activate the PI4P pathway. As a result, cell death is suppressed in these KO cells. OSBP, oxysterol-binding protein; PI4P, phosphatidylinositol-4-phosphate; PI4K, PI 4-kinase; PITP, (PI)-transfer protein.

References

    1. Karagöz G.E., Acosta-Alvear D., Walter P. The unfolded protein response: detecting and responding to fluctuations in the protein-folding capacity of the endoplasmic reticulum. Cold Spring Harb. Perspect. Biol. 2019;11 - PMC - PubMed
    1. Ron D., Harding H.P. Protein-folding homeostasis in the endoplasmic reticulum and nutritional regulation. Cold Spring Harb. Perspect. Biol. 2012;4 - PMC - PubMed
    1. Mori K. The unfolded protein response: the dawn of a new field. Proc. Jpn. Acad. Ser. B Phys. Biol. Sci. 2015;91:469–480. - PMC - PubMed
    1. Kimata Y., Kohno K. Endoplasmic reticulum stress-sensing mechanisms in yeast and mammalian cells. Curr. Opin. Cell Biol. 2011;23:135–142. - PubMed
    1. Hetz C., Zhang K., Kaufman R.J. Mechanisms, regulation and functions of the unfolded protein response. Nat. Rev. Mol. Cell Biol. 2020;21:421–438. - PMC - PubMed

Publication types

MeSH terms

Substances

LinkOut - more resources