. 2024 Jan-Dec;16(1):2438829.
doi: 10.1080/19490976.2024.2438829. Epub 2024 Dec 15.

The microbiota metabolite, phloroglucinol, confers long-term protection against inflammation

Affiliations

The microbiota metabolite, phloroglucinol, confers long-term protection against inflammation

Janire Castelo et al. Gut Microbes. 2024 Jan-Dec.

Abstract

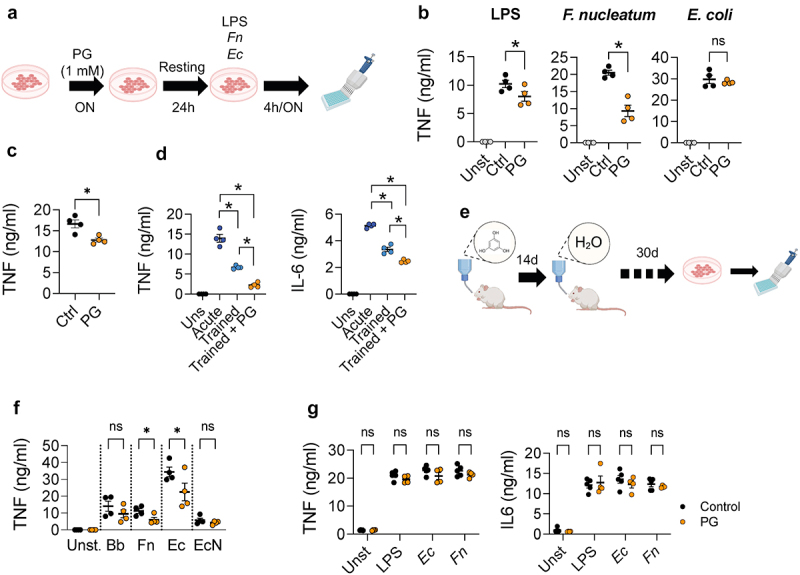
Phloroglucinol is a key byproduct of gut microbial metabolism that has been widely used as a treatment for irritable bowel syndrome. Here, we demonstrate that phloroglucinol tempers macrophage responses to pro-inflammatory pathogens and stimuli. In vivo, phloroglucinol administration decreases gut and extraintestinal inflammation in murine models of inflammatory bowel disease and systemic infection. The metabolite induces modest modifications in the microbiota. However, the presence of an active microbiota is required to preserve its anti-inflammatory activity. Remarkably, the protective effect of phloroglucinol lasts partially at least 6 months. Single-cell transcriptomic analysis of bone marrow progenitors demonstrates the capacity of the metabolite to induce long-lasting innate immune training in hematopoietic lineages, at least partially through the participation of the receptor and transcription factor, aryl hydrocarbon receptor (AhR). Phloroglucinol induces alterations in metabolic and epigenetic pathways that are most prevalent in upstream progenitors as hallmarks of central trained immunity. These data identify phloroglucinol as a dietary-derived compound capable of inducing central trained immunity and modulating the response of the host to inflammatory insults.

Keywords: Microbiota byproducts; central trained immunity; inflammation; phenolic derivatives.


Conflict of interest statement

No potential conflict of interest was reported by the author(s).

Figures

Figure 1.
Figure 1.
Phloroglucinol modulates pro-inflammatory macrophage responses to Crohn´s related pathobionts. (a) Effect of increasing concentrations (0, 0.01, 0.1 and 1 mM) of phloroglucinol and a panel of chemically related compounds (phloretic acid -PhAc, methyl gallate -MG, gallic acid -GA, pyrogallol -PYR and phloretin -Ph) on BMM cell viability. The chemical structure is represented below the graphs. (b) Effect of 10 mM phloroglucinol (PG) on BMM viability. TNF production in response to LPS in the presence of different concentrations of phloroglucinol (orange, c) and phloretic acid (d). TNF and IL-6 production by BMMs exposed to 1 mM phloroglucinol and stimulated with F. nucleatum (e) and E. coli (f). Unexposed controls (black) and phloroglucinol (PG) (orange). The figures constitute a representative experiment with the results from 3–4 independent mice. Maximal growth capacity, measured as absorbance at 600 nm after 48 h of F. nucleatum (g, h)) and 24 h of E. coli (i) in the absence (control; black) or presence of phloroglucinol (orange) or EtOH controls (grey). (j) Maximal growth capacity measured as absorbance at 600 nm and CFU/ml after 48 h of A. muciniphila growth in the presence (orange) or absence (black) of phloroglucinol or EtOH controls (grey). *, p < 0.05, **, p < 0.01, ***, p < 0.001, ****. p < 0.0001; one-way ANOVA.
Figure 2.
Figure 2.
Oral intake of phloroglucinol induces a protective effect in intestinal and extraintestinal inflammatory models. (a) Experimental design: mice were administered phloroglucinol for 14 days in the drinking water, then 3% DSS in water for 6 days, followed by 2 days of no supplemented water. DAI (b) and weight loss (c) over the experimental period in dss-treated mice previously administered phloroglucinol (orange) or vehicle (black) and controls without DSS administration previously treated with phloroglucinol (light yellow) or vehicle (light grey); data are expressed as means  ±  SEM (n = 6); *p < 0.05 versus DSS control group. (d) MPO activity in mice treated with phloroglucinol (orange) or vehicle (black). Histopathological scores (e) and representative micrographs (f) of colonic tissue in mice treated with phloroglucinol (orange) and controls (black). Phloroglucinol detection in feces (g), urine (h) and serum (i) of treated (orange) and control mice (black). (j) Experimental design for the experiments testing the effect of phloroglucinol in the murine model of Lyme borreliosis. Tnf (K), Adgre1 (l) and B. burgdorferi RecA (m) gene expression relative to Rpl19 in the heart of phloroglucinol- (orange) and control-treated (black), infected mice, determined by real-time PCR. UI: uninfected mice. The data shown are representative of at least 2 independent experiments.
Figure 3.
Figure 3.
Phloroglucinol minimally modifies microbiota composition. (a) Experimental design: mice received phloroglucinol for 14 days, then 3% DSS for 6 days, followed by 2 days of regular drinking water. Fecal samples were taken for microbiota analysis at the end of the treatment and after DSS administration. (b) Alpha diversity indices for fecal microbiomes across different experimental groups. (c) Microbiota composition at the phylum level. (d) Beta diversity plots: PCoA, NMDS and CCA. (e) Operational taxonomic units significantly different (q < 0.05 FDR) between phloroglucinol-treated and untreated mice after DSS administration. The right side represents OTU’s with a log2 fold positive difference for mice treated with phloroglucinol versus untreated mice while the right side is the negative fold change. Each point represents a single OTU colored by phylum and grouped by taxonomic family level, while the size of the points reflects the adjusted p value. (f) Maximum growth capacity measured as absorbance at 600 nm of P. copri growth in the presence (orange) and absence (black) of phloroglucinol or EtOH controls (grey). (g) Fecal SCFAs levels in phloroglucinol-treated and control mice, analyzed at the end of the treatment (14 d).
Figure 4.
Figure 4.
Phloroglucinol induces innate immune training. (a) Experimental design: BMMs were initially stimulated overnight (ON) with phloroglucinol and were left to rest for 24 hours. The macrophages were then stimulated with LPS, F. nucleatum and E. coli (b) TNF production by BMMs, pre-exposed (orange) or not (black) to phloroglucinol (PG) and stimulated with LPS, F. nucleatum and E. coli. The grey dots represent unstimulated cells. (c) TNF production by BMMs, pre-exposed (orange) or not (black) to phloroglucinol (PG) and stimulated with B. burgdorferi. (d) TNF and IL-6 production by BMMs acutely stimulated (purple) or re-stimulated with B. burgdorferi in the presence (orange) or absence of phloroglucinol. (e) Experimental design: mice were administered phloroglucinol for 14 days, followed by 30 days of no supplemented water. BMMs were then generated and stimulated. (f) TNF produced by BMMs from phloroglucinol-treated (orange) and control (black) mice in response to stimulation with B. burgdorferi (Bb), F. nucleatum (Fn), a clinical E. coli isolate (Ec) and E. coli Nissle 1917 (En). (g) TNF and IL-6 release by BMMs obtained from germ-free mice pre-treated with phloroglucinol (orange) and controls (black), and stimulated with LPS, F. nucleatum and E. coli.
Figure 5.
Figure 5.
Phloroglucinol induces central trained immunity. (a) UMAP embedding of 3,217 sorted Lin cKit+ hematopoietic stem and progenitor cells from control and phloroglucinol-treated animals. (b) Dot plot showing average expression of selected HSPC markers and cell cycle genes. The dot size corresponds to the fraction of cells expressing each gene, and the dot color intensity represents mean expression values. Pathway analysis (GO-BP) of differentially expressed genes (DEGs) within all cells in the dataset (c), cluster a (d), and clusters B-D (e). (f) Transcription factor motifs associated with upregulated genes in restricted myeloid progenitors. (g) Venn diagram showing genes co- or differentially regulated by the transcription factors GFI1B, SP1, and PU.1-IRF. HSC, hematopoietic stem cell; MPP, multipotent progenitor. (h) Dot plot showing average expression of Ahr, Arnt, and Ahrr in selected clusters. The dot size corresponds to the fraction of cells expressing each gene, and the dot color intensity represents the mean expression value. (i) CYP1A1 enzyme activity (EROD, ethoxyresorufin-O-deethylase) in BMMs stimulated with 1 mM phloroglucinol or vehicle (ethanol) for 24 h. (j) CYP1A1 enzyme activity in colonic tissues of mice given phloroglucinol or vehicle. Data are from two independent experiments and shown as fold induction compared to their respective controls. (k) TNF production by BMMs generated from wild type and AhR-deficient mice. The mice were treated with phloroglucinol as described in Figure 4(f). ns, not significant, *, p < 0.05.
Figure 6.
Figure 6.
Phloroglucinol induces long-term protection in intra- and extra-intestinal murine models of inflammatory disorders. (a) Experimental design: mice were treated for 14 days with phloroglucinol in the drinking water, followed by 30 days of resting. The mice were then induced IBD with a 3% solution of DSS for 6 days, followed by 2 days of resting. DAI (b) and weight loss (c) over the experimental period in DSS-induced mice, phloroglucinol-treated mice (orange) and controls (black). Data are expressed as means ± sem (n = 4–5); *p < 0.05 versus DSS control group. (d) MPO activity in mice treated with phloroglucinol (orange) and controls (black). Histopathological scores (e) and representative micrographs (f) of colonic tissue of mice treated with phloroglucinol (orange) and controls (black). Tnf (g), Adgre1 (h) gene expression and B. burgdorferi recA (i) DNA levels relative to murine Rpl19 in the heart of phloroglucinol-treated, infected mice (orange), control-treated infected animals (black) and uninfected mice treated (yellow) or not (grey) with phloroglucinol as determined by cDNA real-time PCR relative to Rpl19. DAI (j) and weight loss (k) of mice treated with phloroglucinol for 14 days, followed by a resting period of six months. The mice were then induced IBD with 3% DSS in sterile water for 6 days, followed by 2 days of resting. The orange dots represent the DSS-induced, phloroglucinol-treated mice. The black dots represent DSS-induced controls. The data are expressed as means ± sem (n = 5); *p < 0.05 versus DSS control group. (l) MPO activity in mice treated with phloroglucinol (orange) and controls (black), and rested for 6 months. Histopathological scores (m) and representative micrographs (n) of colonic tissue in mice treated with phloroglucinol (orange) and controls (black), and rested for 6 months.

References

    1. Tomas-Barberan FA, Selma MV, Espin JC.. Interactions of gut microbiota with dietary polyphenols and consequences to human health. Curr Opin Clin Nutr Metab Care. 2016;19(6):471–22. doi:10.1097/MCO.0000000000000314. - DOI - PubMed
    1. Schulthess J, Pandey S, Capitani M, Rue-Albrecht KC, Arnold I, Franchini F, Chomka A, Ilott NE, Johnston DGW, Pires E, et al. The short chain fatty acid butyrate imprints an antimicrobial program in macrophages. Immunity. 2019;50(2):432–45 e7. doi:10.1016/j.immuni.2018.12.018. - DOI - PMC - PubMed
    1. Oh SF, Praveena T, Song H, Yoo JS, Jung DJ, Erturk-Hasdemir D, Hwang YS, Lee CC, Le Nours J, Kim H, et al. Host immunomodulatory lipids created by symbionts from dietary amino acids. Nature. 2021;600(7888):302–307. doi:10.1038/s41586-021-04083-0. - DOI - PMC - PubMed
    1. Steed AL, Christophi GP, Kaiko GE, Sun L, Goodwin VM, Jain U, Esaulova E, Artyomov MN, Morales DJ, Holtzman MJ, et al. The microbial metabolite desaminotyrosine protects from influenza through type I interferon. Science. 2017;357(6350):498–502. doi:10.1126/science.aam5336. - DOI - PMC - PubMed
    1. Stutz MR, Dylla NP, Pearson SD, Lecompte-Osorio P, Nayak R, Khalid M, Adler E, Boissiere J, Lin H, Leiter W, et al. Immunomodulatory fecal metabolites are associated with mortality in COVID-19 patients with respiratory failure. Nat Commun. 2022;13(1):6615. doi:10.1038/s41467-022-34260-2. - DOI - PMC - PubMed

MeSH terms

Substances

LinkOut - more resources