. 2024 Jan-Dec;16(1):2431648.
doi: 10.1080/19490976.2024.2431648. Epub 2024 Dec 16.

Abnormalities in gut virome signatures linked with cognitive impairment in older adults

Affiliations

Abnormalities in gut virome signatures linked with cognitive impairment in older adults

Adewale S James et al. Gut Microbes. 2024 Jan-Dec.

Abstract

Multiple emerging lines of evidence indicate that the microbiome contributes to aging and cognitive health. However, the roles of distinct microbial components, such as viruses (virome) and their interactions with bacteria (bacteriome), as well as their metabolic pathways (metabolome) in relation to aging and cognitive function, remain poorly understood. Here, we present proof-of-concept results from a pilot study using datasets (n = 176) from the Microbiome in Aging Gut and Brain (MiaGB) consortium, demonstrating that the human virome signature significantly differs across the aging continuum (60s vs. 70s vs. 80+ years of age) in older adults. We observed that the predominant virome signature was enriched with bacteriophages, which change considerably with aging continuum. Analyses of interactions between phages and the host bacteriome suggest that lytic or temperate relationships change distinctly across the aging continuum, as well as cognitive impairment. Interestingly, the phage-bacteriome-metabolome interactions develop unique patterns that are distinctly linked to aging and cognitive dysfunction in older adults. The phage-bacteriome interactions affect bacterial metabolic pathways, potentially impacting older adults' health, including the risk of cognitive decline and dementia. Further comprehension of these studies could provide opportunities to target the microbiome by developing phage therapies to improve aging and brain health in older adults.

Keywords: Virome; aging; cognition; dementia; gut; microbiome; phage.


Conflict of interest statement

Drs. Hariom Yadav is co-founder and chief scientific officer of Postbiotics Inc; and he is co-founder of BiomAge Inc, MusB LLC and MusB Research LLC with Dr. Shalini Jain. However, other authors have no conflict of interest in studies and results described in this manuscript.

Figures
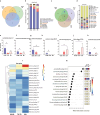
Figure 1.
Figure 1.
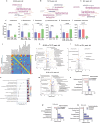
Gut virome signature changes with the aging continuum in older adults. a, c) Venn diagram showing shared and unique viral families (a) and species (c) among older adults with ages 60–69, 70–79, and 80 and over years of age. b) bar charts showing the relative abundance (%) of viral families (b) and species (d) among participants 60s, 70s, and 80+ years of age. e–k) significantly differentially abundant viral species among the 60s, 70s, and 80+ groups. l, m) clustering heatmap showing the differentially abundant viral species (l) and random forest analysis of the topmost differentially abundant 15 viral species among the three groups of older adults according to the aging continuum. Data are expressed as mean ± standard error of the mean for n = 62 for the 60–69 years age group, n = 78 for the 70–79 years age group, and n = 36 for the 80+ years age group. *p values < 0.05 analyzed using unpaired t-tests with the Mann-Whitney U test are statistically significant.
Figure 2.
Figure 2.
Changes in the virome, bacteria (bacteriome) and their metabolic pathways with the aging continuum in the guts of older adults. a–c) word cloud analyses showing the frequency of phage genera among the 60-69, 70-79, and 80+ years age groups. d–i) bar charts showing the mean abundances of host bacteria for phages among the three groups. j) correlation matrix plot showing the bacteria host-phage relationship (red color indicates negative correlation, while yellow color shows positive correlation), built with Pearson correlation coefficient (r) values between the host bacteria and phages. n) random forest analysis of the top 15 metabolic pathways as predicted by HuMANN (blue color = low abundance, red color = high, and yellow color = intermediate), comparing 60s vs. 70s (k), 70s vs. 80+ (l), and 60s vs. 80+ (m) groups. k–m) volcano plots showing the upregulated (blue) and downregulated (red) microbial metabolic pathways. o–q) bar charts showing the changes in the predicted metabolite profiles of the microbiome within the aging continuum (log2 fold change) comparing 60s vs. 70s (o), 70s vs. 80+ (p), and 60s vs. 80+ (q) groups. Data are expressed as mean ± standard error of the mean for n = 62 for the 60–69 years of age group; n = 78 for the 70–79 years of age group; and n = 36 for the 80+ years of age group. P-values analyzed using unpaired t-tests with Mann-Whitney U tests are statistically significant.
Figure 3.
Figure 3.
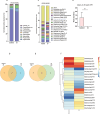
The gut of cognitively impaired (CI) older adults harbors a distinct virome compared to their control counterparts. a, c) stacked bar charts showing the relative abundances (%) of viral families (a) and species (c) in older adults with CI compared to the controls. b) venn diagram showing shared and unique viral families (b) and species (d) between control subjects. e) bar chart showing the differential mean abundance of the selected phage species Clostridium phage vB SpeS CP51 between CI and control groups. f) hierarchical clustering heatmap of the top 20 selected phages showing clustering according to cognitive function in older adults. Data are presented as mean ± standard error of the mean for n = 111 (controls) and n = 65 (CI) groups. *p-values <0.05, analyzed using unpaired t-tests with Mann-Whitney U test, are statistically significant.
Figure 4.
Figure 4.
The phageome-bacteriome-metabolome axis shows significant differences in the gut of older adults with CI compared to their cognitively healthy controls. a, b) word clouds showing the frequency of phage genera between control and CI subjects. (c-e) bar charts showing the mean abundances of host bacteria for significantly different phages in CI versus control groups. f) correlation matrix plot showing the bacteria-host-phage relationship (red color indicates negative correlation while yellow indicates positive correlation). g) volcano plots showing the upregulated (blue) and downregulated (red) microbial metabolic pathways, based on Pearson correlation coefficients (r values) between bacteria, hosts, and phages, stratified by the cognitive status of older adults. h) random forest analysis (RFA) of the top 15 metabolic pathways as predicted by HuMANN (blue color = low abundance, red color = high abundance, yellow color = intermediate abundance) between control and CI groups. i) bar charts showing the changes in the predicted microbial metabolite profiles (log2 fold change) between control and CI subjects. Data are presented as mean ± standard error of the mean for n = 111 (controls) and n = 65 (CI) groups. P-values analyzed using unpaired t-tests with Mann-Whitney U tests are statistically significant.
Figure 5.
Figure 5.
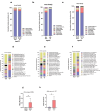
a-c) bar graphs showing the viral families (a-c) and species (d-f) for age-matched subjects (control vs. CI aged 60-69 [a, d], control vs. CI aged 70-79 [b, e], control vs. CI aged 80+ [c, f]). Bar graphs show the mean abundances of selected viral species between age-matched controls and CI in the 60-69 age group. P-values were analyzed using unpaired t-tests with Mann-Whitney U test and are statistically significant.
Figure 6.
Figure 6.
Unique phage-bacteria-metabolic pathway networks emerge with the aging continuum and cognitive impairment (CI) in the gut of older adults. a) phage-gutbacteria-metabolic pathway-metabolite interaction networks are distinct in 60s vs. 70s (a), 70s vs. 80+ (b), 60s vs. 80+ (c), as well as in CI vs. controls (d). Networks were built in Gephi, with phages, bacteria, metabolic pathways, and predicted metabolites as nodes, and the correlation coefficient between each component used as the edges to establish connections. Blue color indicates highly positive correlations, while red color indicates highly negative correlations. The size of nodes corresponds to the percentage abundance, and the thickness of edges represents the strength of correlation. Other intermediate colors represent weakly correlated relationships; light green colors are weakly positively correlated while the brown colors are weakly negatively correlated.

References

    1. Langa KM. 2018. Cognitive aging, dementia, and the future of an aging population. In: Majmundar MK, Hayward MD, editors. Future directions for the demography of aging: Proceedings of a workshop. Washington (DC): National Academies Press. p. 75–20. - PubMed
    1. Nandi A, Counts N, Bröker J, Malik S, Chen S, Han R, Klusty J, Seligman B, Tortorice D, Vigo D, et al. Cost of care for Alzheimer’s disease and related dementias in the United States: 2016 to 2060. Npj Aging. 2024;10(1):13. doi:10.1038/s41514-024-00136-6. - DOI - PMC - PubMed
    1. Li X, Feng X, Sun X, Hou N, Han F, Liu Y. Global, regional, and national burden of Alzheimer’s disease and other dementias, 1990–2019. Front Aging Neurosci. 2022;14:937486. doi:10.3389/fnagi.2022.937486. - DOI - PMC - PubMed
    1. Cohen AA, Ferrucci L, Fülöp T, Gravel D, Hao N, Kriete A, Levine ME, Lipsitz LA, Olde Rikkert MGM, Rutenberg A, et al. A complex systems approach to aging biology. Nat Aging. 2022;2(7):580–591. doi:10.1038/s43587-022-00252-6. - DOI - PMC - PubMed
    1. Sun Y, Baptista LC, Roberts LM, Jumbo-Lucioni P, McMahon LL, Buford TW, Carter CS. The gut microbiome as a therapeutic target for cognitive impairment. J Gerontology: Ser A. 2020;75(7):1242–1250. doi:10.1093/gerona/glz281. - DOI - PMC - PubMed

MeSH terms

LinkOut - more resources