. 2024 Nov 29:15:1473909.
doi: 10.3389/fimmu.2024.1473909. eCollection 2024.

ID1 and ID3 functions in the modulation of the tumour immune microenvironment in adult patients with B-cell acute lymphoblastic leukaemia

Affiliations

ID1 and ID3 functions in the modulation of the tumour immune microenvironment in adult patients with B-cell acute lymphoblastic leukaemia

Nathaly Poveda-Garavito et al. Front Immunol. .

Abstract

Introduction: B-cell acute lymphoblastic leukemia (B-ALL) in adults often presents a poor prognosis. ID1 and ID3 genes have been identified as predictors of poor response in Colombian adult B-ALL patients, contributing to cancer development. In various cancer models, these genes have been associated with immune regulatory populations within the tumor immune microenvironment (TIME). B-ALL progression alters immune cell composition and the bone marrow (BM) microenvironment, impacting disease progression and therapy response. This study investigates the relationship between ID1 and ID3 expression, TIME dynamics, and immune evasion mechanisms in adult B-ALL patients.

Methods: This exploratory study analysed BM samples from 10 B-ALL adult patients diagnosed at the National Cancer Institute of Colombia. First, RT-qPCR was used to assess ID1 and ID3 expression in BM tumour cells. Flow cytometry characterised immune populations in the TIME. RNA-seq evaluated immune genes associatedwith B-ALL immune response, while xCell and CytoSig analysed TIME cell profiles and cytokines. Pathway analysis, gene ontology, and differential gene expression (DEGs) were examined, with functional enrichment analysis performed using KEGG ontology.

Results: Patients were divided into two groups based on ID1 and ID3 expression, namely basal and overexpression. A total of 94 differentially expressed genes were identified between these groups, with top overexpressed genes associated with neutrophil pathways. Gene set enrichment analysis revealed increased expression of genes associated with neutrophil degranulation, immune response-related neutrophil activation, and neutrophil-mediated immunity. These findings correlated with xCell data. Overexpression group showed significant differences in neutrophils, monocytes and CD4+ naive T cells compared to basal group patients. Microenvironment and immune scores were also significantly different, consistent with the flow cytometry results. Elevated cytokine levels associated with neutrophil activation supported these findings. Validation was performed using the Therapeutically Applicable Research to Generate Effective Treatments (TARGET) TCGA B-ALL cohorts.

Discussion: These findings highlight significant differences in ID1 and ID3 expression levels and their impact on TIME populations, particularly neutrophil-related pathways. The results suggest a potential role for ID1 and ID3 in immune evasion in adult B-ALL, mediated through neutrophil activation and immune regulation.

Keywords: B-cell acute lymphoblastic leukaemia (B-ALL); bone marrow; immune evasion; immune system; immunosurveillance; microenvironment.


Conflict of interest statement

The authors declare that the research was conducted in the absence of any commercial or financial relationships that could be construed as a potential conflict of interest.

Figures

Figure 1
Figure 1
Comparison of expression levels of ID1 and ID3 in B-ALL patients categorised into high and basal expression groups. (A) ID1 expression levels showed no statistically significant differences between the groups (p=0.1049) (ID1 High n = 2; ID1 basal n = 5). (B) In contrast, ID3 expression levels revealed a significant difference (p=0.02421), indicated by the asterisk (*) (ID3 High n = 4; ID3 basal n = 6). Gene expression was quantified with levels normalised to GAPDH as internal control. Patients were classified based on RT-qPCR results, with high expression defined as values above the 75th percentile of fold-change from the 2^(-ΔΔCt) calculation. The y-axis represents fold-change in gene expression relative to the control sample, reflecting the differential expression of ID1 and ID3 in LC. Statistical analysis was performed using the Mann-Whitney U test. Statistical significance was determined with p-values of < 0.05. Not significant (ns).
Figure 2
Figure 2
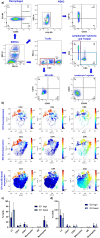
The expression of ID1 and ID3 is correlated with CD3-negative cells. (A) Gating strategy for TIME cells assessed by flow cytometry. (B) t-SNE analysis of flow cytometry data using the OMIQ platform (high expression represented in red and low expression in blue). (C) All cell population data combining sample/patient groups with statistical tests comparing populations based on high and low expression of ID1. Mann-Whitney U test were conducted to assess differences, and global differences among populations according to ID1 expression levels were also evaluated. (ID1 High n = 2; ID1 basal n = 5) (D) Comparison of cell populations based on high and low expression of ID3, evaluated in the same manner as for ID1 (ID3 High n = 4; ID3 basal n = 6). Additionally, in Panel (C, D), all populations with high and low ID1 and ID3 levels were compared. No significant changes were observed in CD4-positive or CD8-positive populations. A Wilcoxon test showed a significant difference between low and high ID1 groups (p = 0.0083). Similarly, a significant difference was found between ID3 expression groups (p = 0.0292). Statistical significance was determined with p-values of < 0.05.
Figure 3
Figure 3
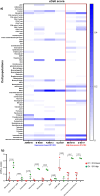
Changes in immune cell populations within the TIME according to ID1 and ID3 expression in B-ALL patients. (A) Heatmap generated using xCell analysis, illustrating the relative abundance of immune cell types in patients stratified by ID1 and ID3 expression levels. Patients with overexpression of ID1 or ID3 are highlighted in the table (red box). The x-axis represents different immune cell types, while the y-axis lists the patients grouped according to ID1/ID3 expression levels. Shades of blue represent the abundance of immune cell types, with darker shades indicating higher proportions. (B) Quantitative comparison of immune cell populations in the TIME between ID1/ID3 high (n = 2) and ID1/ID3 basal (n = 4) expression groups. Immune cell populations analysed include basophils, CD4+ naive T cells, eosinophils, monocytes, neutrophils, NK cells, plasmocytes, and macrophage subsets. The xCell scores for each immune population are plotted on the y-axis, with red dots representing the ID1/ID3 basal group and green dots representing the ID1/ID3 high group. Differences in immune cell populations between groups were assessed using the Mann-Whitney U test. Statistically significant differences are indicated, with p-values for each cell type provided above the corresponding comparisons. A p-value threshold of < 0.05 was considered statistically significant.
Figure 4
Figure 4
Impact of ID1 and ID3 overexpression on genes associated with neutrophil degranulation. (A) Heatmap of differential Expression of Genes between overexpressing conditions and basal Expression Levels of ID1 and ID3. (B) Volcano plot overexpression ID1 and ID3 vs basal expression ID1 and ID3. (C) Enrichment Analysis comparing ID1 and ID3 overexpression with basal expression Levels. (D) STRING analysis depicting interactions between genes in ID1 and ID3 overexpression compared to basal expression levels. (E) Gene ontology analysis highlighting differences in ID1 and ID3 overexpression versus basal expression levels.
Figure 5
Figure 5
Kaplan-Meier survival curve for overall survival based on ID1 and ID3 expression levels in B-ALL patients from the (n = 2) TCGA database (25). Patients were categorised into three groups: (A) low ID1 expression (n = 36), which showed significantly improved survival outcomes, suggesting a protective effect against aggressive disease (p = 0.004631); (B) low ID3 expression (n = 34), indicating a trend towards better survival (p = 0.1232); and (C) high concurrent expression of both ID1 and ID3 (n = 22), which exhibited the poorest survival outcomes among the groups (p = 0.01840). The statistical significance of these findings was confirmed using a log-rank test, with p-values less than 0.05 indicating significance.
Figure 6
Figure 6
Functional enrichment and protein-protein interaction analyses of differentially expressed genes associated with ID1 and ID3 expression in B-ALL from the TARGET TCGA dataset. (A) GO enrichment analysis for Biological Processes, highlighting processes influenced by ID1 overexpression, such as neutrophil-mediated immunity, immune response, and DNA damage checkpoint signalling. (B) KEGG pathways enrichment analysis for ID1 overexpression group indicating significant pathways related to immune modulation and cancer, (C) Enrichment Analysis (KEGG pathways) for ID3 overexpression group, pathway enrichment analysis depicting pathways such as cytokine-cytokine receptor interaction. (D) Protein-protein interaction network analysis of top upregulated genes associated with high ID1 and ID3 expression, identifying key nodes and interactions related to cytokines. The colour gradient represents the statistical significance (-log10 adjusted p-value), while the size of the dots indicates the number of genes enriched in each term.

Similar articles

Cited by

References

    1. Richard-Carpentier G, Kantarjian H, Jabbour E. Recent advances in adult acute lymphoblastic leukemia. Curr Hematol Malig Rep. (2019) 14:106–118. doi: 10.1007/s11899-019-00503-1 - DOI - PubMed
    1. Roberts KG, Mullighan CG. The biology of B-progenitor acute lymphoblastic leukemia. Cold Spring Harb Perspect Med. (2020) 10:1–22. doi: 10.1101/cshperspect.a034835 - DOI - PMC - PubMed
    1. Felipe Combariza J, Casas CP, Rodriguez M. Supervivencia en adultos con leucemia linfoide aguda de novo tratados con el esquema HyperCVAD en el Instituto Nacional de Cancerología (Colombia), entre enero de 2001 y junio de 2005. Rev Colomb CanCeRol. (2007) 11(2):92–100.
    1. Chiarini F, Lonetti A, Evangelisti C, Buontempo F, Orsini E, Evangelisti C, et al. . Advances in understanding the acute lymphoblastic leukemia bone marrow microenvironment: From biology to therapeutic targeting. Biochim Biophys Acta Mol Cell Res. (2016) 1863:449–63. doi: 10.1016/j.bbamcr.2015.08.015 - DOI - PubMed
    1. Xu K, Feng Q, Wiemels JL, de Smith AJ. Disparities in acute lymphoblastic leukemia risk and survival across the lifespan in the United States of America. J Transl Genet Genom. (2021) 5:218–39. https://www.oaepublish.com/articles/jtgg.2021.20.

MeSH terms

Substances