. 2024 Nov 29:15:1505966.
doi: 10.3389/fimmu.2024.1505966. eCollection 2024.

The close association of Muribaculum and PA (10:0/a-17:0) with the occurrence of pancreatic ductal adenocarcinoma and immunotherapy

Affiliations

The close association of Muribaculum and PA (10:0/a-17:0) with the occurrence of pancreatic ductal adenocarcinoma and immunotherapy

Enzhao Wang et al. Front Immunol. .

Abstract

Background: Progress in immunotherapy for pancreatic ductal adenocarcinoma (PDAC) has been slow, yet the relationship between microorganisms and metabolites is crucial to PDAC development. This study compares the biliary microbiota and metabolomic profiles of PDAC patients with those of benign pancreatic disease patients to investigate PDAC pathogenesis and its relationship with immunotherapy.

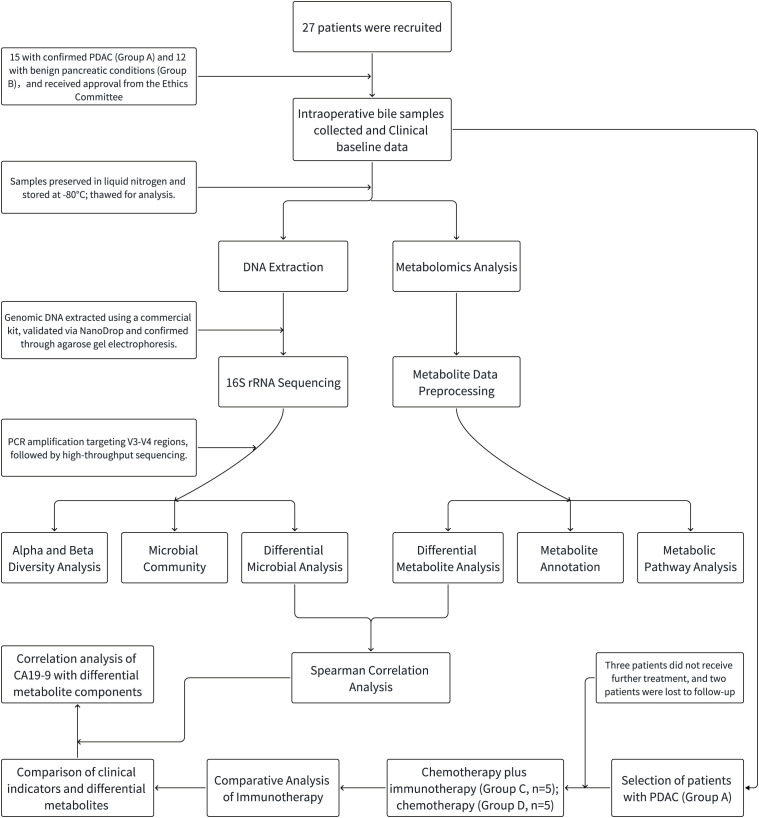
Methods: A total of 27 patients were recruited, including 15 diagnosed with PDAC and 12 with benign pancreaticobiliary conditions, all of whom underwent surgical treatment. Intraoperative bile samples were collected and analyzed using 16S rRNA sequencing in conjunction with liquid chromatography-mass spectrometry (LC-MS). Multivariate statistical methods and correlation analyzes were employed to assess differences in microbial composition, structure, and function between malignant and benign pancreatic diseases. Additionally, a retrospective analysis was conducted on PDAC patients post-surgery regarding immunotherapy and its correlation with metabolic components.

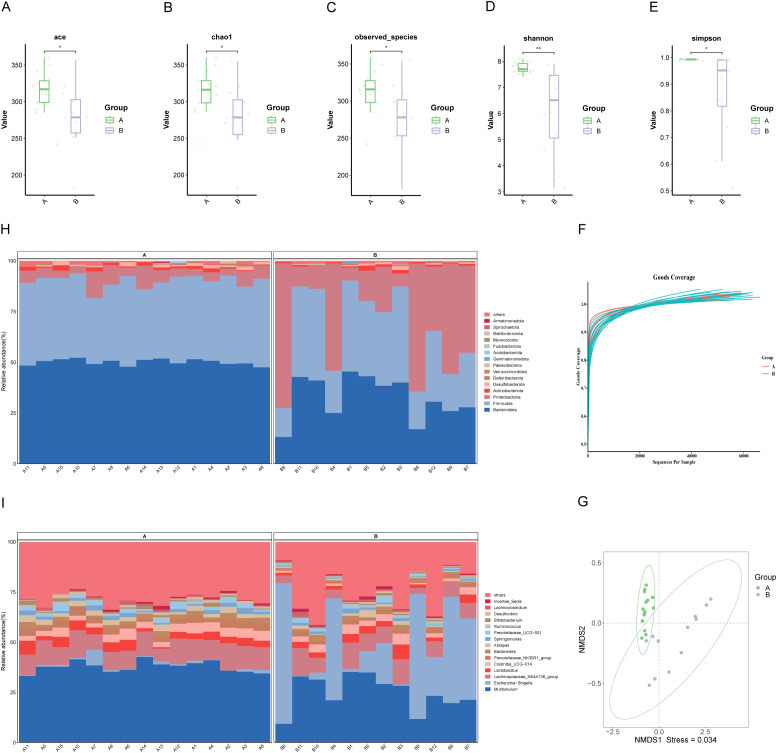
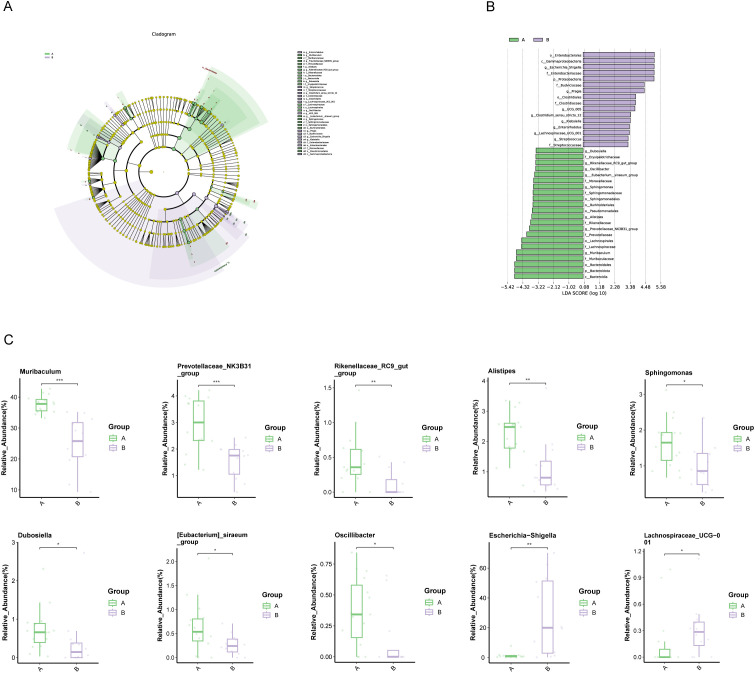
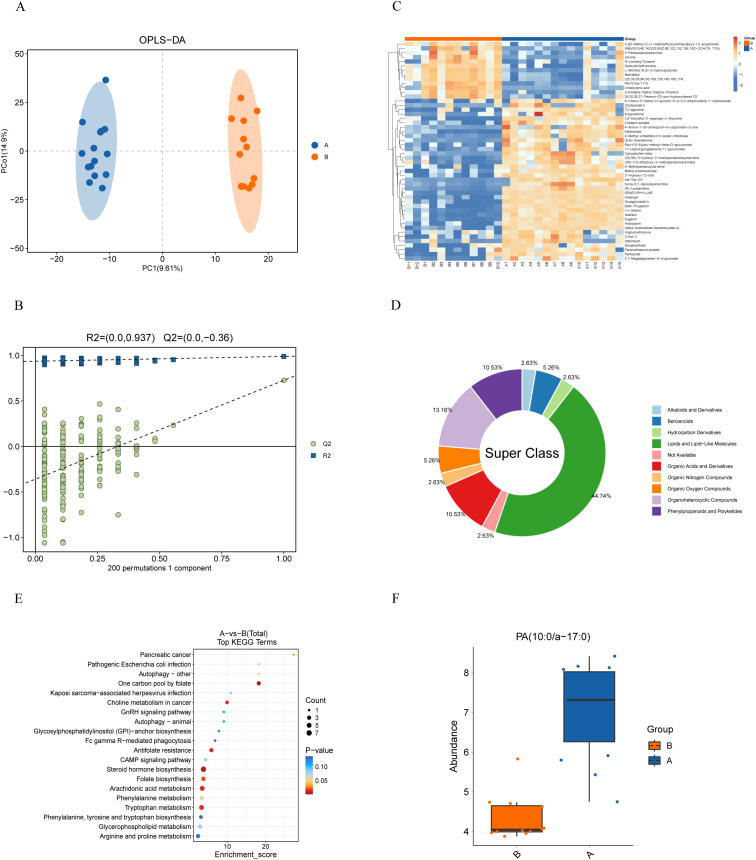
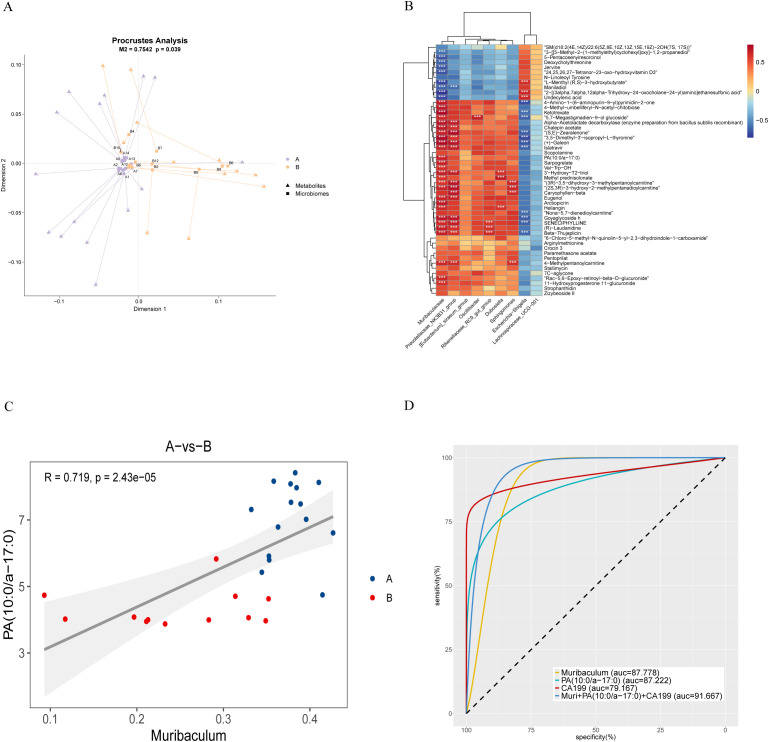
Results: PDAC patients exhibited a significantly higher abundance of bile microbiota compared to controls, with notable differences in microbiota structure between the two groups (P < 0.05). At the genus level, Muribaculum was markedly enriched in the bile of PDAC patients and was strongly correlated with phosphatidic acid (PA) (10:0/a-17:0). Both of these components, along with the tumor marker CA199, formulated a predictor of PDAC. Furthermore, PA (10:0/a-17:0) demonstrated a strong correlation with PDAC immunotherapy outcomes (Rho: 0.758; P=0.011).

Conclusion: These findings suggest that the biliary microbiota and associated metabolites play a crucial role in the development of PDAC and may serve as potential predictive biomarkers and therapeutic targets for disease management.

Keywords: 16S rRNA sequencing; PDAC; bile; immunotherapy; metabolomics.


Conflict of interest statement

The authors declare that the research was conducted in the absence of any commercial or financial relationships that could be construed as a potential conflict of interest.

Figures

Figure 1
Figure 1
Schematic flowchart of the study design. The flowchart includes patient selection criteria and enrollment status, as well as the processes for 16S rRNA sequencing analysis and LC-MS non-targeted metabolomics. PDAC patients are subsequently assigned to different treatment groups (chemotherapy + immunotherapy, chemotherapy alone). The flowchart concludes with a comparison of clinical indicators and the correlation between CA19-9 levels and specific metabolic components.
Figure 2
Figure 2
Characterization of biliary microbial community structure in patients with PDAC (Group A) and benign diseases (Group B). (A–E) Alpha diversity analysis: Boxplots showing ACE index, Chao1 index, and observed species, which reflect microbial richness, while Shannon and Simpson indices indicate community diversity. (F) Species accumulation curve: The curve plateaus as the number of extracted sequences increases, indicating sufficient sequencing depth. (G) NMDS: Each point represents a sample, with colors denoting groupings. Closer proximity of points within the same group, coupled with distinct separation between groups, indicates a strong clustering effect. (H, I) Composition of microbial communities at the phylum and genus levels in bile samples from groups A and B. “Others” denotes species outside the top-ranked taxa.
Figure 3
Figure 3
Microbial differences between patients with PDAC (Group A) and benign diseases (Group B). (A, B) LEfSe analysis: (A) Cladogram depicting the taxonomic structure of differentially abundant species. Light green and light purple indicate significantly enriched species in groups A and B, respectively, with yellow nodes representing taxa without significant differences. The node diameter is proportional to relative abundance, and nodes correspond to taxa at the phylum, class, order, family, and genus levels from inner to outer rings. (B) LDA score plot: Light green and light purple bars represent differential species in groups A and B, respectively, with higher relative abundance indicated. (C) Boxplot of differential species: Top 10 most abundant species differing between groups (*p < 0.05, **p < 0.01, ***p < 0.001).
Figure 4
Figure 4
Metabolomic analysis of bile from PDAC patients (Group A) and patients with benign Diseases (Group B). (A) OPLS-DA score plot demonstrates distinct metabolite profiles between groups. (B) Model validation using a permutation test, with the horizontal axis showing permutation retention and the vertical axis showing R² and Q² values. Dashed lines represent R² and Q² regressions. (C) Heatmap of metabolite clustering: Rows and columns represent metabolites and samples, respectively. Colors indicate relative metabolite expression levels, with hierarchical clustering shown for both metabolites (left) and samples (top). (D) HMDB compound classification: Differential metabolites were categorized using the HMDB, revealing that lipids and lipid-like molecules dominate at the superclass level. (E) KEGG enrichment analysis: The x-axis represents the enrichment score, and the y-axis represents the KEGG pathway. Bubble size reflects the number of metabolites enriched in each pathway, and color indicates p-value significance. (F) Boxplot of PA (10:0/a-17:0) distribution: Significantly higher levels of PA (10:0/a-17:0) were found in PDAC patients compared to controls (p < 0.001).
Figure 5
Figure 5
Association analysis of biliary microbiota and metabolites in PDAC patients. (A) Procrustes analysis: Arrows show the relationship between microbial (starting point) and metabolite (endpoint) samples. The M² value represents the sum of squared deviations, and the p-value indicates significance, with smaller values suggesting stronger correlation. (B) Correlation heatmap: Spearman’s correlation coefficient is used to illustrate relationships between microbiota and metabolites. Red indicates positive correlations, blue negative, with darker shades signifying stronger correlations (*p < 0.05, **p < 0.01, ***p < 0.001). (C) Scatterplot of correlation between samples: Colors represent groupings, with linear fit and 95% CI displayed, along with the correlation coefficient (R) and p-value. (D) Receiver Operating Characteristic Curve (ROC curve): This curve compares the diagnostic performance of Muribaculum, PA (10:0/a-17:0), CA199, and their combined model. For clarity, we present the AUC as an integer and adjust its decimal point two places to the left for accurate interpretation. A higher value indicates greater diagnostic accuracy.

Similar articles

References

    1. Siegel RL, Miller KD, Fuchs HE, Jemal A. Cancer statistics, 2021. CA Cancer J Clin. (2021) 71:7–33. doi: 10.3322/caac.21654 - DOI - PubMed
    1. Bray F, Laversanne M, Sung H, Ferlay J, Siegel RL, Soerjomataram I, et al. . Global cancer statistics 2022: GLOBOCAN estimates of incidence and mortality worldwide for 36 cancers in 185 countries. CA Cancer J Clin. (2024) 74:229–63. doi: 10.3322/caac.21834 - DOI - PubMed
    1. Cabasag CJ, Ferlay J, Laversanne M, Vignat J, Weber A, Soerjomataram I, et al. . Pancreatic cancer: an increasing global public health concern. Gut. (2022) 71:1686–7. doi: 10.1136/gutjnl-2021-326311 - DOI - PubMed
    1. Bastos AR, Pereira-Marques J, Ferreira RM, Figueiredo C. Harnessing the microbiome to reduce pancreatic cancer burden. Cancers (Basel). (2023) 15:2629. doi: 10.3390/cancers15092629 - DOI - PMC - PubMed
    1. Wei M-Y, Shi S, Liang C, Meng Q-C, Hua J, Zhang Y-Y, et al. . The microbiota and microbiome in pancreatic cancer: more influential than expected. Mol Cancer. (2019) 18:97. doi: 10.1186/s12943-019-1008-0 - DOI - PMC - PubMed

Substances

LinkOut - more resources