[Preprint]. 2024 Dec 5:2023.10.25.23297558.
doi: 10.1101/2023.10.25.23297558.

Plasticity of Human Microglia and Brain Perivascular Macrophages in Aging and Alzheimer's Disease

Affiliations

Plasticity of Human Microglia and Brain Perivascular Macrophages in Aging and Alzheimer's Disease

Donghoon Lee et al. medRxiv. .

Abstract

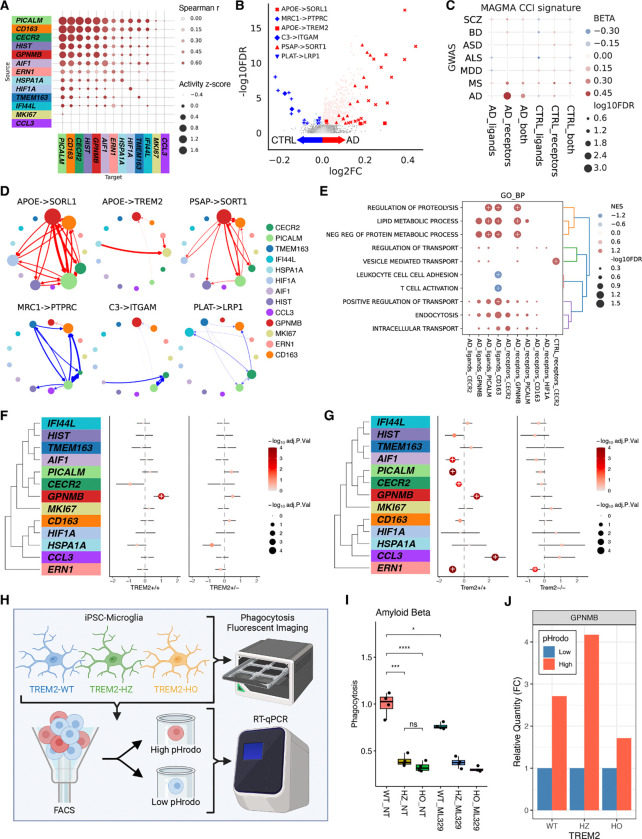
The complex roles of myeloid cells, including microglia and perivascular macrophages, are central to the neurobiology of Alzheimer's disease (AD), yet they remain incompletely understood. Here, we profiled 832,505 human myeloid cells from the prefrontal cortex of 1,607 unique donors covering the human lifespan and varying degrees of AD neuropathology. We delineated 13 transcriptionally distinct myeloid subtypes organized into 6 subclasses and identified AD-associated adaptive changes in myeloid cells over aging and disease progression. The GPNMB subtype, linked to phagocytosis, increased significantly with AD burden and correlated with polygenic AD risk scores. By organizing AD-risk genes into a regulatory hierarchy, we identified and validated MITF as an upstream transcriptional activator of GPNMB, critical for maintaining phagocytosis. Through cell-to-cell interaction networks, we prioritized APOE-SORL1 and APOE-TREM2 ligand-receptor pairs, associated with AD progression. In both human and mouse models, TREM2 deficiency disrupted GPNMB expansion and reduced phagocytic function, suggesting that GPNMB's role in neuroprotection was TREM2-dependent. Our findings clarify myeloid subtypes implicated in aging and AD, advancing the mechanistic understanding of their role in AD and aiding therapeutic discovery.


Conflict of interest statement

Competing interests FJT consults for Immunai Inc., Singularity Bio B.V., CytoReason Ltd, Omniscope Ltd, Cellarity, and has ownership interests in Dermagnostix GmbH and Cellarity. The remaining authors declare no competing interests.

Figures

Figure 1.
Figure 1.
Overview of the human myeloid single-cell atlas. (A) the FreshMG discovery cohort (scRNA-seq) using live human myeloid cells from postmortem PFC and (B) the PsychAD replication cohort (snRNA-seq) using flash-frozen PFC tissues and in-silico sorted for microglia and PVMs. (C) Unified taxonomy of human myeloid subtypes. (D) Subtype-specific marker gene expression. Z-score normalized. Upper-triangle: FreshMG. Lower-triangle: PsychAD. (E) Enrichment of heritable disease risk (scDRS) by subtype using GWAS of 8 brain diseases. Meta-analysis between FreshMG and PsychAD. The asterisk denotes FDR < 0.05. SCZ: schizophrenia, BD: bipolar disorder, MDD: major depressive disorder, ASD: autism spectrum disorder, MS: multiple sclerosis, ALS: amyotrophic lateral sclerosis, and PD: Parkinson’s disease. (F) Pairwise Pearson correlation of the subtype-level taxonomy between FreshMG and PsychAD datasets using highly variable genes common in both datasets. (G) Validation of human myeloid taxonomy using independent, multi-modal, and published datasets. Human (14), iMGL: iPSC-derived microglia (23), and Mouse (27). Pairwise comparison of subtype-level taxonomy against the FreshMG annotation. Mann–Whitney U test between matched (diagonal) and unmatched (off-diagonal) subtypes. ****: p ≤ 1.0e-4. (H) Representative image of Akoya PhenoCycler multiplex immunofluorescence results showing CD163+/IBA-1+ cells are enriched near blood vessels (outlined by gray line), labeled by Collagen IV. Scale bar 20 μm. (I) Representative slide of Xenium in situ spatial transcriptomics data. Left: DAPI, Middle: laminar distribution of neuronal cell types, Right: distribution of myeloid cells annotated by subclasses.
Figure 2.
Figure 2.
Variation in human myeloid subtype composition. (A) Compositional variation of myeloid subtypes by age, sex, and the interaction between age and sex using disease-free subset. CLR transformed composition data was modeled using a linear mixed model accounting for technical batch effects including tissue sources and sequencing pools and donor effects including age, sex, genetic ancestry, and PMI (see Methods on crumblr). Fixed effect meta-analysis using results from FreshMG and PsychAD cohorts. (B) Compositional variation of myeloid subtypes by four different neuropathological measures of the AD progression; diagnosis (dx_AD), CERAD, Braak staging, and dementia status, after accounting for technical and donor-level covariates. Fixed effect meta-analysis using both FreshMG and PsychAD cohorts. (C) Comparison of compositional variation between disease-free aging and AD. Subtypes were weighted by the inverse of standard error. (D) Covariate adjusted compositional variation with disease-free aging. CLR: centered-log-ratio. (E) Covariate adjusted compositional variation with Braak staging. (F) Correlation between scDRS meta z-scores and crumblr estimate of compositional variation by dx_AD as a coefficient. Weighted Pearson’s correlation using average −log10(P-value) as weights. (G) Correlation between crumblr estimate of compositional variation by PRS as a coefficient against crumblr estimate of compositional variation by dx_AD as a coefficient. Weighted Pearson’s correlation using inverse of average of standard error as weights. Circle denotes crumblr analysis using all donors while triangle denotes crumblr analysis using controls only. (H) Causal mediation analysis using PRS, Aβ plaque, composition of the GPNMB subtype, and clinical dementia status. ***: p ≤ 1.0e-3, **: p ≤ 1.0e-2, NS: p > 0.05.
Figure 3.
Figure 3.
Transcriptional regulation of human myeloid cells. (A) Differentially expressed genes by four different measures of AD neuropathology adjusted for technical and donor-level covariates. Fixed effect meta-analysis using both FreshMG and PsychAD cohorts. (B) Schematic overview of GRN inference and TF-gene regulon enrichment for prioritization of upstream master regulators of AD. (C) Concordance of normalized regulon activity scores (AUCell) between FreshMG and PsychAD cohorts. Pairwise Pearson correlation. (D) Enrichment of regulon by subtypes. Meta-analysis of consensus regulon enrichment Z-score with Stouffer’s correction between FreshMG and PsychAD cohorts. Top 3 regulons per each subtype shown. (E) Enrichment of AD gene signatures by regulons. Fisher’s exact tests for enrichment of differentially expressed gene signatures in regulon target genes across myeloid subtypes. (F) TFs that modulate AD risk genes. Gene regulatory network visualization of KLF12, MITF, and GLIS3 TFs and downstream target risk genes. Node colors represent gene expression changes from dreamlet analysis. Edge weights represent importance scores inferred from the SCENIC pipeline. (G) Schematic of phagocytosis assay. (H) Relative level of phagocytosis after CRISPR activation in HMC3 cell line.
Figure 4.
Figure 4.
Non-cell-autonomous mechanisms. (A) Concordance of CCI scores among human myeloid cells between the FreshMG and the PsychAD cohorts. Pairwise Spearman correlation using aggregated CCI scores by subtype. Row labels correspond to the sender or ligand-producing cell. Column labels correspond to the receiver or receptor-producing cell. (B) Differential CCI analysis based on Braak stages. Meta-analysis of linear mixed model regression using both FreshMG and PsychAD cohorts. Estimated log fold change corresponds to increased representation in the high Braak stage (red) vs. the low Braak stage (blue). (C) MAGMA enrichment analysis on differential CCI, stratified by direction of regulation (AD vs CTRL) and role of interaction (ligands, receptors, or both). (D) Directed network visualization of the top CCI pairs. Top: AD-associated, Bottom: controls-associated CCIs. Nodes represent each subtype and directional edge weights represent the importance of interaction. The edge color represents the estimated log fold change from differential CCI analysis. (E) Gene set enrichment analysis of CCI pairs using Gene Ontology Biological Processes. CCIs aggregated by subtype, direction of regulation (AD vs CTRL), and role of interaction (ligands or receptors). The color scale represents the normalized enrichment score (NES). The dot size represents the FDR significance. + marks FDR < 0.05. (F) Compositional variation of myeloid subtypes by AD using TREM2 missense mutation (R47H or R62H) carriers. Shared disease-free controls without TREM2 mutations were compared against AD cases with TREM2 WT (+/+) and TREM2 missense carriers (+/−). AD cases were sampled to match the size of TREM2 mutation carriers. (G) Compositional variation of myeloid subtypes by AD using Trem2-deficient 5XFAD mice. Trem2+/+ 5XFAD and Trem2−/− 5XFAD mice were compared to disease-free control mice (Trem2+/+). (H) Schematic of isolating highly phagocytosing microglial cells using flow cytometry. (I) Relative level of phagocytosis among WT, TREM2 heterozygous, and homozygous knockouts in iPSC-derived microglia using Aβ as substrates. (J) Relative mRNA expression of GPNMB measured by RT-qPCR for high and low phagocytosing microglia using Aβ as substrates.

References

    1. Long J. M., Holtzman D. M., Alzheimer Disease: An Update on Pathobiology and Treatment Strategies. Cell 179, 312–339 (2019). - PMC - PubMed
    1. Hickman S., Izzy S., Sen P., Morsett L., El Khoury J., Microglia in neurodegeneration. Nat. Neurosci. 21, 1359–1369 (2018). - PMC - PubMed
    1. Leng F., Edison P., Neuroinflammation and microglial activation in Alzheimer disease: where do we go from here? Nat. Rev. Neurol. 17, 157–172 (2021). - PubMed
    1. De Schepper S., Ge J. Z., Crowley G., Ferreira L. S. S., Garceau D., Toomey C. E., Sokolova D., Rueda-Carrasco J., Shin S.-H., Kim J.-S., Childs T., Lashley T., Burden J. J., Sasner M., Sala Frigerio C., Jung S., Hong S., Perivascular cells induce microglial phagocytic states and synaptic engulfment via SPP1 in mouse models of Alzheimer’s disease. Nat. Neurosci. 26, 406–415 (2023). - PMC - PubMed
    1. Keren-Shaul H., Spinrad A., Weiner A., Matcovitch-Natan O., Dvir-Szternfeld R., Ulland T. K., David E., Baruch K., Lara-Astaiso D., Toth B., Itzkovitz S., Colonna M., Schwartz M., Amit I., A Unique Microglia Type Associated with Restricting Development of Alzheimer’s Disease. Cell 169, 1276–1290.e17 (2017). - PubMed

Publication types

LinkOut - more resources