[Preprint]. 2024 Dec 5:2024.12.04.24318491.
doi: 10.1101/2024.12.04.24318491.

Establishing methods to monitor H5N1 influenza virus in dairy cattle milk

Affiliations

Establishing methods to monitor H5N1 influenza virus in dairy cattle milk

Elyse Stachler et al. medRxiv. .

Update in

  • Establishing Methods to Monitor Influenza (A)H5N1 Virus in Dairy Cattle Milk, Massachusetts, USA.
    Stachler E, Gnirke A, McMahon K, Gomez M, Stenson L, Guevara-Reyes C, Knoll H, Hill T, Hill S, Messer KS, Arizti-Sanz J, Albeez F, Curtis E, Samani P, Wewior N, O'Connor DH, Vuyk W, Khoury SE, Schnizlein MK, Rockey NC, Broemmel Z, Mina M, Madoff LC, Wohl S, O'Connor L, Brown CM, Ozonoff A, Park DJ, MacInnis BL, Sabeti PC. Stachler E, et al. Emerg Infect Dis. 2025 May;31(13):70-75. doi: 10.3201/eid3113.250087. Epub 2025 Mar 26. Emerg Infect Dis. 2025. PMID: 40138725 Free PMC article.

Abstract

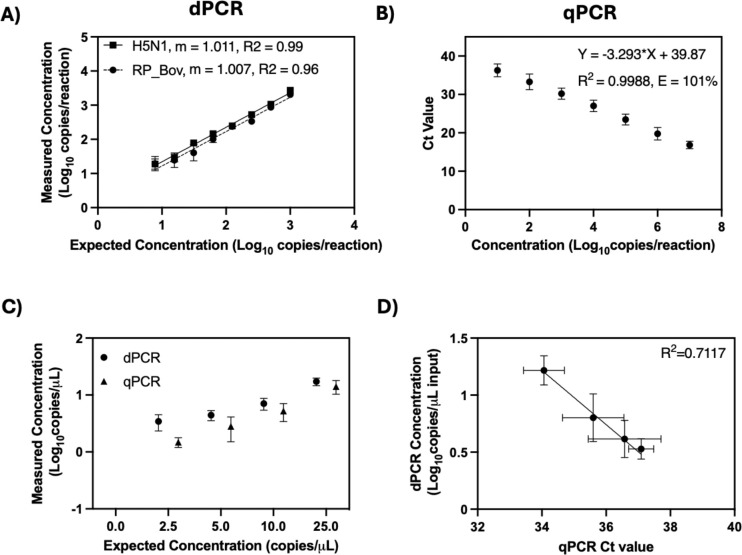
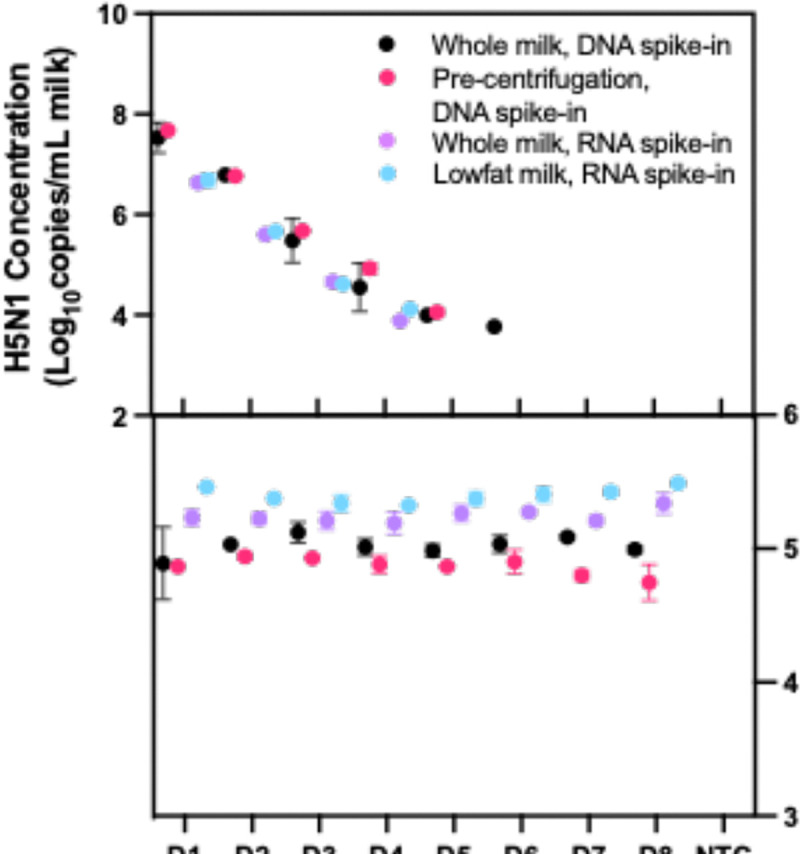
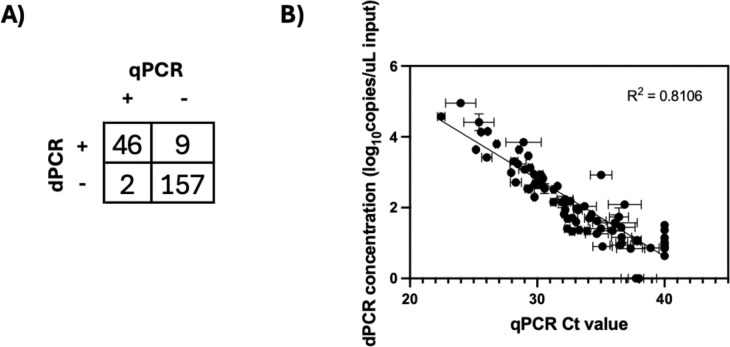
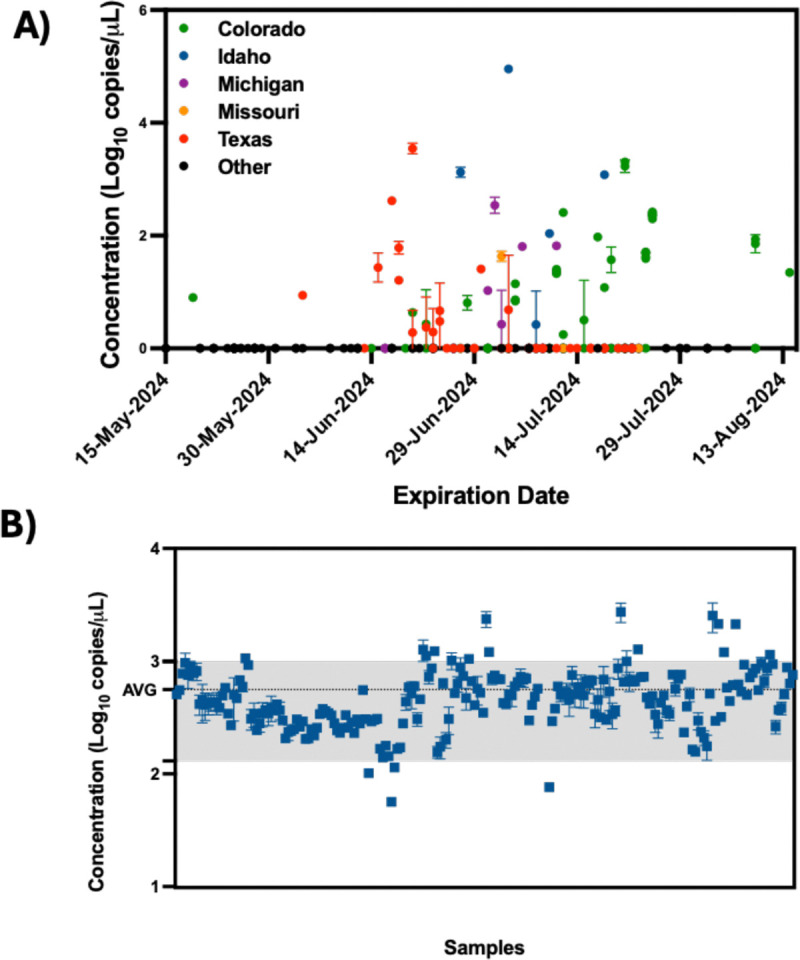
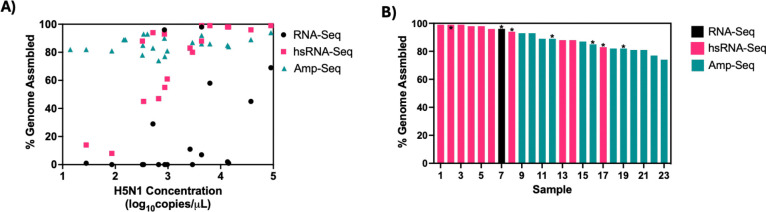
Highly Pathogenic Avian Influenza strain H5N1 has caused a multi-state outbreak among US dairy cattle, spreading across 15 states and infecting hundreds of herds since its onset. We rapidly developed and optimized PCR-based detection assays and sequencing protocols to support H5N1 molecular surveillance. Using 214 retail milk from 20 states for methods development, we found that H5N1 concentrations by digital PCR strongly correlated with qPCR cycle threshold (Ct) values, with dPCR exhibiting greater sensitivity. We also found that metagenomic sequencing after hybrid selection was best for higher concentration samples while amplicon sequencing performs best for lower concentrations. By establishing these methods, we were able to support the creation of a statewide surveillance program to test bulk milk samples monthly from all cattle dairy farms within Massachusetts, which remain negative to date. The methods, workflow, and recommendations described here provide a framework for others aiming to conduct H5N1 surveillance efforts.


Conflict of interest statement

Conflicts of Interest P.C.S. is co-founder and shareholder in Sherlock Biosciences and Delve Bio, and is a board member and shareholder of Danaher Corporation. DHO is a co-founder and managing member of Pathogenuity LLC.

Figures

Figure 1:
Figure 1:. Validation and characterization of dPCR and qPCR H5N1 assays on synthetic spike-in samples.
(A-B) Detection of (A) dPCR (H5_Taq and RP_Bov) and (B) qPCR (H5_Taq) assays using serial dilutions of synthetic H5N1 RNA standard material. For qPCR data, we combined and jointly analyzed all standard curve data from runs during retail milk testing. (C-D) Limit of Detection (LOD) analysis for (C) measured concentrations compared to expected concentrations for both qPCR and dPCR and (D) correlation of dPCR concentrations with qPCR Ct values. Fitted lines in (A) and (D) represent simple linear regression lines of best fit.
Figure 2:
Figure 2:. dPCR detection of H5N1 synthetic nucleic acid (top) and RNaseP Bovine (bottom) for the MagMAX CORE extraction kit.
For direct extraction, we extracted 200μL of milk spiked with serial dilutions of H5N1 synthetic fragments. For pre-centrifugation, we centrifuged samples for 12000×g for 10 minutes following spike-in, after which we extracted 200μL.
Figure 3:
Figure 3:. Comparison of dPCR and qPCR H5N1 testing on retail milk samples.
(A) Agreement of positive and negative calls of milk samples between the two platforms. (B) Correlation of H5N1 measured by dPCR concentration compared with qPCR Ct value. For plotting purposes, samples not detected by dPCR were graphed with a dPCR concentration of 0 copies/μL while samples not detected by qPCR were graphed with a Ct value of 40.
Figure 4:
Figure 4:. H5N1 and Bovine Ribonuclease P (RP_Bov) for all retail milk samples as measured by dPCR.
A) The concentration of H5N1 as a function of processing state and expiration date. B) RP_Bov data for all samples. The gray-shaded region corresponds to the average RP_Bov concentration of all data plus and minus one standard deviation.
Figure 5:
Figure 5:
(A) Completeness of H5N1 genome assemblies generated by unbiased metagenomics (RNA-Seq), virus-enriched hybrid-selected metagenomics (hsRNA-Seq) and targeted H5N1 Amplicon Sequencing (Amp-Seq) as a function of H5N1 copies/μL RNA. (B): the most complete H5N1 assembly produced for each sample sorted by length and the underlying sequencing approach. Ultra-pasteurized samples are indicated by an (*) above the bar.

Similar articles

Cited by

References

    1. Peacock T, Moncla L, Dudas G, VanInsberghe D, Sukhova K, Lloyd-Smith JO, et al. The global H5N1 influenza panzootic in mammals. Nature. Forthcoming 2024. 10.1038/s41586-024-08054-z. - DOI - PubMed
    1. Graziosi G, Lupini C, Catelli E, Carnaccini S. Highly Pathogenic Avian Influenza (HPAI) H5 Clade 2.3.4.4b Virus Infection in Birds and Mammals. Animals (Basel). 2024. May 2;14(9):1372. doi: 10.3390/ani14091372. - DOI - PMC - PubMed
    1. World Health Organization. Avian Influenza A(H5N1) – United States of America. 2024. April 9 [cited 2024 Oct 1]. https://www.who.int/emergencies/disease-outbreak-news/item/2024-DON512.
    1. US Department of Agriculture Animal and Plant Health Inspection Service. HPAI Confirmed Cases in Livestock. 2024. Jul 3 [cited 2024 Dec 3]. https://www.aphis.usda.gov/livestock-poultry-disease/avian/avian-influen....
    1. Nguyen T-Q, Hutter C, Markin A, Thomas M, Lantz K, Killian ML, et al. Emergence and interstate spread of highly pathogenic avian influenza A(H5N1) in dairy cattle. unpub. data, 10.1101/2024.05.01.591751. - DOI - PubMed

Publication types

LinkOut - more resources