[Preprint]. 2024 Dec 5:2024.12.02.626426.
doi: 10.1101/2024.12.02.626426.

IFNγ-dependent metabolic reprogramming restrains an immature, pro-metastatic lymphatic state in melanoma

Affiliations

IFNγ-dependent metabolic reprogramming restrains an immature, pro-metastatic lymphatic state in melanoma

Triantafyllia Karakousi et al. bioRxiv. .

Abstract

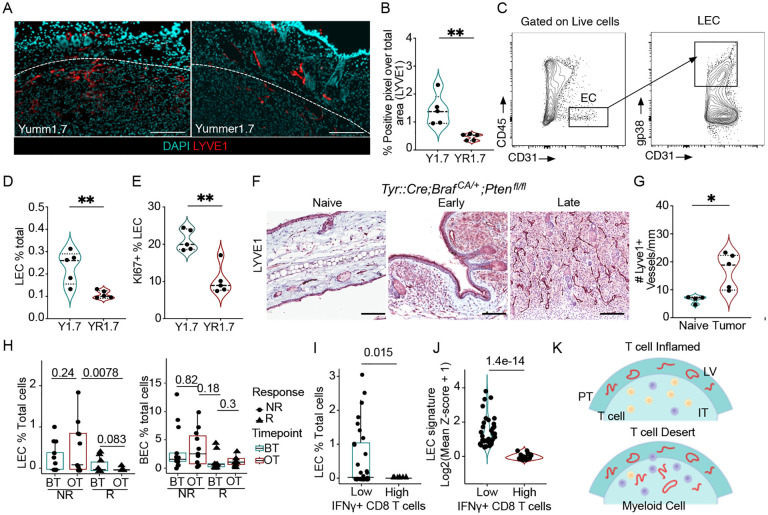
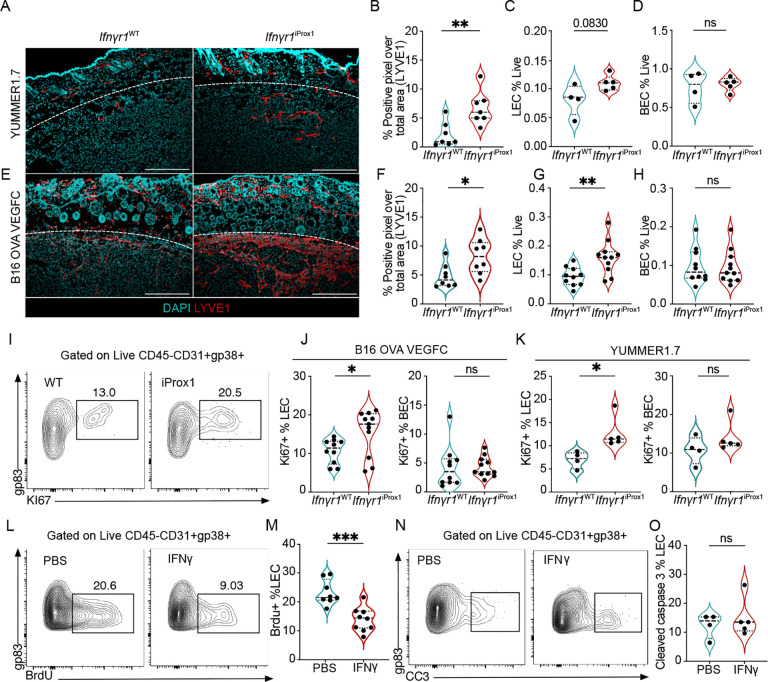
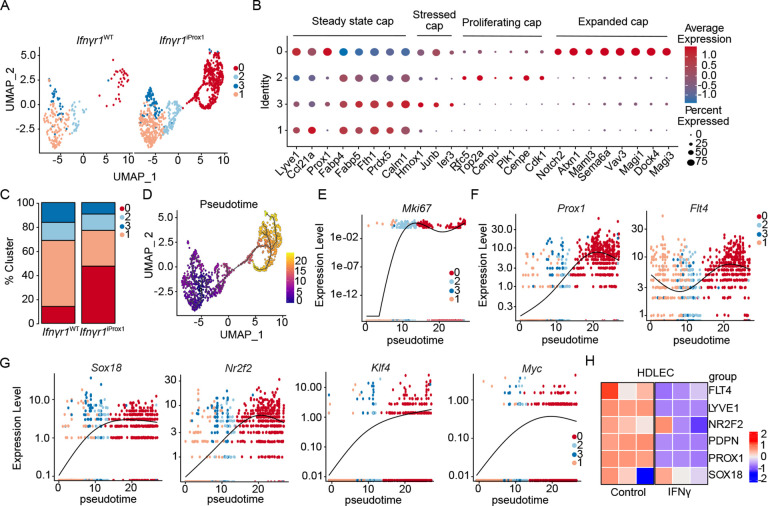
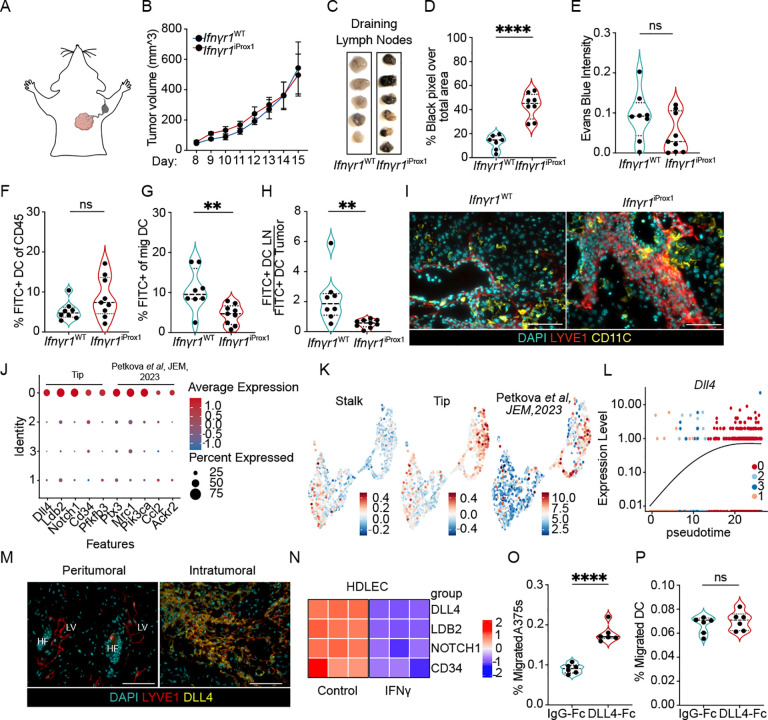
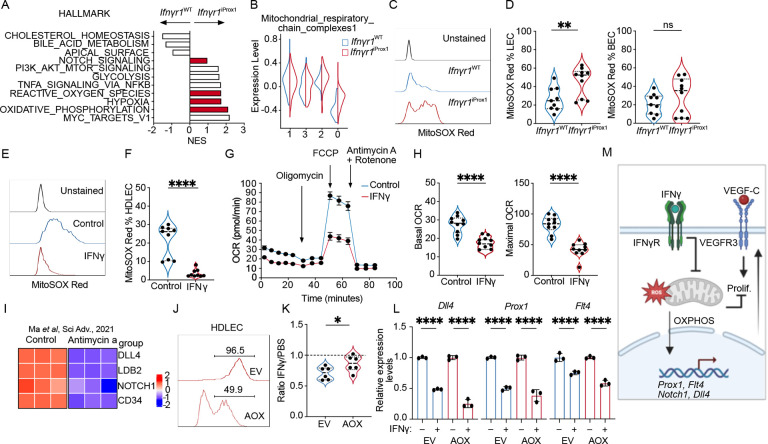
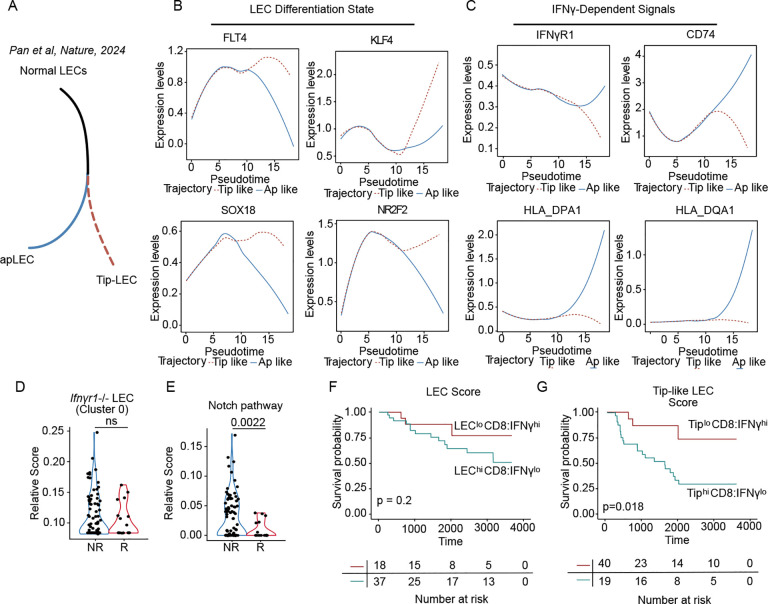
Lymphatic vessels play a crucial role in activating anti-tumor immune surveillance but also contribute to metastasis and systemic tumor progression. Whether distinct lymphatic phenotypes exist that govern the switch between immunity and metastasis remains unclear. Here we reveal that cytotoxic immunity normalizes lymphatic function and uncouples immune and metastatic potential. We find that in mice and humans, intratumoral lymphatic vessel density negatively correlates with productive cytotoxic immune responses and identify IFNγ as an intrinsic inhibitor of lymphangiogenesis. Specific deletion of the Ifngr1 in lymphatic endothelial cells (LECs) greatly expanded the intratumoral lymphatic network and drove the emergence of a tip-like endothelial state, promoting lymph node metastasis but not dendritic cell migration. IFNγ inhibits oxidative phosphorylation, which is required for proliferation and acquisition of the pathologic transcriptional state. Our data indicate that IFNγ induces a phenotypic switch in tumor-associated lymphatic vessels to reinforce canonical immune surveillance and block metastasis.

Keywords: immune surveillance; lymphangiogenesis; melanoma; metastasis.


Conflict of interest statement

Declaration of interests A.W.L. reports consulting services for AGS Therapeutics. All other authors declare no conflicts of interest.

Figures

Figure 1.
Figure 1.. Cytotoxic tumor microenvironments are associated with reduced lymphatic vessel density.
A. Representative immunofluorescence images of LYVE-1+ (red) lymphatic vessels from Y1.7 and YR1.7 tumors, nuclei are stained with DAPI (cyan), at day 12 of tumor growth. Scale bar = 100μm. B. Quantification of lymphatic vessel density from (A). C. Gating strategy to identify lymphatic endothelial cells (LEC; CD45CD31+gp38+). D. LECs as a percentage of total live cells and E. Ki67 as a percentage of total LECs in Y1.7 and YR1.7 tumors. F. Representative IHC images of Lyve1 staining in naïve and Tyr::Cre;Braf CA/+;Pten fl/lf tumors, G. Quantification of lymphatic vessels in naïve and Tyr::Cre;Braf CA/+;Pten fl/lf tumors, each dot is a mouse n=4–5, H. Quantification of LECs and BECs as a percentage of total cells per melanoma patient in responders (R) and non-responders (NR) before and on immunotherapy from the single-cell dataset. I. Quantification of LECs in IFNγ+CD8 T low and high patient samples from the single-cell dataset, each point is a patient. J. Quantification of LEC signature in IFNγ+CD8+ T low and high patient samples from the TCGA dataset, each point is a patient. K. Schematic of peritumoral (PT) and intratumoral (IT) lymphatic vessels and T cells. Two-sided, unpaired Student’s t-tests (B-J), Wilcoxon rank test (H). *p<0.05; **p<0.001.
Figure 2.
Figure 2.. IFNγ restrains tumor-associated lymphangiogenesis.
A. Representative immunofluorescence images of LYVE-1+ (red) lymphatic vessels and nuclei (DAPI, cyan), from YUMMER1.7 tumors grown in Ifnγr1WT and Ifnγr1iProx1 mice, at day 12 of tumor growth. Scale bar = 500μm. B. Quantification of lymphatic vessel density (LVD) from image (A), each point represents a mouse (n=7). C. Lymphatic (LEC; CD45+CD31+gp38+) and D. blood endothelial cells (BEC; CD45CD31+gp38) as the frequency of total live cells from YUMMER1.7 tumors in the Ifnγr1WT and Ifnγr1iProx1 mice, each point represents a mouse (n=4–5). E. Representative immunofluorescence images of LYVE-1+ (red) lymphatic vessels and nuclei with DAPI (cyan), from B16-OVA-VEGFC tumors grown in the Ifnγr1WT and Ifnγr1iProx1 mice, at day 15 of tumor growth. Scale bar = 500μm. F. Quantification of LVD from (E), each point represents a mouse, (n=8). G. Quantification of LECs and H. BECs as the frequency of live cells from B16-OVA-VEGFC tumors in the Ifnγr1WT and Ifnγr1iProx1 mice, each point represents a mouse, (n=10–11). I. Representative flow plots and J. quantification of Ki67 as a percent of LECs and BECs in B16-OVA-VEGFC tumors, (n=10–11) and K. YUMMER1.7 tumors from Ifnγr1WT and Ifnγr1iProx1 mice, (n=2–5), each point is a mouse. L. Representative flow plots and M. quantification of percent of BrdU+ LECs in B16-OVA-VEGFC tumors from Rag1−/− mice, treated with intratumoral injections of PBS or recombinant IFNγ, each point represents a mouse, (n=8–9). N. Representative flow plots and O. quantification of percent of cleaved caspase 3 (CC3) positive LECs in B16-OVA-VEGFC tumors from Rag1−/− mice, treated with intratumoral injections of PBS or recombinant IFNγ as the frequency of total LECs, each point represents a mouse, (n=4–5). *p<0.05; **p<0.01; ***p<0.001. Unpaired, student’s t test.
Figure 3.
Figure 3.. IFNγ promotes lymphatic differentiation away from an immature, tip-like state.
A. Split UMAP scRNAseq analysis of tumor-associated LECs (LEC; Prox1+) sorted from B16-OVA-VEGFC tumors in Ifnγr1WT and Ifnγr1iProx1 mice from. B. Average expression of marker genes for each cluster, normalized from −1 to 1. Size indicates percentage of cells in the cluster expressing the transcript. C. Cluster proportion in the Ifnγr1WT and Ifnγr1iProx1 mice. D. Monocle 3 pseudotime analysis of the combined LEC object from (A). E-G. Gene expression as a function of pseudotime from (D). H. Heatmap of LEC fate genes expressed by human dermal LECs (HDLEC) treated with PBS or IFNγ (n=3, technical replicates) by bulk RNA sequencing.
Figure 4.
Figure 4.. IFNγ-signaling in tumor-associated lymphatic vessels restrains a tip-like state that promotes lymph node metastasis but inhibits dendritic cell migration.
A. Schematic of lymphatic drainage of the intradermal tumors on the top right side of the back. B. B16-OVA-VEGFC tumor growth (intradermal, 5×10⁵ cells) in Ifnγr1WT and Ifnγr1iProx1 mice (n=5). C. Representative gross images of B16-OVA-VEGFC tumor-draining LNs from Ifnγr1WT and Ifnγr1iProx1 mice. D. Quantification of black intensity over total LN area, each point represents a mouse, (n=7–8). E. Quantification of Evans blue intensity in B16-OVA-VEGFC tumor-draining LNs from Ifnγr1WT and Ifnγr1iProx1 mice, each point represents a mouse, (n=8–9). F. Quantification of CD11C+MHCIIhighFITC+ migratory dendritic cells (mDC) as percent of live CD45+ cells in B16-OVA-VEGFC tumors and G. in tumor-draining LNs from Ifnγr1WT and Ifnγr1iProx1 mice, each point represents a mouse, (n=8–9). H. Rate of migration as a ratio of FITC+CD11C+MHCIIhigh mDC in the LN to the tumor. I. Representative images of B16-OVA-VEGFC tumors from Ifnγr1WT and Ifnγr1iProx1 mice. Lymphatic vessels (LYVE-1; red), DCs (CD11c; yellow, and nuclei (DAPI; cyan). Scale bars=100mm. J. Dot plot of select genes expressed in cluster 0, normalized from −1 to 1. Size indicates the percentage of cells in the cluster expressing the transcript. K. Stalk, tip, and Petkova et al module scores projected on combined UMAP. L. Dll4 expression as a function of pseudotime. M. Representative immunofluorescence images of B16-OVA-VEGFC tumors from Ifnγr1iProx1 mice. Lymphatic vessels (LYVE-1, red); DLL4 (yellow); nuclei (DAPI, cyan). HF=Hair follicle, LV=Lymphatic vessel, scale bar = 100μm. N. Heatmap of tip-like genes expressed by HDLECs treated with PBS or IFNγ (n=3 technical replicates). O. Quantification of the percentage A375 melanoma, each point represents a technical replicate across two independent experiments, or P. bone marrow-derived dendritic cells (DC) that migrate across a transwell in the presence (DLL4-Fc) or absence (IgG-Fc) of adsorbed DLL4, each point represents a BDMCs from a single mouse, across two independent experiments. ****p<0.0001. Student’s t-test. *p<0.05; **p<0.01; ****p<0.0001.
Figure 5.
Figure 5.. IFNγ inhibits proliferation through effects on mitochondrial respiration.
A. Pathway analysis of differentially expressed genes in cluster 0 between Ifnγr1WT and Ifnγr1iProx1 LECs from Fig. 4. B. Mitochondrial respiratory chain complex module score as a function of cluster and experimental group. C. Representative histogram of Mitosox Red staining in tumor-associated LECs (LEC; CD45CD31+gp38+) from B16-OVA-VEGFC tumors from Ifnγr1WT and Ifnγr1iProx1 mice. D. Mitosox Red quantification in LEC and blood endothelial cells (BEC; CD45CD31+gp38) from B16-OVA-VEGFC tumors from Ifnγr1WT and Ifnγr1iProx1 mice, each point represents a mouse, (n=9–10). E. Representative histogram and F. quantification of Mitosox Red in HDLEC treated with PBS or IFNγ (72 hrs). G. Seahorse analysis of IFNγ-conditioned (48hrs) HDLECs relative to PBS-treated controls. H. Basal and maximal oxygen consumption rate (OCR) from (E). I. Heatmap of tip-like genes from bulk RNA sequencing data of HDLECs treated with PBS or antimycin-a scaled and reanalyzed (Ma et al Sci Adv 2021). J. Representative histogram of HDLECs transduced with empty vehicle control (EV-RFP) or a plasmid expressing the alternative oxidase (AOX-RFP). K. Quantification of RFP+ EV and AOX HDLEC numbers after treatment with IFNγ (72 hrs), presented relative to PBS controls. L. Dll4, Prox1, Flt4 expression in sorted EV-RFP or AOX-RFP transduced HDLECs after IFNγ or PBS treatment. M. Schematic illustration of the role of IFNγ on proliferation and transcriptional control of selected genes. *p<0.05, **p<0.01, ***p<0.001, ****p<0.001.
Figure 6.
Figure 6.. The tip-like lymphatic state is associated with poor response to immunotherapy and worse overall survival in human melanoma.
A. Schematic illustration of the antigen presenting (apLEC) and the tip (Tip-LEC) trajectories from Pan et al, Nature, 2024. B-C. Pseudotime trajectories of select genes in the Pan et al, Nature, 2024, dataset. D. Module score of LEC cluster 0 from Ifnγr1iProx1, and E. Notch pathways signatures on non-responder (NR) and responder (R) melanoma patients before and on immunotherapy from the single-cell dataset. Each point is a single cell. F. Kaplan-Meier curve depicting overall survival of cutaneous melanoma patients from the TCGA-SKCM dataset, stratified with LEChiCD8:IFNγlo and LECloCD8:IFNγhi and G. the Tip-like LEC cluster signatures TiphiCD8:IFNγlo and TiploCD8:IFNγhi, (p-values shown in log-rank test).

References

    1. Petrova T.V., and Koh G.Y. (2020). Biological functions of lymphatic vessels. Science 369, eaax4063. 10.1126/science.aax4063. - DOI - PubMed
    1. Karakousi T., Mudianto T., and Lund A.W. (2024). Lymphatic vessels in the age of cancer immunotherapy. Nat. Rev. Cancer. 10.1038/s41568-024-00681-y. - DOI - PubMed
    1. Morton D.L., Thompson J.F., Cochran A.J., Mozzillo N., Nieweg O.E., Roses D.F., Hoekstra H.J., Karakousis C.P., Puleo C.A., Coventry B.J., et al. (2014). Final Trial Report of Sentinel-Node Biopsy versus Nodal Observation in Melanoma. N. Engl. J. Med. 370, 599–609. 10.1056/NEJMoa1310460. - DOI - PMC - PubMed
    1. Zahoor S., Haji A., Battoo A., Qurieshi M., Mir W., and Shah M. (2017). Sentinel Lymph Node Biopsy in Breast Cancer: A Clinical Review and Update. J. Breast Cancer 20, 217. 10.4048/jbc.2017.20.3.217. - DOI - PMC - PubMed
    1. Song E., Mao T., Dong H., Boisserand L.S.B., Antila S., Bosenberg M., Alitalo K., Thomas J.-L., and Iwasaki A. (2020). VEGF-C-driven lymphatic drainage enables immunosurveillance of brain tumours. Nature 577, 689–694. 10.1038/s41586-019-1912-x. - DOI - PMC - PubMed

Publication types