[Preprint]. 2024 Dec 18:2024.11.29.625909.
doi: 10.1101/2024.11.29.625909.

Leukemia-mutated proteins PHF6 and PHIP form a chromatin complex that represses acute myeloid leukemia stemness

Affiliations

Leukemia-mutated proteins PHF6 and PHIP form a chromatin complex that represses acute myeloid leukemia stemness

Aishwarya S Pawar et al. bioRxiv. .

Update in

Abstract

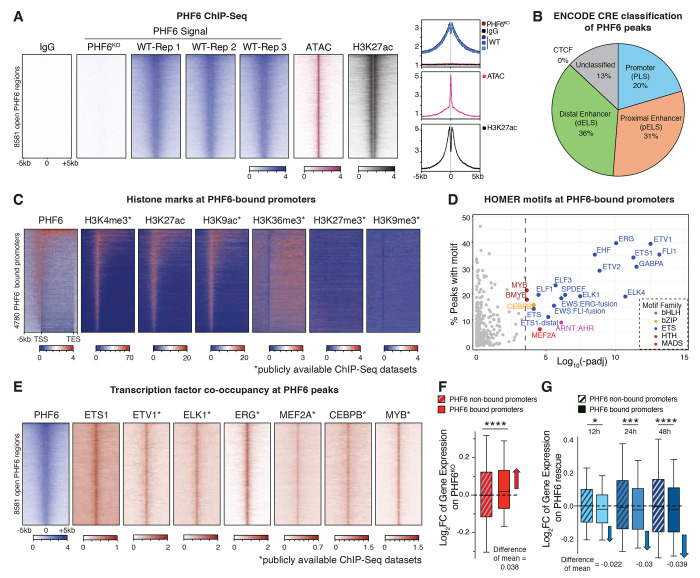
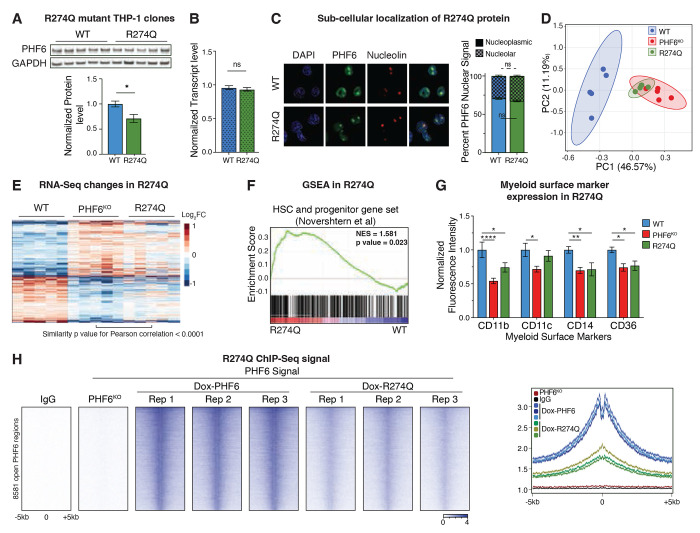
Myeloid leukemias are heterogeneous cancers with diverse mutations, sometimes in genes with unclear roles and unknown functional partners. PHF6 and PHIP are two poorly-understood chromatin-binding proteins recurrently mutated in acute myeloid leukemia (AML). PHF6 mutations are associated with poorer outcomes, while PHIP was recently identified as the most common selective mutation in Black patients in AML. Here, we show that PHF6 is a transcriptional repressor that suppresses a stemness gene network, and that PHF6 missense mutations, classified by current clinical algorithms as variants of unknown significance, produce unstable or non-functional protein. We present multiple lines of evidence converging on a critical mechanistic connection between PHF6 and PHIP. We show that PHIP loss phenocopies PHF6 loss, and that PHF6 requires PHIP to occupy chromatin and exert its downstream transcriptional program. Our work unifies PHF6 and PHIP, two disparate leukemia-mutated proteins, into a common functional complex that suppresses AML stemness.

Keywords: AML; PHF6; PHIP; leukemia; myeloid; stemness.


Conflict of interest statement

Disclosure of Conflicts of Interest Authors have no financial or non-financial competing interests relevant to this research.

Figures

Figure 1:
Figure 1:. PHF6 suppresses stemness genes and promotes differentiation
A. Lollipop plot of somatic PHF6 mutations in adults with myeloid (top) and lymphoid (bottom) hematological malignancies. Frameshift and nonsense mutations are shown on the left, and missense mutations are shown on the right. Plot was generated using COSMIC data visualized on the ProteinPaint portal. ePHD1 and ePHD2 domains of PHF6 protein are indicated. B. Immunoblot for PHF6 in WT and PHF6KO THP-1 clones. GAPDH is shown as loading control. C. Heatmap showing 853 differentially expressed genes in PHF6KO compared to WT. D. Gene set enrichment analysis (GSEA) plot showing positive enrichment of HSC and progenitor cell gene set in PHF6KO compared to WT. E. Bar graph showing normalized median fluorescence signal of myeloid surface markers in PHF6KO compared to WT. (n=3) F. Heatmap showing time course of effect of PHF6 rescue on genes differentially expressed in PHF6KO compared to WT. Pearson correlation shows similarity between expression profiles of WT and PHF6 rescue clones at 48 hrs after doxycycline treatment. G. GSEA plot showing positive enrichment of myeloid cell gene set after 48 hours of PHF6 rescue compared to baseline KO state. H. Bar graph showing normalized median fluorescence signal of myeloid markers after 48 hours of PHF6 rescue. (n=3) All bar graphs show mean ± standard error of mean (SEM), ns (not significant) = p ≥ 0.05, *p = 0.01 to 0.05, **p = 0.001 to 0.01, ***p = 0.001 to 0.0001, ****p < 0.0001, by one-way ANOVA with Sidak’s multiple comparison testing.
Figure 2:
Figure 2:. PHF6 binds gene promoters and represses transcription
A. Heatmaps (left) and meta-gene profiles (right) of 3 replicates of PHF6 ChIP-Seq signal at open high-confidence PHF6 peaks, along with ATAC-Seq and H3K27ac ChIP-Seq. IgG ChIP-Seq in WT and PHF6 ChIP-Seq in PHF6KO are shown as negative controls. B. Pie chart showing categorization of PHF6 peaks based on overlap with ENCODE-defined cis-regulatory elements (CREs). C. Heatmaps showing PHF6 ChIP-Seq along with selected active and repressive histone modifications (from our lab and from publicly available datasets) along bodies of genes with PHF6-bound promoters. D. Scatter plot showing motifs and motif families enriched at PHF6-bound promoters. E. Heatmaps showing PHF6 co-occupancy with ETS family TFs, MEF2A, CEBPB, and MYB at PHF6-bound promoters. F. Boxplots showing differential expression in PHF6KO compared to WT of genes with or without PHF6 binding at promoters. Boxplots show median (line), interquartile range (box), and minimum to maximum data range (whisker). G. Boxplots showing differential expression following time course of PHF6 rescue of genes with or without PHF6 binding at promoters. Boxplots show median (line), interquartile range (box), and minimum to maximum data range (whisker).
Figure 3:
Figure 3:. R274Q is a functionally null point mutation
A. Immunoblot (top) and bar graph showing quantification (bottom) of PHF6 protein in WT and R274Q clones in THP-1 cells. GAPDH is shown as loading control. (n=5) B. Bar graph showing RT-qPCR quantification of PHF6 mRNA levels in WT and R274Q. (n=3) C. Representative immunofluorescence images showing localization of PHF6 protein in WT and R274Q clones. DNA stain DAPI marks the nucleoplasm, and nucleolin is a nucleolar marker. Stacked bar graph shows distribution of PHF6 protein between nucleolus and nucleoplasm in WT and R274Q clones. (n=40-60 cells) D. Principal Component Analysis (PCA) plot of RNA-Seq replicates of WT, PHF6KO, and R274Q clones. E. Heatmaps showing effect of R274Q mutation on expression of genes differentially expressed in PHF6KO compared to WT. Pearson correlation shows similarity between expression profiles of R274Q and PHF6KO clones. F. GSEA plot showing positive enrichment of HSC and progenitor cell gene set in R274Q compared to WT. G. Bar graph showing normalized median fluorescence signal of myeloid surface markers in R274Q compared to WT, with PHF6KO shown for comparison. (n=3) H. Heatmaps (left) and meta-gene profiles (right) of replicates of PHF6 and R274Q ChIP-Seq signal in doxycycline-inducible clones optimized to express identical levels of WT and mutant protein. PHF6 tracks are the same as those shown in Fig 2A. All bar graphs show mean ± standard error of mean (SEM), ns (not significant) = p ≥ 0.05, *p = 0.01 to 0.05, **p = 0.001 to 0.01, ***p = 0.001 to 0.0001, ****p < 0.0001, by one-way ANOVA with Sidak’s multiple comparison testing.
Figure 4:
Figure 4:. PHF6 missense mutations cause loss of function through compromised protein abundance and chromatin occupancy
A. Lollipop plot depicting nine PHF6 missense somatic mutations selected for functional dissection. C242Y, D262V, R274Q, G287V, C297Y and I314T are within the ePHD2 domain, while C20G, P153S and E340K are outside. NoLS: Nucleolar localization signal. B. Table summarizing functional characterization of PHF6 missense mutants (details in Fig S4). Patient numbers were obtained from COSMIC through the ProteinPaint portal. Clinical classification of mutations was performed by the Penn Center for Personalized Diagnostics. Pathogenicity prediction was performed on ePHD2 mutants using 4 concordant meta-predictors: REVEL, MetaLR, MetaSVM, and Condel (Fig S4D). ϕ indicates mutants unable to be analyzed due to the unavailability of structure for non-ePHD2 domains. For protein and mRNA levels, ↔ indicates no change. ChIP signal is the average ChIP-qPCR signal at 5 PHF6 peaks, † indicates mutants skipped for ChIP-qPCR due to low protein level. Values marked in red are considered pathogenic or functionally detrimental for the analysis in question. C. Immunoblots (left) showing PHF6 protein level in one representative clone for each missense mutation compared to WT and PHF6KO. GAPDH is shown as loading control. Bar graph (right) quantifies PHF6 protein in multiple replicate clones for each mutant (Fig 4SC), normalized to GAPDH. R274Q quantification shown here is the same as that shown in Fig 3A, and is included here for completeness. (n=4-9 clones for each mutant) D. Bar graph showing RT-qPCR quantification of PHF6 mRNA levels in mutant clones compared to WT. R274Q quantification shown here is the same as that shown in Figure 3B, and is included here for completeness. (n=3) E. Bar graph showing PHF6 ChIP-qPCR signal at a representative PHF6 peak in mutants compared to WT. (n=3), † indicates mutants skipped due to low protein levels (below 70% of WT clones). All bar graphs show mean ± standard error of mean (SEM), ns (not significant) = p ≥ 0.05, *p = 0.01 to 0.05, **p = 0.001 to 0.01, ***p = 0.001 to 0.0001, ****p < 0.0001, by one-way ANOVA with Sidak’s multiple comparison testing.
Figure 5:
Figure 5:. PHF6 cannot occupy chromatin without its functional partner PHIP, a newly-described AML-mutated protein
A. Table showing the top five correlated gene dependencies for PHF6 in the Broad Institute DepMap project. B. Scatter plot showing correlation of CRISPR screen (Chronos) gene scores for PHF6 and PHIP in 1,150 cell lines screened in DepMap. C. Table showing frequencies of PHF6 and PHIP mutations in databases of patients with myeloid neoplasms. Data were obtained from cBioPortal. D. Table summarizing features of rare neurodevelopmental syndromes caused by germline mutations of PHF6 and PHIP. Features marked in red are common between both syndromes. E. Immunoblots of PHF6 and PHIP in PHIPKO and DKO clones. GAPDH and H3 are shown as loading controls. F. Stacked bar graph showing distribution of PHF6 protein between nucleolus and nucleoplasm in WT and PHIPKO clones. (n=40-60 cells) G. PCA plot of RNA-Seq replicates of WT, PHF6KO, PHIPKO and DKO clones. H. Heatmap showing effects in PHIPKO and DKO on expression of genes differentially expressed in PHF6KO compared to WT. Pearson correlation shows similarities between expression profiles of single and double knockout clones. I. Bar graph showing normalized median fluorescence signal of myeloid surface markers in PHIPKO and DKO clones compared to WT clones. (n=3) J. Heatmaps showing PHIP ChIP-Seq signal at PHF6 peaks. PHF6 tracks are the same as those shown in Fig 2A and Fig 3H. K. Venn diagram showing overlap of PHF6 and PHIP peaks. L. Immunoblots showing pulldown of PHF6 with PHIP-ChIP. IgG-ChIP, and PHIP-ChIP in PHIPKO and PHF6KO clones are shown as negative controls. H3 is shown as a positive control for chromatin pulldown. M. Heatmaps (left) and meta-gene profiles (right) of replicates of PHF6 ChIP-Seq signal in WT and PHIPKO clones. PHF6 tracks are the same as those shown in Fig 2A, 3H, and 3J. All bar graphs show mean ± standard error of mean (SEM), ns (not significant) = p ≥ 0.05, *p = 0.01 to 0.05, **p = 0.001 to 0.01, ***p = 0.001 to 0.0001, ****p < 0.0001, by one-way ANOVA with Sidak’s multiple comparison testing.
Figure 6:
Figure 6:. PHF6-PHIP complex represses AML stemness
A. Model of PHIP-dependent PHF6 role in hematopoietic and leukemic stemness: PHF6 and PHIP form a complex on promoters bound by ETS factors and repress their transcription, thereby repressing a stemness gene network. In a subset of acute or chronic myeloid malignancies, loss of PHF6 chromatin occupancy, either through loss of PHF6 itself, through missense mutations in PHF6 that impair its protein stability or chromatin occupancy, or through loss of PHIP, eliminates this repression and increases stemness.

References

    1. Papaemmanuil E. et al. Genomic Classification and Prognosis in Acute Myeloid Leukemia. N. Engl. J. Med. 374, 2209–2221 (2016). - PMC - PubMed
    1. Ogawa S. Genetics of MDS. Blood 133, 1049–1059 (2019). - PMC - PubMed
    1. Nangalia J. & Green A. R. Myeloproliferative neoplasms: from origins to outcomes. Blood 130, 2475–2483 (2017). - PubMed
    1. Sood R., Kamikubo Y. & Liu P. Role of RUNX1 in hematological malignancies. Blood 129, 2070–2082 (2017). - PMC - PubMed
    1. Jann J.-C. & Tothova Z. Cohesin mutations in myeloid malignancies. Blood 138, 649–661 (2021). - PMC - PubMed

Publication types

LinkOut - more resources