[Preprint]. 2024 Dec 6:2024.10.06.616889.
doi: 10.1101/2024.10.06.616889.

Decoding the biogenesis of HIV-induced CPSF6 puncta and their fusion with the nuclear speckle

Affiliations

Decoding the biogenesis of HIV-induced CPSF6 puncta and their fusion with the nuclear speckle

Chiara Tomasini et al. bioRxiv. .

Abstract

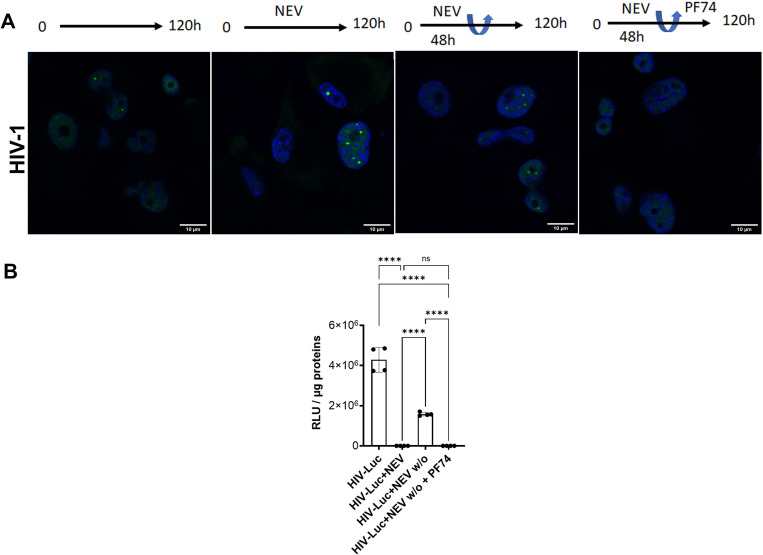
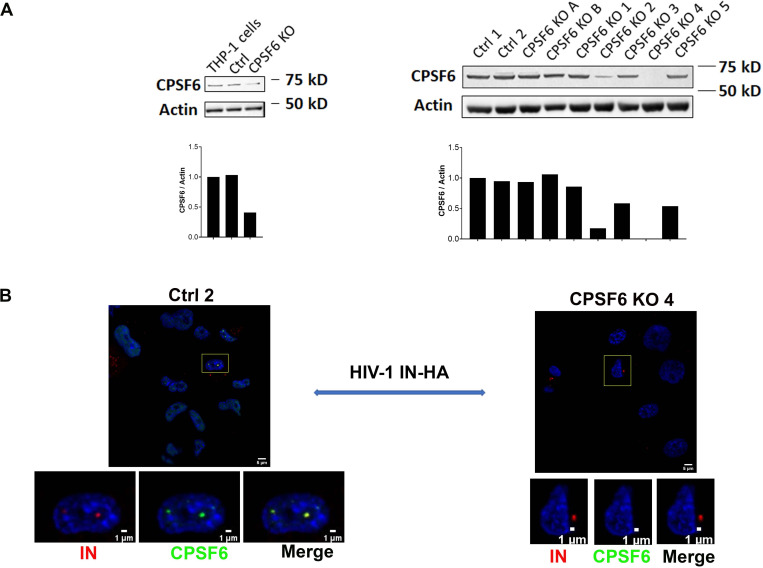
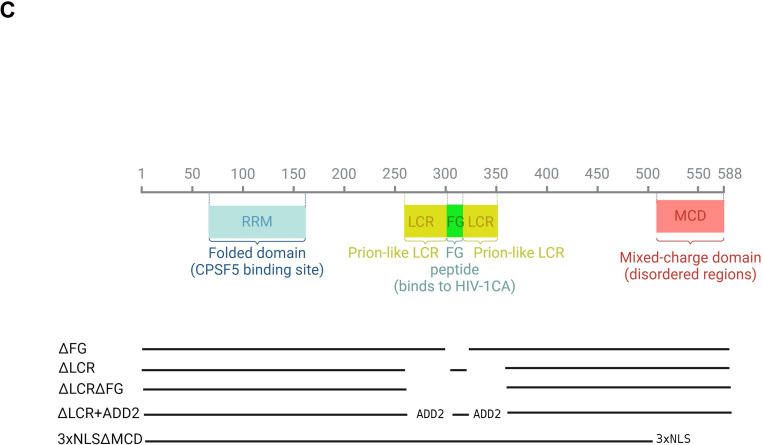
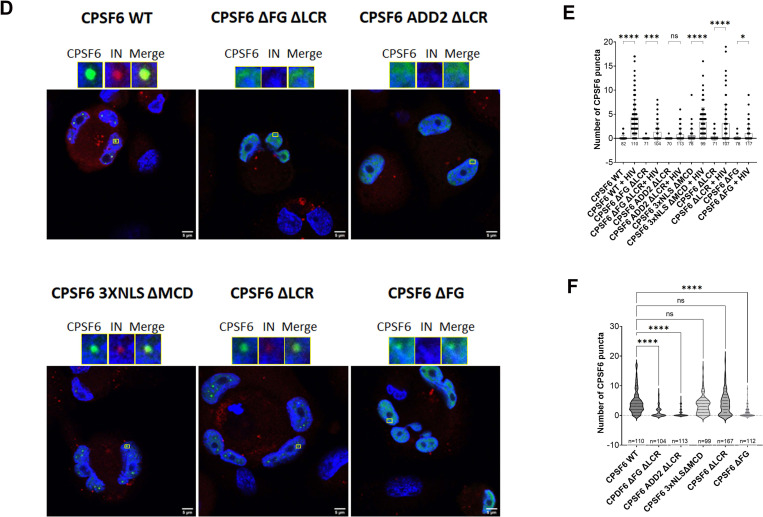
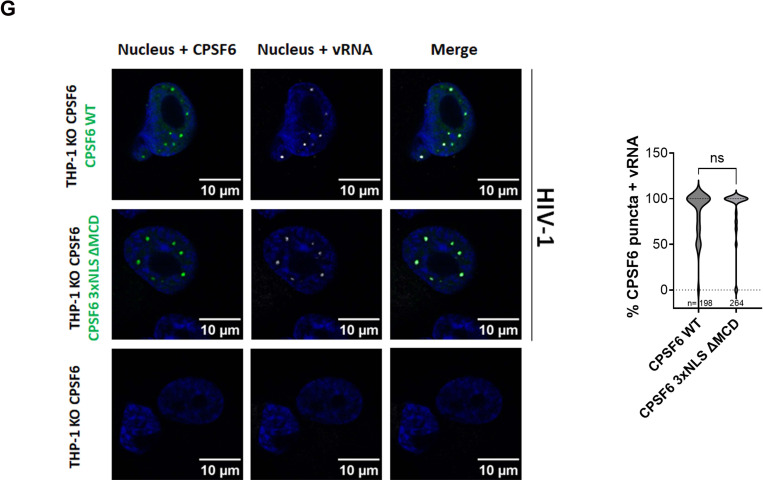
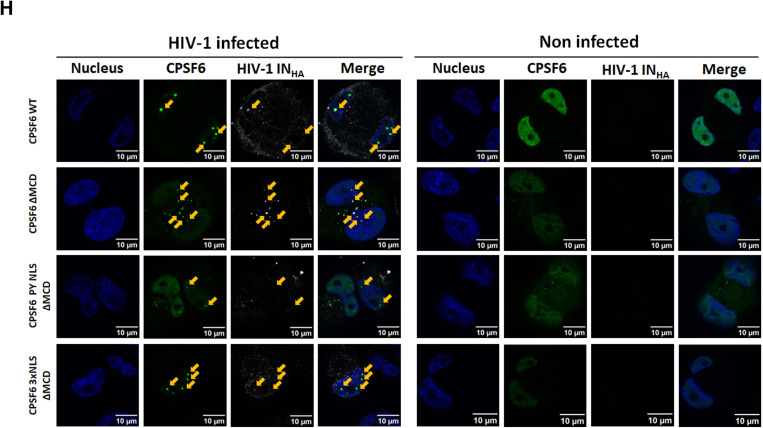
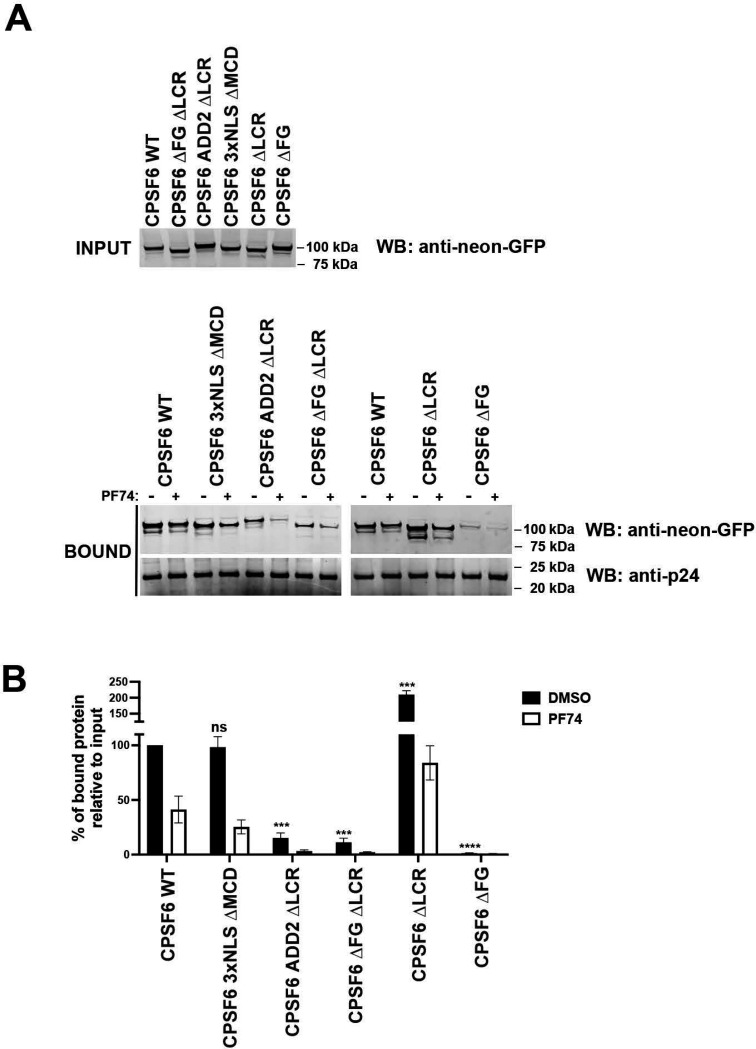
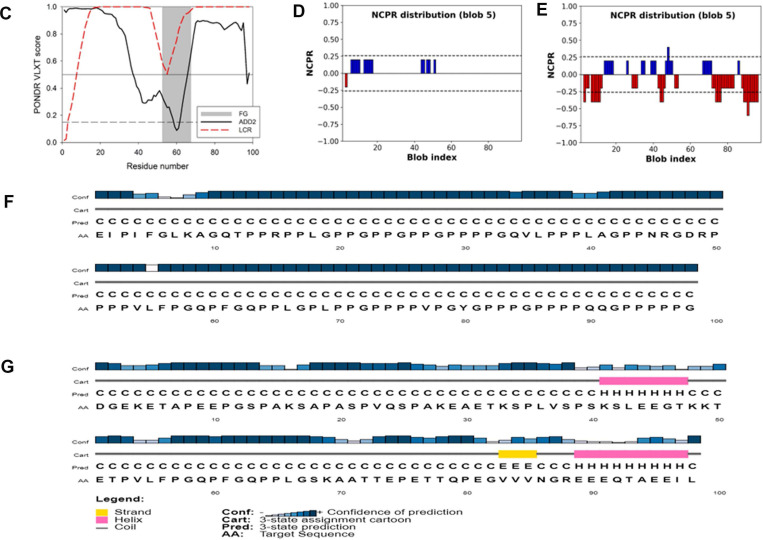
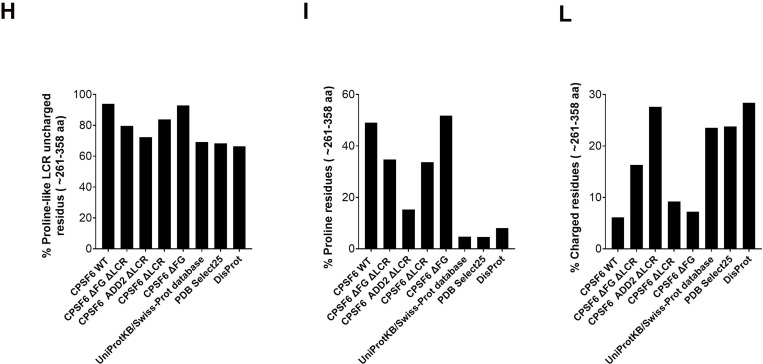
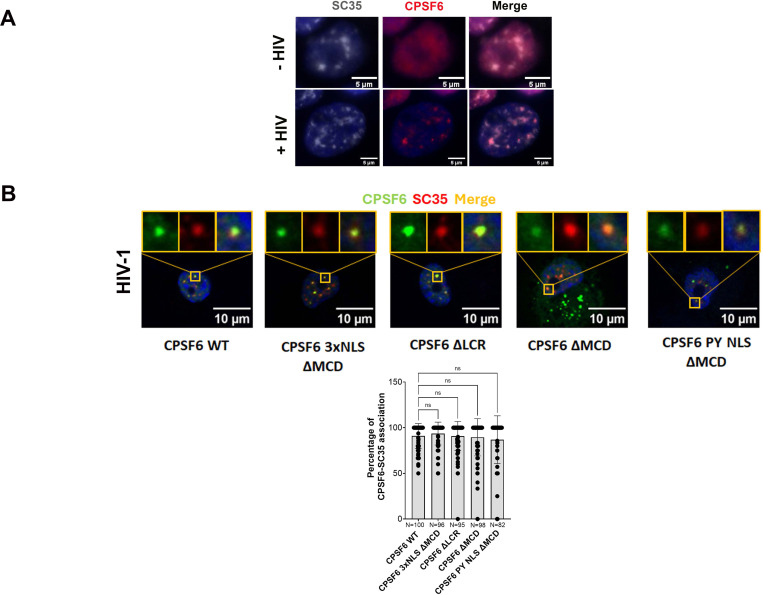
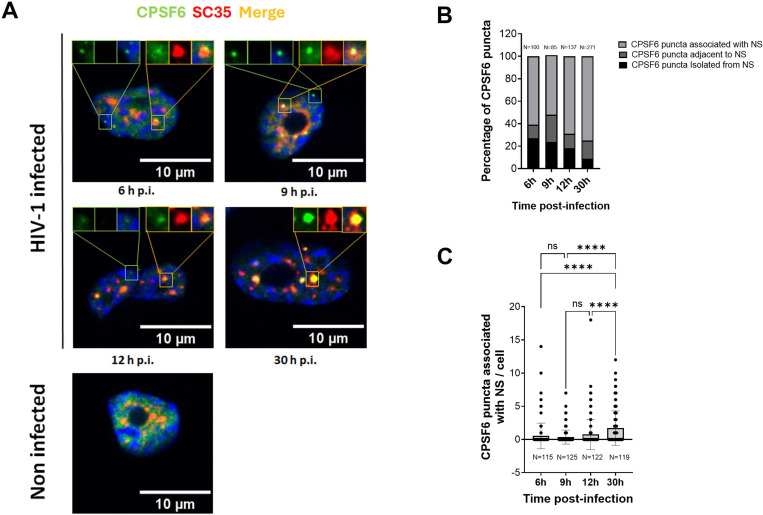
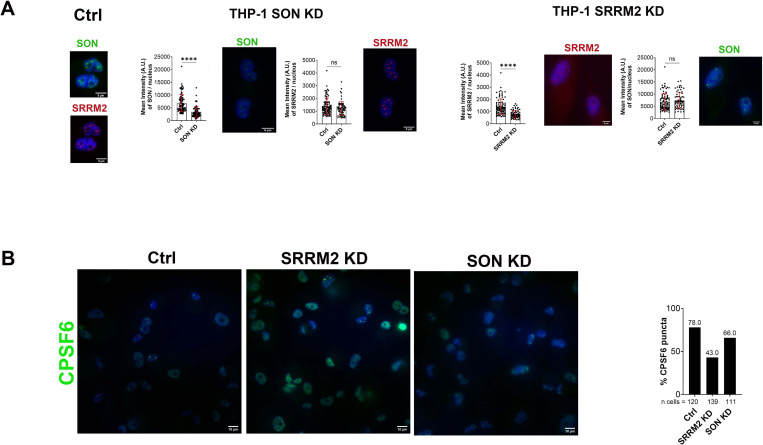
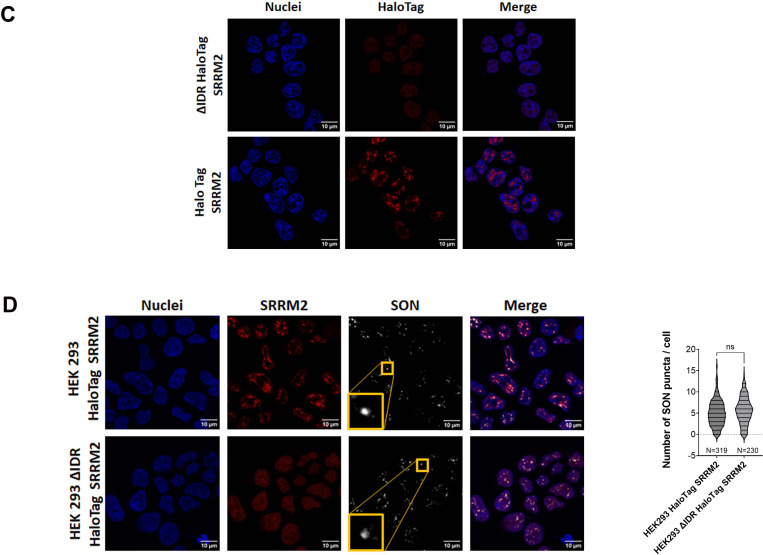
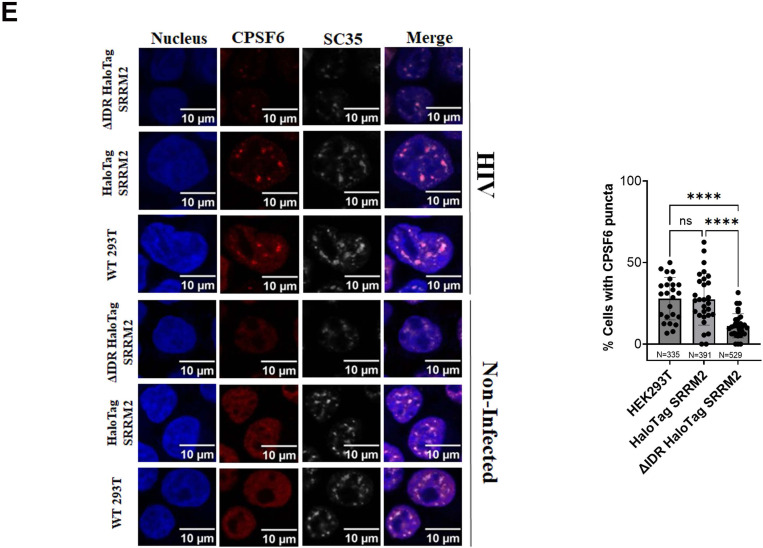
Viruses rely on host cellular machinery for replication. After entering the nucleus, the HIV genome accumulates in nuclear niches where it undergoes reverse transcription and integrates into neighboring chromatin, promoting high transcription rates and new virus progeny. Despite anti-retroviral treatment, viral genomes can persist in these nuclear niches and reactivate if treatment is interrupted, likely contributing to the formation of viral reservoirs. The post-nuclear entry dynamics of HIV remain unclear, and understanding these steps is critical for revealing how viral reservoirs are established. In this study, we elucidate the formation of HIV-induced CPSF6 puncta and the domains of CPSF6 essential for this process. We also explore the roles of nuclear speckle scaffold factors, SON and SRRM2, in the biogenesis of these puncta. Through genetic manipulation and depletion experiments, we demonstrate the key role of the intrinsically disordered region of SRRM2 in enlarging nuclear speckles in the presence of the HIV capsid. We identify the FG domain of CPSF6 as essential for both puncta formation and binding to the viral core, which serves as the scaffold for CPSF6 puncta. While the low-complexity regions (LCRs) modulate CPSF6 binding to the viral capsid, they do not contribute to puncta formation, nor do the disordered mixed charge domains (MCDs) of CPSF6. These results demonstrate how HIV evolved to hijack host nuclear factors, enabling its persistence in the host. Of note, this study provides new insights into the underlying interactions between host factors and viral components, advancing our understanding of HIV nuclear dynamics and offering potential therapeutic targets for preventing viral persistence.


Figures

Figure 1.
Figure 1.. Role of HIV-induced CPSF6 puncta in the nuclear RT upon removal of NEV.
A) A) THP-1 cells, infected with VSV-G Δenv HIV-1 (NL4.3) ΔR LUC (MOI 10) in presence or not of Nevirapine (10 μM) for 5 days, or in presence of Nevirapine (10 μM) for 2 days and then the remaining 3 days without drug or in presence of Nevirapine (10 μM) for 2 days then in presence of PF74 (25 μM). Confocal microscopy images, to verify the presence of CPSF6 clusters, the cells are stained with anti-CPSF6 antibody (green). Nuclei are stained with Hoechst (blue). Scale bar 10 μm. B) Luciferase Assay, to verify luciferase expression in the aforementioned samples. Luciferase values were normalized by total proteins revealed with the Bradford kit. One-way ANOVA statistical test with multiple comparison was performed (****=p<0.0001; *=p<0.05; ns=p>0.05). Data are representative of two independent experiments.
Figure 2.
Figure 2.. Role of CPSF6 Domains in HIV-Induced CPSF6 Puncta.
A) Western blots demonstrate CPSF6 depletion using a specific antibody against CPSF6 in THP-1 cells subjected to CRISPR Cas9 methods: CRISPR Cas9 bulk (left), and CRISPR Cas9 clones selected by limiting dilution (right). Each condition is normalized for actin labeling. The ratio between the intensity signal of CPSF6 and actin was analyzed via ImageJ and is plotted below each western blot. B) Confocal microscopy images of THP-1 ctrl CRISPR clone 2 cells (Ctrl 2) and THP-1 duplex1–2-3 CRISPR clone 4 cells (CPSF6 KO 4) infected with HIV-1ΔEnvINHAΔNef Vpx (LAI) Bru (MOI 10) in the presence of Nevirapine (10 μM). The cells are stained 30 h p.i. with anti-CPSF6 antibody and anti-HA antibodies to detect HA tagged integrase (IN). C) Schema of CPSF6 isoform 588aa deletion mutants. D) Confocal microscopy images of THP-1 CPSF6 KO cells, transduced with different mutants of CPSF6, infected with HIV-1ΔEnvINHAΔNef Vpx (LAI) Bru (MOI 10) in presence of Nevirapine (10 μM). The cells are stained with CPSF6 and HA antibody 30 h p.i.. Scale bar 5μm. E) Analysis of the number of CPSF6 clusters in THP-1 CPSF6 KO cells transduced with different mutants of CPSF6, not infected or infected in presence of Nevirapine (10 μM) (the number of analyzed cells is shown under the x-axis). Statistical test: ordinary one-way ANOVA (****=p<0.0001; ***=p<0.001; *=p<0.05; ns=p>0.05). F) The plot compares the number of CPSF6 clusters per cell in THP-1 CPSF6 KO cells transduced with different mutants of CPSF6, infected with HIV-1 in the presence of Nevirapine (10 μM). Statistical test: ordinary one-way ANOVA (****=p<0.0001; ns=p>0.05). G) Confocal microscopy images of THP-1 CPSF6 KO clone 4, non-transduced and non-infected or transduced with WT CPSF6 and CPSF6 3xNLSΔMCD and infected with HIV-1ΔEnvINHAΔNef Vpx (LAI) Bru (MOI 10) in presence of Nevirapine (10 μM). Immuno-RNA FISH: the cells are stained with CPSF6 (green) antibody and with 24 probes against HIV-1 Pol sequence (gray)(RNA-FISH) 25 h p.i. Nuclei are stained with Hoechst (blue). Scale bar 10 μm. Violin plot presenting the percentage of CPSF6 clusters colocalizing with the viral RNA in THP-1 CPSF6 KO clone 4 cells transduced with LVs expressing CPSF6 WT or CPSF6 3xNLSΔMCD (respectively n=73 and n=103) and infected with HIV-1ΔEnvINHAΔNef Vpx (LAI) Bru (MOI 10) in presence of Nevirapine (10 μM). A total of 198 CPSF6 WT clusters and 264 CPSF6 3xNLSΔMCD clusters were counted. Statistical test: unpaired t-test, ns=p>0.05. H) Confocal microscopy images of THP-1 KO CPSF6 cells transduced with WT CPSF6 and CPSF6 ΔMCD without NLS, with 3xNLS or with PY NLS, respectively. Cells were differentiated for 3 days, transduced with CPSF6 lentiviral vectors (MOI 1) for 3 days and infected for 24 h with HIV-1ΔEnvINHAΔNef Vpx (LAI) Bru (MOI 10) in presence of Nevirapine (10 uM) (left panels). The panels on the right show transduced and uninfected cells. CPSF6 and the IN tagged with the HA are labeled with anti-CPSF6 (green) and anti-HA (white) antibodies, respectively. Nuclei are stained with Hoechst (blue). The arrows show CPSF6 puncta in colocalization with INHA. Scale bar 10μm.
Figure 3.
Figure 3.. Evaluation of CPSF6 Deletion Mutants’ Binding Capacity to the Viral Core.
A) Ability of wild type and mutant CPSF6 proteins to bind to the HIV-1 core. Cellular extracts derived from human 293T cells expressing similar levels of the indicated CPSF6 proteins (INPUT) were incubated with HIV-1 capsid stabilized tubes for 1 hour at room temperatures in the presence and absence of 10 μM PF74, as described in materials and methods. As a carrier control, we utilized DMSO. Subsequently, HIV-1 capsid stabilized tubes were washed, and the bound proteins eluted 1X Laemmli buffer 1X. The BOUND fractions were analysed by Western blotting using antibodies against neon-GFP and the HIV-1 capsid. B) Experiments were repeated at least three times and the average BOUND fraction relative to the INPUT fraction normalized to wild type binding are shown for the different CPSF6 mutants. *** indicates a p-value < 0.001; **** indicates a p-value < 0.0001; and ns indicates no significant difference as determined by unpaired t-tests. C) Physicochemical characteristics of the LCR-FG and ADD2-FG sequences. Intrinsic disorder predispositions evaluated by PONDR® VLXT. Position of the FR segment within the LCR-FG and ADD2-FG sequences is shown as gray shaded area. D) Linear distribution of the net charge per residue (NCPR) within the LCR-FG sequence evaluated by CIDER. E) Linear distribution of the net charge per residue (NCPR) within the ADD2-FG sequence evaluated by CIDER. F) Secondary structure propensity of the LCR-FG sequence evaluated by PSIPRED. G) Secondary structure propensity of the ADD2-FG sequence evaluated by PSIPRED. H) Analysis of the peculiarities of the amino acid compositions of the intrinsically disordered C-terminal domain (residues 261–358) of human CPSF6 and its different mutants. Relative abundance of prion-like LCR defining uncharged residues in analyzed protein segments. I) Relative abundance of proline residues in analyzed protein segments. L) Relative abundance of charged residues in analyzed protein segments. The values were calculated by dividing numbers of prion-like LCR defining uncharged (Ala, Gly, Val, Phe, Tyr, Leu, Ile, Ser, Thr, Pro, Asn, Gln), Pro, and charged (Asp, Glu, Lys, Arg) residues by the total number of amino acids in the respective protein fragments. Corresponding values for all protein sequences deposited in the UniProtKB/Swiss-Prot database, PDB Select25, and DisProt are shown for comparison.
Figure 4.
Figure 4.
A) Epifluorescence microscopy images of both infected and non-infected 293T cells showing the presence of CPSF6 clusters only in the infected condition. CPSF6 and SC35 are labeled with anti-CPSF6 (red) and anti-SC35 (gray) antibodies, respectively. Nuclei are stained with Hoechst (blue). Scale bar 5μm. B) Confocal microscopy images of THP-1 KO CPSF6 cells, differentiated for 3 days, transduced with CPSF6 lentiviral vector (MOI 1) (specifically WT CPSF6, CPSF6 ΔLCRs, CPSF6 ΔMCD with 3xNLS, without NLS, or with PY NLS) for 3 days and infected for 24 h with HIV-1ΔEnvINHAΔNef Vpx (LAI) Bru (MOI 10) in presence of Nevirapine (10 uM). CPSF6 and nuclear speckles were labeled with anti-CPSF6 (green) and anti-SC35 (red) antibodies, respectively. Nuclei are stained with Hoechst (blue). Scale bar 10μm. The percentage of CPSF6 puncta associated with SC35 per field of view is shown in the graph. N cells were counted in each condition and a one-way ANOVA statistical test with multiple comparison was performed; ns= p value > 0.05.
Figure 5.
Figure 5.. Dynamics of the HIV-induced CPSF6 puncta formation and their fusion with NSs.
A) Time course of infection of THP-1, 6h.p.i., 9h.p.i., 12h.p.i., 30h.p.i. or non infected. Cells were stained with antibodies against CPSF6 (green) and SC35 (red). B) The graph shows the percentage of CPSF6 puncta associated with NS or adjacent to NS or isolated from NS at different time post-infection. C) The graph shows the progression of CPSF6 puncta associated to NS during the time post-infection. N indicates the number of cells analyzed. One-way ANOVA statistical test with multiple comparison was performed; ns= p value > 0.05; **** indicates a p-value < 0.0001.
Figure 6.
Figure 6.. Role of SRRM2 and SON in the Formation of HIV-Induced CPSF6 puncta.
A) Depletion of SON and SRRM2 in THP-1 cells using AUMsilence™ ASO technology. The degree of depletion is quantified by mean intensity through immunofluorescence using antibodies against SON and SRRM2, respectively. Scale bar 5μm. B) The percentage of CPSF6 puncta formation is quantified by IF in THP-1 cells knocked down for SON, SRRM2, and control (Ctrl) infected with HIV-1 (MOI 25) for 48 h. CPSF6 is stained with an antibody against CPSF6 (green), and nuclei are stained with Hoechst (blue). The graph on the right reports the percentage of CPSF6 clusters calculated from more than 100 cells. Scale bar 10μm. Experiments were performed at least twice. C) Confocal microscopy images of ΔIDR HaloTag SRRM2 HEK293 and HaloTag SRRM2 HEK293 cells stained with the halo tag ligand (red), and nuclei (blue). Scale bar 10μm. D) Confocal microscopy images of HaloTag SRRM2 HEK293 and ΔIDR HaloTag SRRM2 HEK293 cells, both labeled with anti-SRRM2 (red) and anti-SON (gray) antibodies. Nuclei are stained with Hoechst (blue). Scale bar 10μm. Statistical studies are summarized in the violin plot which displays the distribution of the number of SON puncta per cell in the two conditions. N cells were counted and Kolmogorov Smirnov test was performed, ns= p>0.05. E) Confocal microscopy images of HaloTag SRRM2 HEK293 and ΔIDR HaloTag SRRM2 HEK293 cells, either non-infected or infected for 24 h with ΔEnvHIV-1 LAI (BRU) (MOI 10) in the presence of Nevirapine (10 μM). CPSF6 and SC35 are labeled with anti-CPSF6 (red) and anti-SC35 (gray) antibodies, respectively. Nuclei are stained with Hoechst (blue). The plot shows the mean ± SD of the percentage of cells with CPSF6 clusters calculated in n fields of view (n=24, 29, 32); N is the number of cells analyzed for each of the three different cell lines; an unpaired t-test was performed, ****=p<0.0001, ns=p>0.05. Scale bar 10μm. Experiments were performed at list twice.

References

    1. Ay S., and Di Nunzio F. (2023). HIV-Induced CPSF6 Condensates. J Mol Biol 435, 168094. - PubMed
    1. Bairoch A., Apweiler R., Wu C.H., Barker W.C., Boeckmann B., Ferro S., Gasteiger E., Huang H., Lopez R., Magrane M., et al. (2005). The Universal Protein Resource (UniProt). Nucleic Acids Res 33, D154–159. - PMC - PubMed
    1. Barre-Sinoussi F., Chermann J.C., Rey F., Nugeyre M.T., Chamaret S., Gruest J., Dauguet C., Axler-Blin C., Vezinet-Brun F., Rouzioux C., et al. (1983). Isolation of a T-lymphotropic retrovirus from a patient at risk for acquired immune deficiency syndrome (AIDS). Science 220, 868–871. - PubMed
    1. Berman H.M., Westbrook J., Feng Z., Gilliland G., Bhat T.N., Weissig H., Shindyalov I.N., and Bourne P.E. (2000). The Protein Data Bank. Nucleic Acids Res 28, 235–242. - PMC - PubMed
    1. Blanco-Rodriguez G., and Di Nunzio F. (2021). The Viral Capsid: A Master Key to Access the Host Nucleus. Viruses 13. - PMC - PubMed

Publication types

LinkOut - more resources