[Preprint]. 2025 Mar 13:2024.12.02.626335.
doi: 10.1101/2024.12.02.626335.

Cortical dynamics in hand/forelimb S1 and M1 evoked by brief photostimulation of the mouse's hand

Affiliations

Cortical dynamics in hand/forelimb S1 and M1 evoked by brief photostimulation of the mouse's hand

Daniela Piña Novo et al. bioRxiv. .

Update in

Abstract

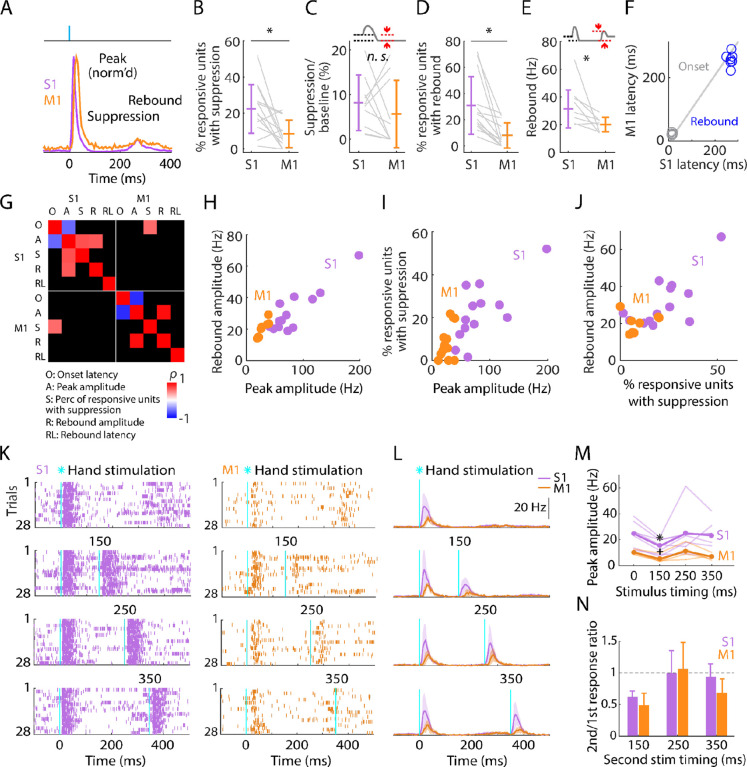
Spiking activity along synaptic circuits linking primary somatosensory (S1) and motor (M1) areas is fundamental for sensorimotor integration in cortex. Circuits along the ascending somatosensory pathway through mouse hand/forelimb S1 and M1 were recently described in detail (Yamawaki et al., 2021). Here, we characterize the peripherally evoked spiking dynamics in these two cortical areas. Brief (5 ms) optogenetic photostimulation of the hand generated short (~25 ms) barrages of activity first in S1 (onset latency 15 ms) then M1 (10 ms later). The estimated propagation speed was 20-fold faster from hand to S1 than from S1 to M1. Amplitudes in M1 were strongly attenuated. Responses were typically triphasic, with suppression and rebound following the initial peak. Evoked activity in S1 was biased to middle layers, consistent with thalamocortical connectivity, while that in M1 was biased to upper layers, consistent with corticocortical connectivity. Parvalbumin (PV) inhibitory interneurons were involved in each phase, accounting for three quarters of the initial spikes generated in S1, and their selective photostimulation sufficed to evoke suppression and rebound in both S1 and M1. Partial silencing of S1 by PV activation during hand stimulation reduced the M1 sensory responses. Overall, these results characterize how evoked spiking activity propagates along the hand/forelimb transcortical loop, and illuminate how in vivo cortical dynamics relate to the underlying synaptic circuit organization in this system.


Conflict of interest statement

Competing interests - The authors declare that no competing interests exist.

Figures

Figure 1.
Figure 1.. Brief stimulation of the hand evokes barrages of spiking activity in S1 and M1
(A) Experimental approach. Schematic depicts optogenetic photostimulation of the hand of an awake head-fixed mouse via an optical fiber in the holding bar, with cortical population spiking activity recorded on linear arrays inserted in both S1 and M1. Image of the hand shows green fluorescence across the glabrous skin of the palm, from labeling of mechanoreceptor afferents (PV-Cre x Ai32 mouse). (B) Example segment of a recording, showing for three trials the raster plots of spiking activity for active units in S1 (top, purple) and M1 (bottom, orange) during photostimulation of the hand (25 trials total, 1 s inter-stimulus interval, 5 ms duration, 5 mW light intensity at the fiber tip, 910 μm core diameter).
Figure 2.
Figure 2.. Evoked cortical responses follow a triphasic peak-suppression-rebound pattern
(A) Top: Example rasters of one stimulus-responsive unit in each area, ordered by trial and aligned to the onset of photostimulation. Bottom: Peristimulus time histogram (PSTH) of average firing rate across trials (mean ± s.d.). (B) Top: All stimulus-responsive units on the probes for one trial. Bottom: Average PSTH across units (mean ± s.d.). (C) Top: All units on the probes, for all trials. Bottom: Overall average PSTH (mean ± s.d.). (D) Same as in C, but only including stimulus-responsive units. (E) Top: All units on the probes, for all trials with the hand off the light-delivery bar. Bottom: Overall average PSTH (mean ± s.d.). (F) PSTHs for each pairwise S1-M1 recording. Inset (top left) shows brain schematic with locations of the S1 and M1 probes for each experiment. Bottom: Average (mean ± s.d.) PSTHs of responsive units aligned to the photostimulation (dashed line), for each experiment (13 recordings from 9 mice). (G) Average stimulus-evoked cortical responses in forelimb S1 and M1. Grand average (mean ± s.d.) PSTHs across recordings aligned to the onset of the hand photostimulation. Light gray traces: same, but for trials with the hand off the light-delivery bar.
Figure 3.
Figure 3.. Initial peak responses in M1 are delayed and attenuated relative to S1
(A) Scaled versions of the grand-average PSTHs, showing the first 100 ms of the responses. (B) Percentages of all recorded units that were stimulus responsive, with the overall averages (mean ± s.d.) and group comparison (Wilcoxon’s signed rank test, W = 80, p = 0.01; n = 13 recordings from 9 mice). (C) Onset latencies in S1 and M1, averaged over individual responsive units for each experiment (gray lines), along with the overall averages (mean ± s.d.) and group comparison (W = 0, p = 2 × 10⁻⁴). The schematic above the plot depicts measurement of onset latency relative to stimulus onset. (D) Left: Same as C, but for peak amplitudes (W = 91, p = 2 × 10⁻⁴). Right: Same, but calculated for single units only (W = 88, p = 0.01). (E) Same as C, but for response durations (W = 91, p = 2 × 10⁻⁴). (F) Correlation matrix showing correlations among average response properties for all recordings (mean values across individual responsive units for each experiment). Colors indicate Spearman’s correlation index, rho (ρ). Non-significant correlations are shown in black. (G) Peak amplitude versus onset latency (S1: ρ = −0.58, p = 0.04; M1: ρ = −0.82, p = 0.001). (H) Response duration versus peak amplitude (S1: ρ = 0.02, p = 0.95; M1: ρ = 0.64, p = 0.02).
Figure 4.
Figure 4.. Post-peak activity is suppressed in S1 and rebounds in both S1 and M1
(A) Scaled versions of the grand-average PSTHs, showing the first 400 ms of the responses. (B) Percentage of stimulus-responsive units in S1 and M1 exhibiting significant post-peak suppression (relative to the pre-stimulus baseline), for each experiment (gray lines) along with the overall averages (mean ± s.d.) and group comparison (Wilcoxon’s signed rank test, W = 82, p = 0.01; n = 13 recordings from 9 mice, stimulus-responsive units only). (C) Suppression as a percentage of baseline firing rate amplitude for units in B. The schematic above the plot depicts measurement of amplitude during the suppression period (from 110 to 170 ms post-stimulation) (W = 36, p = 0.43). (D) Percentage of stimulus-responsive units exhibiting significant post-suppression rebound (relative to the pre-stimulus baseline), for each experiment (gray lines) along with the overall averages (mean ± s.d.) and group comparison (W = 91, p = 2 × 10⁻⁴). (E) Rebound amplitude for units in D (W = 35, p = 0.02). (F) Average onset and rebound latencies in M1 versus S1, for each experiment (circles). (G) Correlation matrix showing correlations among average response properties for all recordings (mean values across individual responsive units for each experiment). Colors indicate Spearman’s correlation index, rho (ρ). Non-significant correlations are shown in black. (H) Rebound amplitude versus peak amplitude (S1: ρ = 0.65, p = 0.02; M1: ρ = 0.95, p = 0.001). (I) Percentage of stimulus-responsive units with suppression versus peak amplitude (S1: ρ = 0.68, p = 0.01; M1: ρ = 0.38, p = 0.2). (J) Rebound amplitude versus percentage of stimulus-responsive units with suppression (S1: ρ = 0.52, p = 0.07; M1: ρ = 0.14, p = 0.75). (K) Example segment of a recording, showing raster plots of population spiking activity in S1 and M1, aligned to single (top) and double photostimulation of the hand (28 trials total). (L) Grand average (mean ± s.d.) PSTHs across recordings, aligned to the onset of the hand photostimulation (n = 7 recordings from 4 mice in S1, and 4 recordings from 3 mice in M1). (M) Peak amplitudes in S1 and M1 evoked by a single stimulus (at time 0) and a second stimulus delivered with variable lag (150, 250, or 350 ms after the first), for each experiment (thin lines) along with the overall averages (thick lines, mean), and group comparisons (Friedman test, S1 latency effect, χ32 = 8.66, p = 0.03, M1 latency effect, χ32 = 9.3, p = 0.02; Dunn-Sidak’s post hoc multiple comparisons within S1, *: p = 0.04, and M1, +: p = 0.04 for second pulse at 150 ms versus first pulse; no other significant post-hoc differences were found). (N) S1 and M1 peak amplitudes evoked by the second pulse, normalized to the first pulse’s response (horizontal dashed line).
Figure 5.
Figure 5.. Laminar profiles of evoked activity in S1 and M1
(A) Left: Example image of S1 cortex with labeled corticospinal neurons (green) and PV neurons (red). Right: Evoked spiking activity of all active units across the depth of the cortex (average of 11 recordings from 8 mice). Each unit’s spikes were binned according to its depth, in 20 bins total across the full cortical depth, where 0 is the pial surface and 1 is the lower boundary of cortex with white matter. Plot shows the grand average amplitude in each depth bin (mean ± s.e.m across recordings), measured around the time of the peak response. (B) Same, for M1 laminar profile.
Figure 6.
Figure 6.. PV neurons in S1 are strongly recruited by hand stimulation
(A) Experimental approach. Schematic depicts recording during optogenetic stimulation of PV neurons in S1. (B) Left: Example segment of a recording, shown as a raster plot of population spiking activity during the local optogenetic stimulation (laser on, 25 trials total, 1 s inter-stimulus interval, 20 ms duration, 1 mW light intensity at the fiber tip, 105 μm core diameter). Right: Raster plot of spiking activity aligned to sham events triggered at the same interval as the laser stimulus, but with the laser off. (C) Top: Grand average (mean ± s.d.) PSTHs for the stimulus-responsive opto-tagged PV (green) and non-PV (black) units in S1 across recordings (12 recordings from 8 mice) aligned to the onset of the hand photostimulation. Inset on the right shows the same data on a magnified y-axis scale. Middle: Grand average (mean ± s.d.) peak-normalized PSTHs. Bottom: Average (mean ± s.d.) difference of PV minus non-PV peak-normalized PSTHs. (D) Percentage of stimulus responsive units that are PV versus non-PV, for each experiment (gray lines) along with the overall averages (mean ± s.d.) and group comparison (Wilcoxon’s signed rank test, W = 77, p = 0.001). (E) Percentage of PV and non-PV units that are stimulus responsive in each experiment (Wilcoxon’s signed rank test, W = 78, p = 5 × 10⁻⁴). (F) Percentage of evoked spikes coming from PV and non-PV units over the time-course of the initial peak response (W = 78, p = 5 × 10⁻⁴). (G) Onset latencies of PV and non-PV units (W = 0, p = 5 × 10⁻⁴). (H) Peak amplitudes of PV and non-PV units (W = 75, p = 0.002). (I) Percentage of stimulus-responsive PV and non-PV units with significant suppression (in the time window 110 to 170 ms) compared to pre-stimulus baseline (W = 68, p = 0.02). (J) Suppression as a percentage of baseline firing rate amplitude for PV and non-PV units in I (W = 23, p = 0.7). (K) Percentage of stimulus-responsive PV and non-PV units with significant rebound compared to pre-stimulus baseline (W = 68, p = 0.02). (L) Rebound amplitude for PV and non-PV units in K (W = 55, p = 0.2). (M) Rebound latency for PV and non-PV units in K (W = 40, p = 0.6).
Figure 7.
Figure 7.. Selective activation of PV neurons in S1 generates suppression and rebound
(A) Top plot: Grand average (mean ± s.d.) PSTHs for opto-tagged PV and non-PV units in S1 across recordings (12 recordings from 8 mice), aligned to the onset of the cortical photostimulation (1 mW at the fiber tip, 105 μm core diameter). Inset on the right shows the rebound segment of the same data on a magnified y-axis scale. 2nd plot: Grand average PSTHs normalized to the post peak rebound amplitude. 3rd plot: Average difference of PV minus non-PV post peak rebound-normalized PSTHs. 4th plot: Grand average PSTH for all M1 units, and for units with suppression or rebound. (B) Percentage of PV and non-PV units with significant suppression (in the time window 110 to 170 ms) compared to pre-stimulus baseline (Wilcoxon’s signed rank test, W = 27, p = 0.63). (C) Suppression as a percentage of baseline firing rate amplitude for PV and non-PV units in B (W = 12, p = 0.03). (D) Percentage of PV and non-PV units with significant rebound compared to pre-stimulus baseline (W = 61, p = 0.09). (E) Rebound amplitude for PV and non-PV units in D (W = 59, p = 0.13). (F) Rebound latency for PV and non-PV units in D (W = 10, p = 0.02). (G-K) Same as B-F but for all units recorded on the M1 probe during S1 photostimulation.
Figure 8.
Figure 8.. Partial silencing of S1 reduces M1 responses to hand stimulation
(A) 1st column: Experimental approach. Schematic depicts recording in S1 while simultaneous optogenetic stimulation of the hand of an awake head-fixed mouse (PV-Cre x Ai32). Example segment of a recording, showing raster plots of units responsive to hand stimulation (27 trials total). The schematic above the plot depicts the timing and parameters of stimulation (5 ms duration, 1 s inter-stimulus interval, 5 mW light intensity at the fiber tip, 910 μm core diameter). 2nd column: Same but for S1 opto-tagged stimulus-responsive PV units. 3rd column: Same but for S1 stimulus-responsive non-PV units. 4th column: Same but for M1 units responsive to hand stimulation. (B) Same stimulus-responsive units as in A during focal optogenetic stimulation of PV neurons in S1 (27 trials total, 1 s inter-stimulus interval, 20 ms duration, 0.25 mW light intensity at the fiber tip, 105 μm core diameter). (C) Same stimulus-responsive units as in A during simultaneous hand and focal S1 photostimulation. (D) Average (mean) PSTH across S1 units responsive to hand stimulation (1st column), parsed into PV (2nd column) and non-PV units (3rd column) along with M1 activity (4th column) aligned to the onset of the stimulation (black: hand, gray: cortex, maroon: hand+S1 stimulation) for the same example recording in (A-C). (E) Grand average (mean ± s.d.) PSTHs across recordings (4 recordings from 4 mice). Inset: Average activity (integral of FR) 15–50 ms after the stimulation onset (hand versus hand + S1 stimulation) along with the group comparison (Paired t-student test, S1 units: t3 = 4, p = 0.02; PV units: t3 = 3.2, p = 0.049; non-PV units: t3 = 4.6, p = 0.02; M1 units: t3 = 11.7, p = 0.001).
Figure 9.
Figure 9.. Schematic summary
Comparison of evoked cortical dynamics and synaptic circuit organization along the hand/forelimb-related transcortical loop through S1 and M1. The illustration combines the schematic summary from (Yamawaki et al., 2021), which depicts the major local and corticocortical excitatory synaptic circuit connections along the loop, together with our current results, which show the laminar profiles of population spiking activity across the cortical depth in each area. The profiles show the same data as in Figure 5A and Figure 5B, normalized to the maximum value in S1 plotted as heatmaps. CST: corticospinal tract, CuN: cuneate nucleus, ML: medial lemniscus, MN: motor neurons, TC: thalamocortical axons, VPL: ventral posterolateral nucleus of the thalamus. Adapted with permission (CC BY 4.0) from Yamawaki et al. (2021), Figure 7.

Similar articles

References

    1. Ahissar E, Sosnik R, Haidarliu S (2000) Transformation from temporal to rate coding in a somatosensory thalamocortical pathway. Nature 406:302–306. - PubMed
    1. Alonso I, Scheer I, Palacio-Manzano M, Frezel-Jacob N, Philippides A, Prsa M (2023) Peripersonal encoding of forelimb proprioception in the mouse somatosensory cortex. Nature communications 14:1866. 10.1038/s41467-023-37575-w. - DOI - PMC - PubMed
    1. Barrett JM, Martin ME, Shepherd GMG (2022) Manipulation-specific cortical activity as mice handle food. Current Biology 32:4842–4853. 10.1016/j.cub.2022.09.045. - DOI - PMC - PubMed
    1. Barrett JM, Martin ME, Gao M, Druzinsky RE, Miri A, Shepherd GMG (2024) Hand-jaw coordination as mice handle food is organized around intrinsic structure-function relationships. Journal of Neuroscience 44:e0856242024. 10.1523/JNEUROSCI.0856-24.2024. - DOI - PMC - PubMed
    1. Benjamini Y, Hochberg Y (1995) Controlling the False Discovery Rate: A Practical and Powerful Approach to Multiple Testing. Journal of the Royal Statistical Society Series B (Methodological) 57:289–300.

Publication types

LinkOut - more resources