[Preprint]. 2024 Dec 2:2024.12.02.626482.
doi: 10.1101/2024.12.02.626482.

Retromer Opposes Opioid-Induced Downregulation of the Mu Opioid Receptor

Affiliations

Retromer Opposes Opioid-Induced Downregulation of the Mu Opioid Receptor

Aleksandra Dagunts et al. bioRxiv. .

Abstract

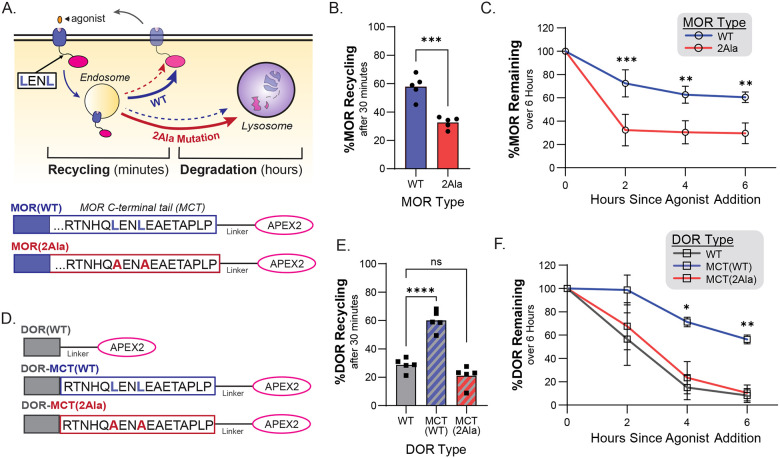
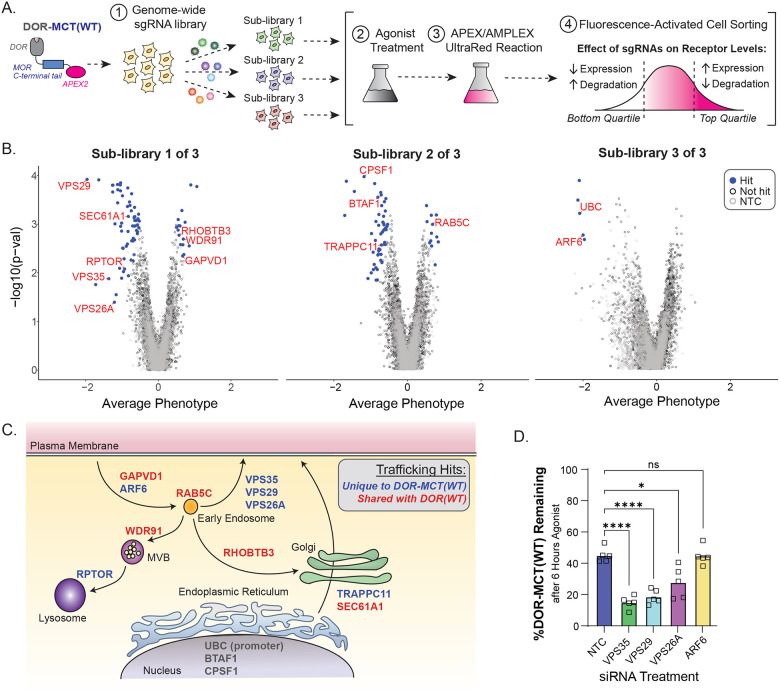
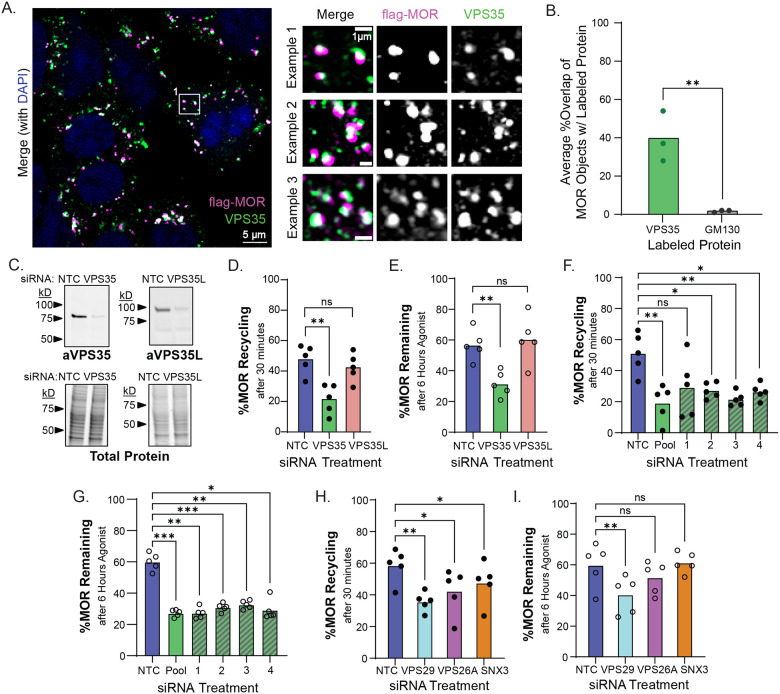
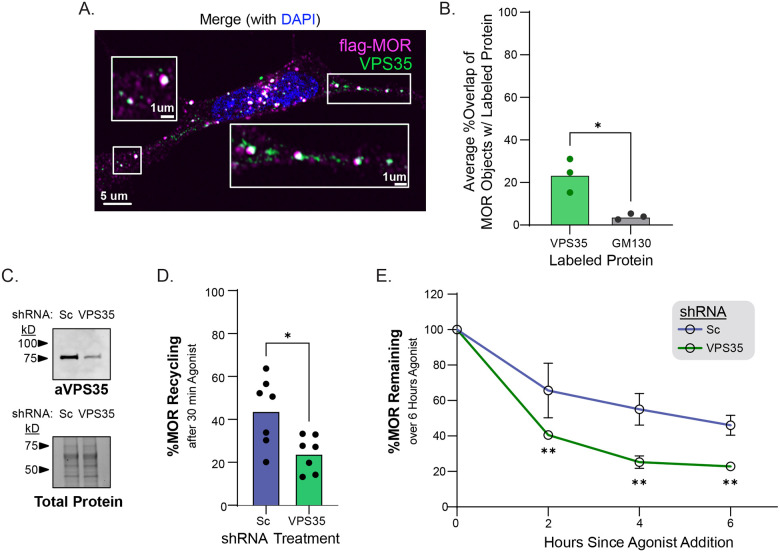
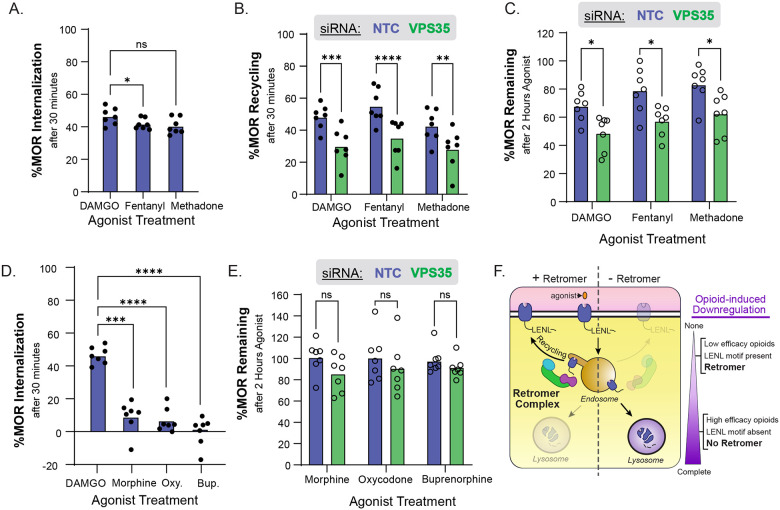
The mu opioid receptor (MOR) is protected from opioid-induced trafficking to lysosomes and proteolytic downregulation by its ability to access the endosomal recycling pathway through its C-terminal recycling motif, LENL. MOR sorting towards the lysosome results in downregulation of opioid signaling while recycling of MOR to the plasma membrane preserves signaling function. However, the mechanisms by which LENL promotes MOR recycling are unknown, and this sequence does not match any known consensus recycling motif. Here we took a functional genomics approach with a comparative genome-wide screen design to identify genes which control opioid receptor expression and downregulation. We identified 146 hits including all three subunits of the endosomal Retromer complex. We show that the LENL motif in MOR is a novel Retromer recycling motif and that LENL is a necessary, sufficient, and conserved mechanism to give MOR access to the Retromer recycling pathway and protect MOR from agonist-induced downregulation to multiple clinically relevant opioids including fentanyl and methadone.


Figures

Figure 1.
Figure 1.. The GPCR-APEX2/AUR downregulation assay captures changes in receptor recycling.
A. Construct design of APEX-tagged MOR(WT) and MOR(2Ala) and schematic depicting their expected cellular trafficking over time, including major (solid) and minor (dotted) pathways. B. Percent recycling of internalized receptors following 30 minutes of treatment with 10μM DAMGO followed by 30 minutes of treatment with 10μM naloxone measured by surface receptor staining (n=5, two-tailed paired t-test, p=0.0004). C. Percent receptor remaining following treatment with 10μM DAMGO for 0, 2, 4, or 6 hours normalized to no agonist treatment, measured with the GPCR-APEX2/AUR assay (n=3, 1way repeated measures ANOVA with Sidak’s multiple comparisons correction, p=0.0199 for receptor type effects, p<0.0001 for time effects, p=0.0008, 0.0025, and 0.0031 for WT vs 2A at the 2, 4, and 6 hour timepoints respectively). Error bars denotes S.D. D. Construct design of APEX-tagged DOR(WT), DOR-MCT(WT), and DOR-MCT(2Ala). E. Percent recycling of internalized receptors following 30 minutes of treatment with 10μM DADLE followed by 30 minutes of treatment with 10μM naloxone measured by surface receptor staining (n=5, repeated measures ANOVA with Dunnett’s multiple comparisons correction, p<0.0001 for WT vs. MCT(WT), p=0.1863 for WT vs. MCT(2Ala)). F. Percent receptor remaining following treatment with 10μM DADLE for 0, 2, 4, or 6 hours normalized to no agonist treatment, measured with the GPCR-APEX2/AUR assay (n=3, 2way repeated measures ANOVA with Dunnett’s multiple comparisons correction, p=0.0120 for receptor type effects, p=0.0043 for time effects, p=0.2470, 0.0160, and 0.0011 for WT vs. MCT(WT) at 2, 4, and 6 hours respectively, and p=0.5847, 0.3695, and 0.6600 for WT vs. MCT(2Ala) at 2, 4, and 6 hours respectively. Error bars denote S.D.
Figure 2.
Figure 2.. Retromer acts through the LENL recycling motif to oppose lysosomal receptor degradation.
A. Screen design schematic. B. Volcano plots of relative gene enrichment in cells sorted into bottom and top fluorescence quartiles following the AMPLEX reaction divided by sublibrary. Relative sgRNA enrichment between population was analyzed with a Mann-Whitney U-test from n=1 independent experiment. sgRNAs with a false discovery rate of <0.05 are denoted as hits (blue circles), non-targeting control sgRNAs are depicted as open circles, and all other genes are depicted as gray circles. Select hits involved in receptor expression and trafficking are annotated in red. C. Cartoon showing proposed location of action for hits involved in receptor expression and trafficking. Hits that were also found in our previous DOR screen are depicted in red, while hits that were unique to DOR-MCT(WT) are depicted in blue. D. Percent DOR-MCT(WT) remaining following siRNA knock-down of select hits in cells treated with 6 hours of 10uM DADLE followed by the AMPLEX assay, normalized to no agonist treatment (n=5, 1way repeated measures ANOVA with Dunnett’s multiple comparisons correction, p<0.0001 for NTC vs. VPS35, p<0.0001 for NTC vs. VPS29, p=0.0112 for NTC vs. VPS26A, and p>0.999 for NTC vs. ARF6).
Figure 3.
Figure 3.. The Retromer complex is required for MOR recycling and resistance to downregulation.
A. Confocal images of HEK293 cells stably expressing MOR(WT) and treated with 10μM DAMGO, fixed and stained for anti-FLAG (magenta) and anti-VPS35 (green). Representative images shown, n=3. B. Average percent overlap of all MOR objects with either VPS35 or GM130 (n=3, unpaired two-tailed t-test, p=0.0076). C. Western blot for VPS35 and VPS35L and total protein from HEK293 lysates following treatment with NTC, VPS35, or VPS35L siRNA treatment. Representative blot shown, n=3. D. Percent MOR(WT) recycling measured by surface labeling of receptors following treatment with 30 minutes 10μM DAMGO to induce internalization and 30 minutes 10μM naloxone to allow for recycling in cells treated with NTC, VPS35, or VPS35L siRNA (n=5, 1 way repeated measures ANOVA with Dunnett’s multiple comparisons, p=0.0034 for NTC vs VPS35, p=0.3332 for NTC vs. VPS35L). E. Percent MOR(WT) remaining following siRNA knock-down of VPS35 or VPS35L and treatment with 6 hours of 10μM DAMGO followed by the AMPLEX/AUR reaction, normalized to no agonist treatment (n=5, 1 way repeated measures ANOVA with Dunnett’s multiple comparisons, p=0.0061 for NTC vs VPS35, p=0.7862 for NTC vs. VPS35L). F. Same as D, but following siRNA knock-down of VPS35 with 4 individual siRNAs, or a pool of all four siRNAs (n=5, 1 way repeated measures ANOVA with Dunnett’s multiple comparisons, p=0.0061, 0.1162, 0.0148, 0.0081, 0.0338 for NTC vs. Pool, 1, 2, 3, and 4 respectively). G. Same as E, but following siRNA knock-down of VPS35 with 4 individual siRNAs or a pool of all four siRNAs (n=5, 1 way repeated measures ANOVA with Dunnett’s multiple comparisons, p=0.0002, 0.0023, 0.0007, 0.0026, 0.0114 for NTC vs. Pool, 1, 2, 3, and 4 respectively). H. Same as D, but after treatment of cells with pooled siRNA against VPS29, VPS26A, or SNX3 (n=5, 1 way repeated measures ANOVA with Dunnett’s multiple comparisons, p=0.0070, 0.0107, and 0.0183 for NTC vs. VPS29, VPS26A, and SNX3 respectively). I. Same as E, but after treatment of cells with pooled siRNA against VPS29, VPS26A, or SNX3 (n=5, 1 way repeated measures ANOVA with Dunnett’s multiple comparisons, p=0.0024, 0.0549, and 0.9820 for NTC vs. VPS29, VPS26A, and SNX3 respectively).
Figure 4.
Figure 4.. Retromer’s role in MOR recycling is conserved across cell lines.
A. Confocal images of SH-SY5Y cells stably expressing MOR(WT) and treated with 10μM DAMGO, labeled for anti-FLAG (magenta) and anti-VPS35 (green). Representative image, n=3. B. Average percent overlap of all MOR objects with either VPS35 or GM130 (n=3, unpaired two-tailed t-test, p=0.0076). C. Western blot for VPS35 and total protein from HEK293 lysates following transduction with either Scramble shRNA or VPS35 shRNA. Representative blot, n=3. D. Percent MOR recycling measured by surface labeling of receptors following treatment with 30 minutes 10μM DAMGO to induce internalization and 30 minutes 10μM naloxone to allow for recycling in cells transduced with Sc or VPS35 shRNA. (n=7, paired t-test, p=0.0205 for Sc vs. VPS35). E. Percent MOR(WT) remaining following transduction with Sc or VPS35 shRNA and treatment with 0, 2, 4, or 6 hours of 10μM DAMGO followed by the APEX/AUR reaction and normalized to no agonist treatment (n=3, 2 way repeated measures ANOVA with Dunnett’s multiple comparisons, p<0.0001 for time effects, p=0.0368 for shRNA effects, p=0.0054, 0.0022, 0.0081 for Sc vs. VPS35 at 2, 4, and 6 hours respectively). Error bars denote S.D.
Figure 5.
Figure 5.. Retromer-dependent trafficking of MOR is contingent on agonist efficacy.
A. Percent internalization of MOR(WT) in HEK293 cells after 30 minutes of 10μM agonist treatment measured with surface receptor labeling (n=7, repeated measures 1way ANOVA with Dunnett’s multiple comparisons correction, p=0.0375 for agonist effects, p=0.0163 and 0.0709 for DAMGO vs. fentanyl and methadone respectively). B. Percent recycling of internalized receptors following 30 minutes of 10uM agonist treatment and 30 minutes of 10μM naloxone treatment measured by surface receptor labeling (n=7, repeated measures 2way ANOVA with Sidak’s multiple comparisons correction, p=0.1866 for agonist effect, p<0.0001 for siRNA effect, p=0.0002, <0.0001, 0.0021 for NTC vs VPS35 for DAMGO, fentanyl, and methadone respectively). C. Percent MOR(WT) remaining after two hours of stimulation with 10μM full agonist measured using the GPCR-APEX2/AUR assay following knockdown of VPS35 (n=7, repeated measures 2way ANOVA with Sidak’s multiple comparisons correction, p<0.0001 for agonist effect, p=0.0086 for siRNA effect, p=0.0264, 0.0382 and 0.0411 for NTC vs VPS35 for DAMGO, fentanyl, and methadone respectively). D. Same as A but including partial agonists (n=7, repeated measures 1way ANOVA with Dunnett’s multiple comparisons correction, p<0.0001 for agonist effects, p=0.0002, <0.0001, and <0.0001 for DAMGO vs. morphine, oxycodone (Oxy.), and buprenorphine (Bup.) respectively). E. Same as C, but using partial agonists (n=7, repeated measures 2way ANOVA with Sidak’s multiple comparisons correction, p<0.8520 for agonist effect, p<0.1998 for siRNA effect, p=0.2655, 0.8305, 0.5681 for NTC vs VPS35 for morphine, oxycodone, and buprenorphine respectively). F. Working model describing how Retromer acts through the LENL recycling motif to protect MOR from agonist-induced downregulation promoted by high efficacy opioids.

References

    1. Adhikary S., Koita O., Lebowitz J.J., Birdsong W.T., and Williams J.T.. 2022. Agonist-specific regulation of G protein-coupled receptors after chronic opioid treatment. Mol. Pharmacol. 101:300–308. - PMC - PubMed
    1. Alvarez V.A., Arttamangkul S., Dang V., Salem A., Whistler J.L., von Zastrow M., Grandy D.K., and Williams J.T.. 2002. M-opioid receptors: Ligand-dependent activation of potassium conductance, desensitization, and internalization. J. Neurosci. 22:5769–5776. - PMC - PubMed
    1. Arden J.R., Segredo V., Wang Z., Lameh J., and Sadée W.. 1995. Phosphorylation and agonist-specific intracellular trafficking of an epitope-tagged mu-opioid receptor expressed in HEK 293 cells. J. Neurochem. 65:1636–1645. - PubMed
    1. Bahouth S.W., and Nooh M.M.. 2017. Barcoding of GPCR trafficking and signaling through the various trafficking roadmaps by compartmentalized signaling networks. Cell. Signal. 36:42–55. - PMC - PubMed
    1. Bailey C.P., Kelly E., and Henderson G.. 2004. Protein kinase C activation enhances morphine-induced rapid desensitization of mu-opioid receptors in mature rat locus ceruleus neurons. Mol. Pharmacol. 66:1592–1598. - PubMed

Publication types