[Preprint]. 2024 Dec 4:2024.12.03.626669.
doi: 10.1101/2024.12.03.626669.

Induced B-Cell Receptor Diversity Predicts PD-1 Blockade Immunotherapy Response

Affiliations

Induced B-Cell Receptor Diversity Predicts PD-1 Blockade Immunotherapy Response

Yonglu Che et al. bioRxiv. .

Update in

Abstract

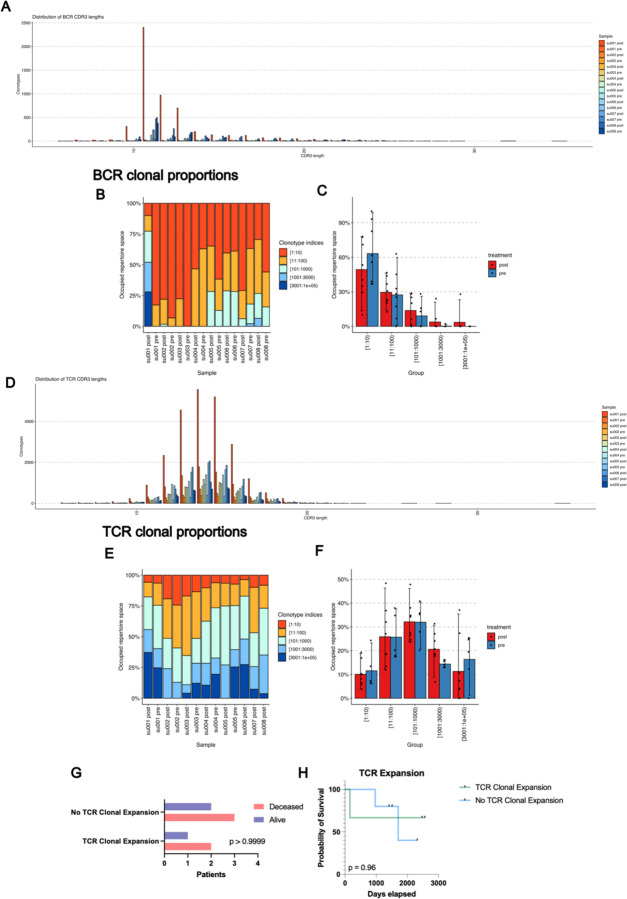
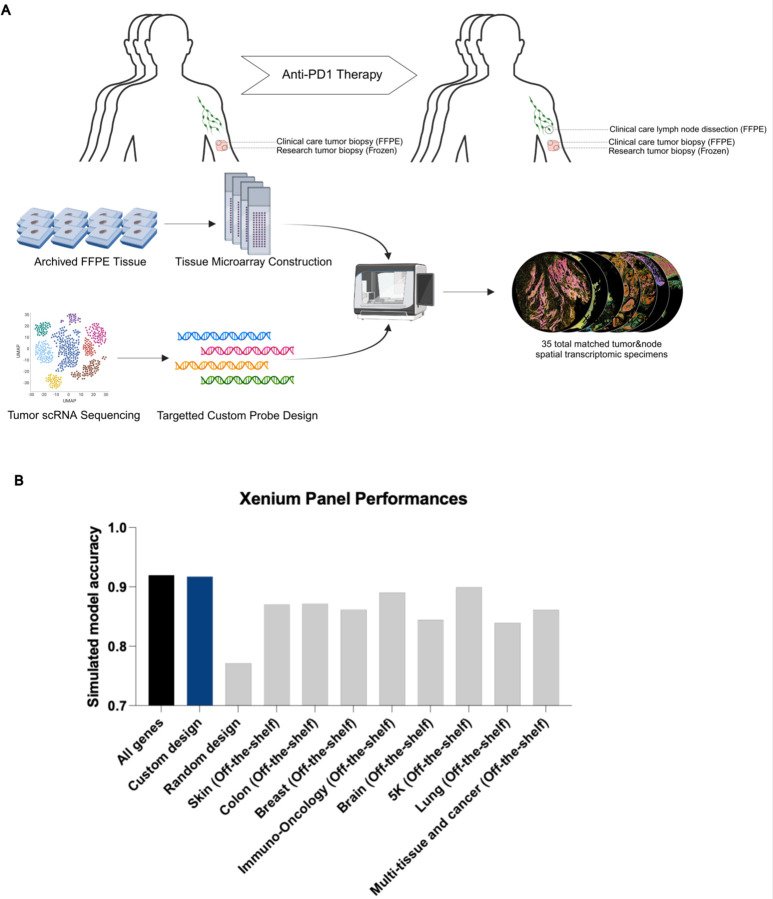
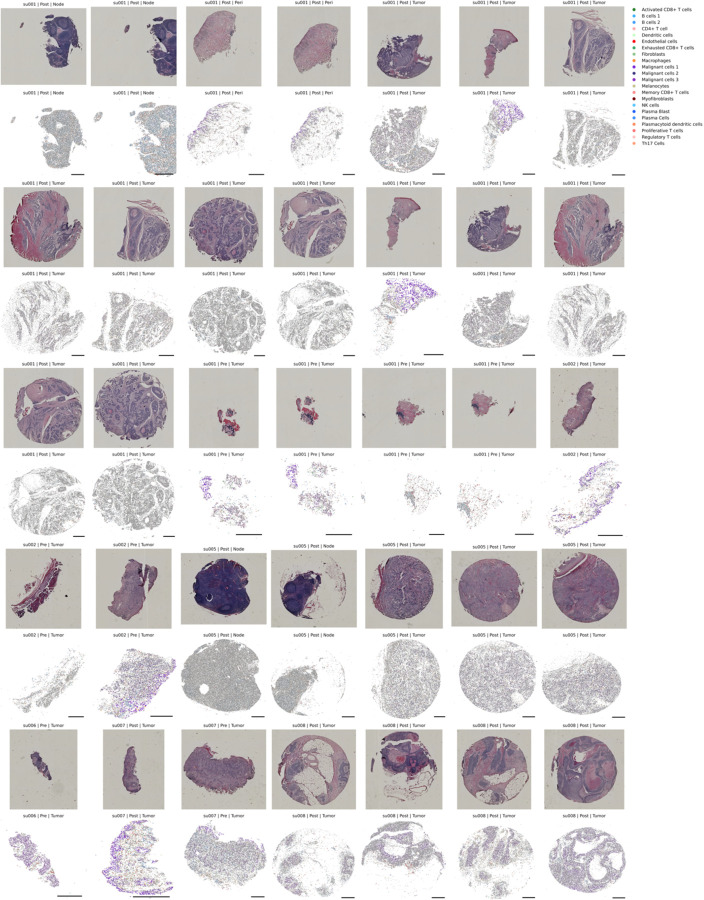
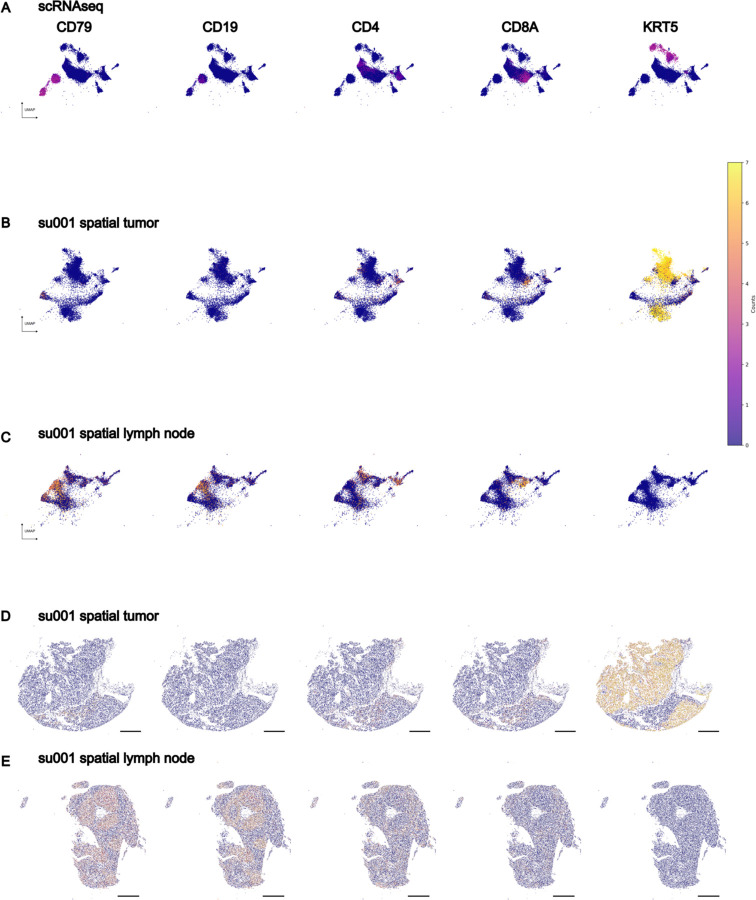
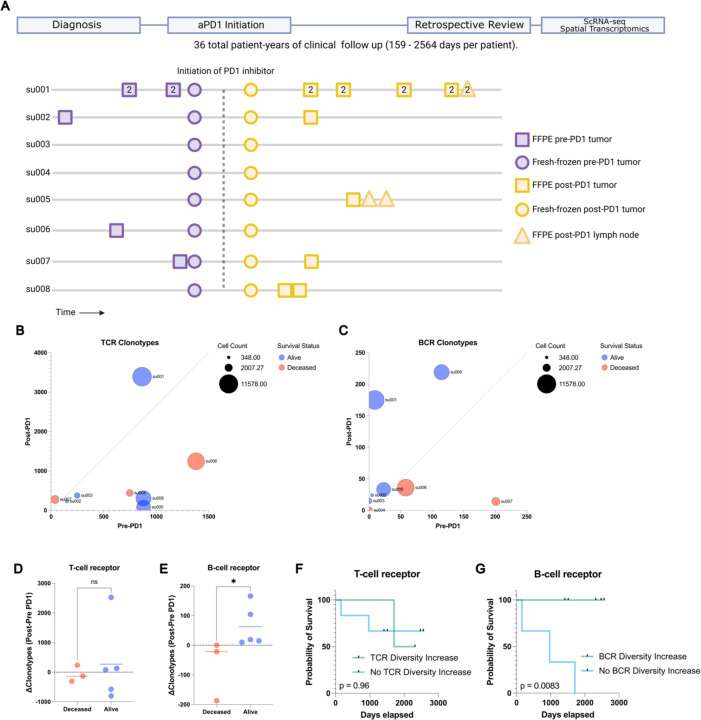
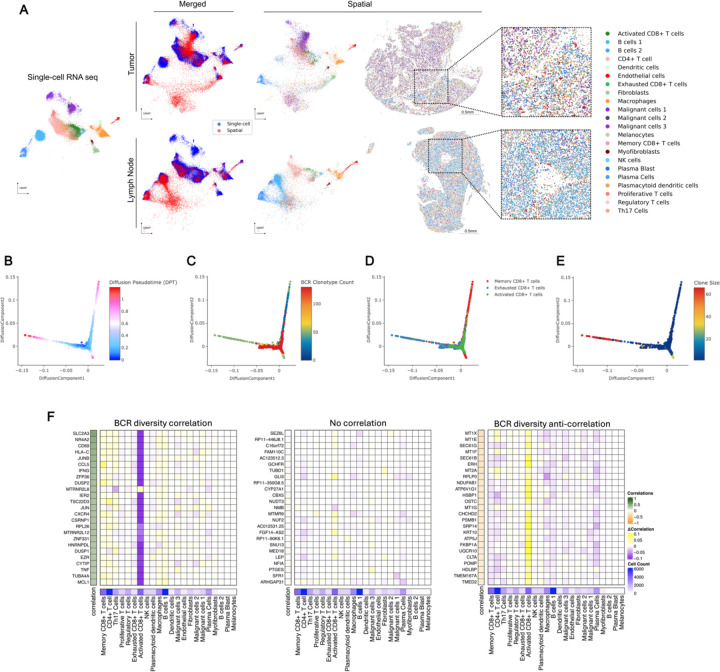
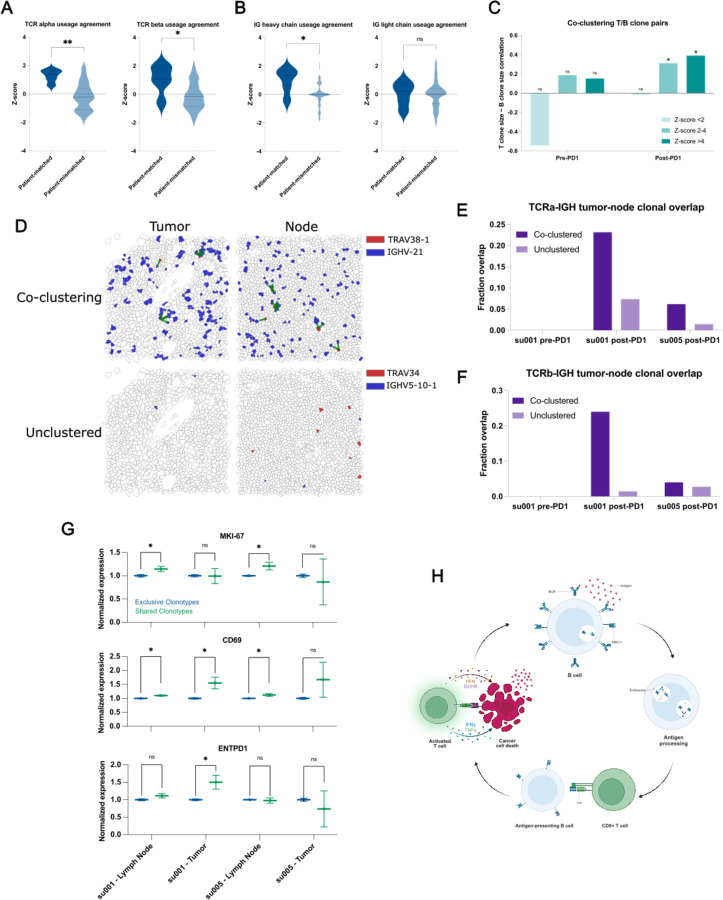
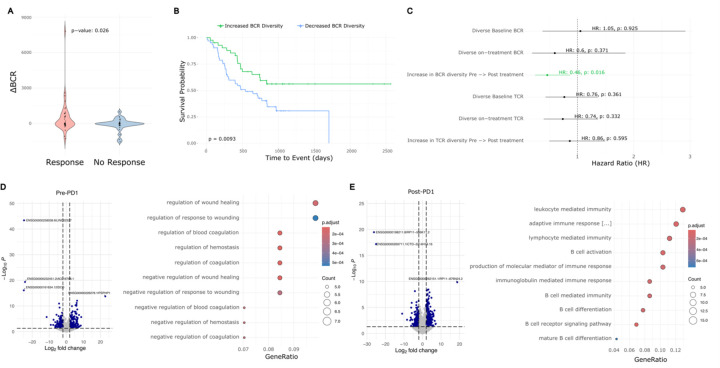
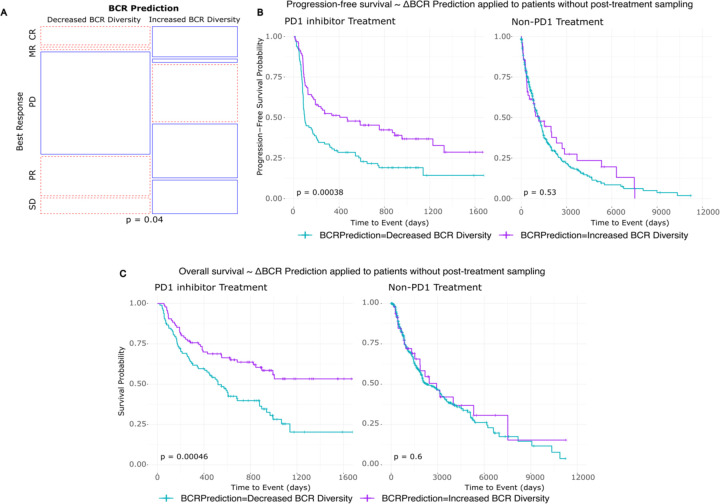
Immune checkpoint inhibitors such as anti-PD-1 antibodies (aPD1) can be effective in treating advanced cancers. However, many patients do not respond and the mechanisms underlying these differences remain incompletely understood. In this study, we profile a cohort of patients with locally-advanced or metastatic basal cell carcinoma undergoing aPD-1 therapy using single-cell RNA sequencing, high-definition spatial transcriptomics in tumors and draining lymph nodes, and spatial immunoreceptor profiling, with long-term clinical follow-up. We find that successful responses to PD-1 inhibition are characterized by an induction of B-cell receptor (BCR) clonal diversity after treatment initiation. These induced BCR clones spatially co-localize with T-cell clones, facilitate their activation, and traffic alongside them between tumor and draining lymph nodes to enhance tumor clearance. Furthermore, we validated aPD1-induced BCR diversity as a predictor of clinical response in a larger cohort of glioblastoma, melanoma, and head and neck squamous cell carcinoma patients, suggesting that this is a generalizable predictor of treatment response across many types of cancers. We discover that pre-treatment tumors harbor a characteristic gene expression signature that portends a higher probability of inducing BCR clonal diversity after aPD-1 therapy, and we develop a machine learning model that predicts PD-1-induced BCR clonal diversity from baseline tumor RNA sequencing. These findings underscore a dynamic role of B cell diversity during immunotherapy, highlighting its importance as a prognostic marker and a potential target for intervention in non-responders.


Figures

Extended Data Figure 1:
Extended Data Figure 1:. BCR and TCR Clonotype Characteristics
A) Distribution of BCR CDR3 lengths by sample. B) Clonal proportions of BCR clonotypes present in BCC patient specimens expressed as a percent of total. C) Occupied repertoire space of BCR clonotypes present in BCC patient specimens stratified by sample pre vs. post PD1 inhibitor. D) Distribution of TCR CDR3 lengths by sample E) Clonal proportions of TCR clonotypes present in BCC patient specimens expressed as a percent of total. F) Occupied repertoire space of TCR clonotypes present in BCC patient specimens stratified by sample pre vs. post PD1 inhibitor. G) Contingency table of patient status at last clinical follow up vs. the presence of significant clonal expansion in any T cell subset previously described in Yost et al. 2019. H) Kaplan-Meier curve of overall survival for our BCC patient cohort stratified by presence or absence of T cell subset expansion.
Extended Data Figure 2:
Extended Data Figure 2:. Xenium In-Situ Experimental Design and Probe Design Validation
A) Schematic diagram of Xenium in situ experimental design using archived specimens. B) Model performance of a neural net classifier trained on cell type prediction from scRNA-seq data. A theoretical maximum of model performance was established by allowing full gene expression data to be used in training (black) while all other models were restricted to the genes available in the annotated Xenium panels The custom design (blue) is the 480 gene manually curated gene panel used for our analysis, the random design is a panel of 480 randomly selected genes while all other panels are pre-designed panels offered by 10x genomics.
Extended Data Figure 3:
Extended Data Figure 3:. H&E and Xenium In-situ of Primary Patient Specimens
Patient tissue specimens sent for Xenium in situ analysis. Top panels represent H&E staining of the identical tissue section run for Xenium. Bottom panels are spatial cell boundaries (grey) colored by cell type predictions generated through the previously described nearest neighbor approach in the ENVI latent space. Scale bars are 0.5mm. Xenium cells are downsampled to 40% for visualization.
Extended Data Figure 4:
Extended Data Figure 4:. ENVI Latent Space and Spatial Representation of Example Tumor and Lymph Node
A) UMAPs of scRNA-seq cells B) Xenium tumor sample cells and C) Xenium draining lymph node cells colored by expression of select cell type markers in the shared ENVI latent embeddings. D) Spatial plots of the sample shown in B. E) Spatial plots of the sample shown in C. Scale bars are 0.5mm.
Extended Data Figure 5:
Extended Data Figure 5:. Diffusion Plots of Tumor and Immune Cell Clusters Reveals Increased Activated CD8+ T-cell representation and Decreased Tumor Burden in BCR-rich samples
A) Keratinocyte cells (identified in this study broadly as malignant cells) diffusion plot. DPT stands for diffusion pseudotime. The BCR clonotype count for each cell plotted is defined as the number of BCR clonotypes present in the tissue sample from which the plotted cell originated, representing the BCR diversity of its environment. Expression of EPCAM (BerEP4) a marker of basal cell carcinomas and progenitor keratinocytes, KRT1 an early differentiation marker, and IVL a late differentiation marker plotted per cell. B) B and plasma cells aggregated diffusion plot. MHC-I expression is defined as the mean expression of all class I MHC genes per cell. IGH expression is defined as the mean expression of all heavy chain Ig genes per cell. C) CD8+ T cells diffusion plot. Expression of CD69 and JUN, markers of TCR-induced activation plotted per cell.
Extended Data Figure 6:
Extended Data Figure 6:. CellChat Analysis of B-CeIl/T-Cell Signaling
A) Heatmap of communication probabilities in MHC-I signaling pathways between cell clusters. B) Significant communication pathways originating from cluster B cell 1 representative of B outgoing B cell signaling. C) Relative contribution of each ligand-receptor pair to MHC-I signaling strength between B cell clusters and Activated CD8+ T cells. D) Outgoing and incoming signaling strength per cell cluster for all signaling pathways (left) and MHC-I signaling pathways (right) calculated using CellchatDB. E) Pearson correlation between gene expression in CD8+ T cells vs. the BCR clonotype count in the respective tissue sample. Each point is the correlation of a single gene, and the plot it ordered from most positive correlation to most negative correlation. F) GO-Terms enriched in genes significantly correlated with BCR clonotype count in CD8+ T cells (defined as adjusted p-value <0.05).
Extended Data Figure 7:
Extended Data Figure 7:. Immune Triads Involving B cells and Activated T cells
A) Schematic and equation of spatial cell triad calculation. The Triad Occurrence is defined as the proportion of existing co-localized pairs of two cell types (Cluster A and B) that also have a proximal third cell type interaction (Cluster C). B) Fibroblast/Melanocyte/Proliferative T cell Triad Occurrence; negative control in aPD1-treated tumors. C) Malignant cell 1/Malignant cell 2/Malignant cell 3 Triad Occurrence; positive control in aPD1-treated tumors. D) Activated CD8+ T cell/CD4+ T cell/Dendritic cell Triad Occurrence in aPD1-treated tumors. E) B cell/Activated CD8+ T cell/Tfh Triad Occurrence in aPD1-treated tumors. F) B cell/Activated CD8+ T cell/Tfh Triad Occurrence in aPD1-treated draining lymph nodes.
Extended Data Figure 8:
Extended Data Figure 8:. Progression-free Survival in Glioblastoma as a Function of PD-1 inhibitor-Induced BCR Diversity
Left: Progression-free survival in glioblastoma patients who underwent resection then started on adjuvant PD1 inhibitor. Tumor collection on which BCR clonotype analysis was performed was prior to PD1 exposure (Cloughesy et al. 2019). P values reported for log rank test. Right: Progression-free survival in glioblastoma patients exposed to neoadjuvant PD1 inhibitor followed by surgical resection.
Figure 1:
Figure 1:. Long term survival of advanced BCC patients highlights prognostic role of aPD1- induced BCR clonal diversity
A) A schematic diagram of our BCC patient cohort. Top: A retrospective chart review was performed after an extended period of clinical follow up lasting up to 2564 days to allow final clinical outcomes of PD-1 blockade to manifest. Bottom: A visualization of the samples taken for our prior study (Yost et al. 2019) and this study. All patients had pre- and post-PD-1 inhibitor-treated tumor samples for scRNA-seq (circles). All availablearchived specimens in long-term storage were accessed (squares and triangles) and processed for spatial transcriptomics. Numbers within the shapes represent replicates taken from sequential sections of the sample tissue block. Y axis represents anonymized patient identifiers while the x-axis represents time (not to exact scale). B) Unique TCR and C) BCR clonotype counts detected per patient in their pre-PD-1 inhibitor tumor (X-axis) and post-PD-1 inhibitor treated tumor (Y axis) as calculated by TRUST4 run on 5' single cell RNA sequencing as described (Methods). Point sizes represent the total cell count obtained from tumors of each patient. D) Change in unique TCR and E) BCR clonotype counts between pre-PD-1 inhibitor and post-PD-1 inhibitor tumors for each patient (Y-axis), stratified by clinical status at last available follow up. F) Kaplan-Meier curve of overall survival for our BCC patient cohort stratified by the change in pre-to-post PD-1 inhibitor TCR and G) BCR clonotype count. P-values calculated using the log-rank test.
Figure 2:
Figure 2:. Spatial transcriptomics merged with scRNA-seq enables exploration of the BCR diversity-impacted tumor microenvironment
A) Representative tissue samples obtained from Xenium in-situ for patient su001 for tumor (top) and regional lymph node (bottom). Cells from Xenium were merged onto the same latent space (middle) as cells from our prior scRNA-seq (left and middle) using the computational tool ENVI (methods). Proposed cell types for Xenium cells were determined using a nearest-neighbor approach in the high-dimensional ENVI latent space. Xenium tissues are downsampled to 40% of total cells for visualization purposes. B) Diffusion plots of CD8+ T cell populations from scRNA-seq highlighting pseudotime, C) total unique BCR clonotype count present in the originating tumor of each T cell, D) annotated subtype of each T cell (bottom), E) and size of the originating T cell clonotype. F) Regression analysis of cell-type contributions to gene expression correlations to BCR-clonotype counts. Left heatmap represents the correlation across scRNA-seq tissue specimens between the annotated gene and the unique BCR clonotype count in that tissue specimen. The 25 most correlated genes (left), 25 most anti-correlated genes (right), and 25 random genes (middle) are shown. The middle heatmap grid represents the change in correlation strength of each gene (row) when a particular cluster (column) is blinded to the correlation calculation. The heatmap on the bottom row represents the total cell counts assigned to each cluster to verify that effect sizes are not solely influenced by cluster size.
Figure 3:
Figure 3:. Clonally diverse B cells co-cluster with paired T cell clones with an activated phenotype
A) Correlations of V-gene usage between those detected using TRUST4 analysis of scRNA-seq vs. those detected in Xenium in situ for TCRs. “Patient-matched” refers to correlations between Xenium samples and scRNA-seq samples originating from the same patient at the same clinical time point where “patient-mismatched” refers to correlations between different patients or different clinical timepoints. B) Correlations of V-gene usage between scRNA-seq vs. Xenium for IG-genes. C) Correlation of T cell “pseudo-clone” sizes with paired B cell “pseudo-clone” sizes as a function of PD-1 inhibitor exposure of the originating tumor tissue and degree of spatial co-clustering between those T and B “pseudo-clones”. D) Representative images of tumor and lymph node samples from patient su001 highlighting a pair of co-clustered “pseudo-clones” and a pair of unclustered “pseudo-clones”. Green lines represent T/B cell clones within 20μm of each other. E) Fraction of TCRα “pseudo-clone” pairs present in the draining lymph node samples that are also present in the respective tumor sample of that patient. All lymph node samples were collected post-PD-1 inhibitor treatment. Patient su005 had no remaining archived pre-PD-1 inhibitor tumor to be analyzed. F) Fraction of TCRβ pairs present in both draining lymph nodes and tumors. G) Normalized gene expression by patient and tissue compartment for T cell clones that are present in both lymph nodes and tumor (shared) vs. those present in a single compartment (exclusive). H) Schematic diagram of a proposed mechanism of antigen cross-presentation by B cells to CD8+ T cells leading to a cycle of tumor clearance and generation of additional tumor neo-antigens.
Figure 4:
Figure 4:. Meta-analysis of BCC, glioblastoma, melanoma, and HNSCC reveals a general prognostic role for aPD1-induced BCR diversity
A) ∆BCR clonotype count from pre-PD1 inhibitor to post-PD1-inhibitor of patients with progressed tumors vs. non-progressed tumors. B) Kaplan-Meier curve of overall survival for aggregate cancer patients stratified by induced BCR expansion from PD-1 inhibitor. C) Hazard ratios of overall survival for aggregate cancer patients by BCR or TCR clonotype. An increased clonotype diversity is defined by a greater number of clonotypes detected in post-PD1 treated tumors compared to prior. Diversity in the case of static measurements at baseline or on-treatment are defined as an above-median BCR or TCR clonotype count. D) Left: Volcano plot of differentially expressed genes in pre-treatment tumors that undergo induced BCR expansion vs. those without. Right: GO-terms enriched in pre-treatment tumors that undergo induced BCR expansion vs. those without. E) Left: Volcano plot of differentially expressed genes in post-treatment tumors that undergo induced BCR expansion vs. those without. Right: GO-terms enriched in post-treatment tumors that undergo induced BCR expansion vs. those without
Figure 5:
Figure 5:. Pre-treatment tumor RNA sequencing can be leveraged to model aPD1-induced BCR diversity and clinical outcomes.
A) Prediction model applied to a new melanoma patient cohort. Mosaic plot of clinical response by RECIST stratified by model prediction of induced BCR clonotype expansion. BR: Best response, CR: Complete response, MR: Marginal response, PD: Progressed disease, PR: Partial response, SD: Stable disease. B) Kaplan-Meier curve of progression-free survival stratified by model prediction of induced BCR clonotype expansion in melanoma patients treated with PD1 inhibitor (left) and other, non-PD1 therapies (right). C) Kaplan-Meier curve of overall survival stratified by model prediction of induced BCR clonotype expansion in melanoma patients treated with PD1 inhibitor (left) and other, non-PD1 therapies (right).

References

    1. Cabrita R., Lauss M., Sanna A., Donia M., Skaarup Larsen M., Mitra S., Johansson I., Phung B., Harbst K., Vallon-Christersson J., van Schoiack A., Lövgren K., Warren S., Jirström K., Olsson H., Pietras K., Ingvar C., Isaksson K., Schadendorf D., … Jönsson G. (2020). Tertiary lymphoid structures improve immunotherapy and survival in melanoma. Nature, 577(7791). 10.1038/s41586-019-1914-8 - DOI - PubMed
    1. Chaft J. E., Oezkan F., Kris M. G., Bunn P. A., Wistuba I. I., Kwiatkowski D. J., Owen D. H., Tang Y., Johnson B. E., Lee J. M., Lozanski G., Pietrzak M., Seweryn M., Byun W. Y., Schulze K., Nicholas A., Johnson A., Grindheim J., Hilz S., … Blasberg J. D. (2022). Neoadjuvant atezolizumab for resectable non-small cell lung cancer: an open-label, single-arm phase II trial. Nature Medicine, 28(10). 10.1038/s41591-022-01962-5 - DOI - PMC - PubMed
    1. Chang T.-G., Spathis A., Schäffer A. A., Gavrielatou N., Kuo F., Jia D., Mukherjee S., Sievers C., Economopoulou P., Anastasiou M., Moutafi M., Pal L. R., Vos J., Lee A. S., Lam S., Zhao K., Jiang P., Allen C. T., Foukas P., … Ruppin E. (2024). Tumor and Blood B Cell Abundance Outperforms Established Immune Checkpoint Blockade Response Prediction Signatures in Head and Neck Cancer. Annals of Oncology. 10.1016/j.annonc.2024.11.008 - DOI - PMC - PubMed
    1. Chen D. S., & Mellman I. (2017). Elements of cancer immunity and the cancer-immune set point. In Nature (Vol. 541, Issue 7637). 10.1038/nature21349 - DOI - PubMed
    1. Cloughesy T. F., Mochizuki A. Y., Orpilla J. R., Hugo W., Lee A. H., Davidson T. B., Wang A. C., Ellingson B. M., Rytlewski J. A., Sanders C. M., Kawaguchi E. S., Du L., Li G., Yong W. H., Gaffey S. C., Cohen A. L., Mellinghoff I. K., Lee E. Q., Reardon D. A., … Prins R. M. (2019). Neoadjuvant anti-PD-1 immunotherapy promotes a survival benefit with intratumoral and systemic immune responses in recurrent glioblastoma. Nature Medicine, 25(3). 10.1038/s41591-018-0337-7 - DOI - PMC - PubMed

Publication types

LinkOut - more resources