[Preprint]. 2025 Jun 14:2024.12.03.626638.
doi: 10.1101/2024.12.03.626638.

GraphVelo allows for accurate inference of multimodal velocities and molecular mechanisms for single cells

Affiliations

GraphVelo allows for accurate inference of multimodal velocities and molecular mechanisms for single cells

Yuhao Chen et al. bioRxiv. .

Update in

Abstract

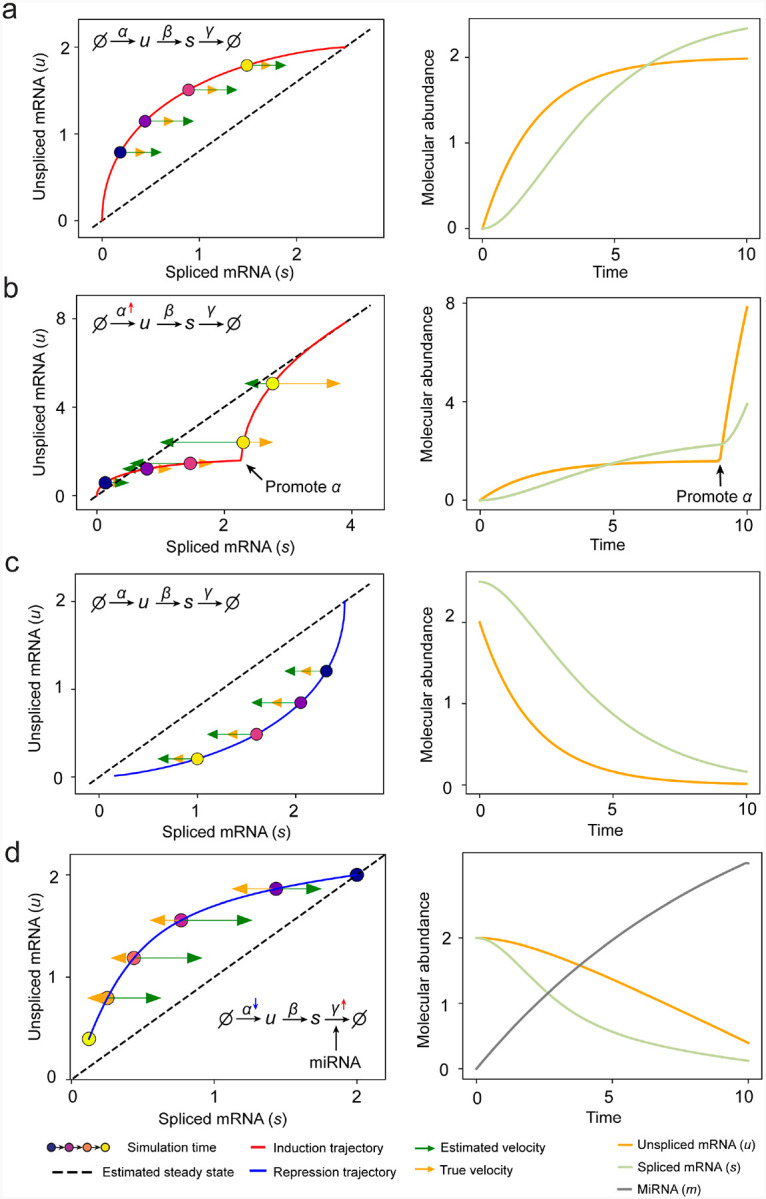
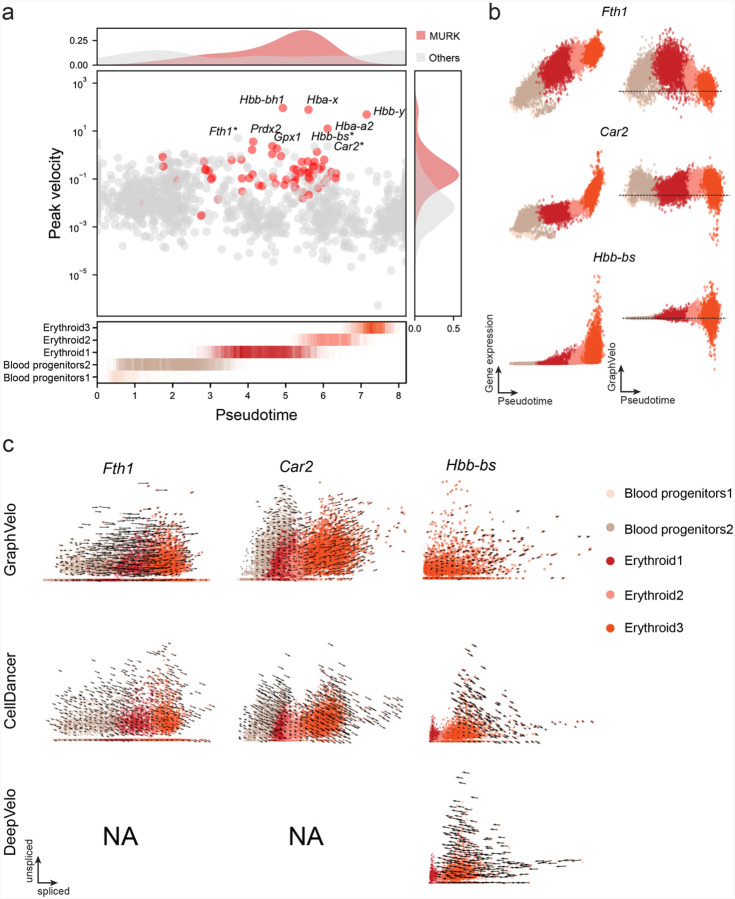
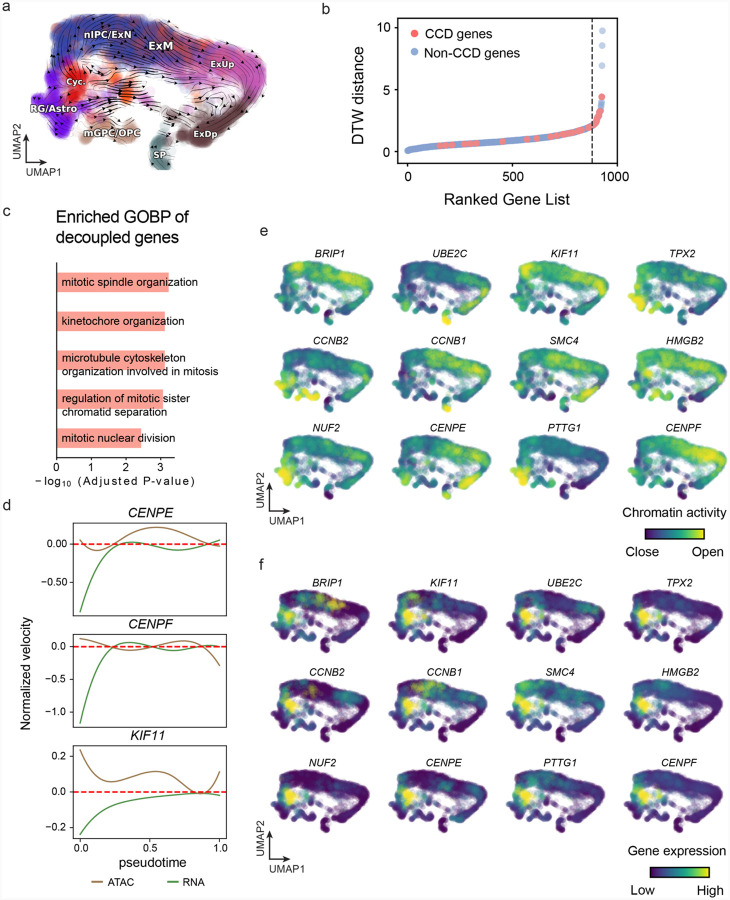
RNA velocities and generalizations emerge as powerful approaches for extracting time-resolved information from high-throughput snapshot single-cell data. Yet, several inherent limitations restrict applying the approaches to genes not suitable for RNA velocity inference due to complex transcriptional dynamics, low expression, or lacking splicing dynamics, or data of non-transcriptomic modality. Here, we present GraphVelo, a graph-based machine learning procedure that uses as input the RNA velocities inferred from existing methods and infers velocity vectors lying in the tangent space of the low-dimensional manifold formed by the single cell data. GraphVelo preserves vector magnitude and direction information during transformations across different data representations. Tests on synthetic and experimental single-cell data including viral-host interactome, multi-omics, and spatial genomics datasets demonstrate that GraphVelo, together with downstream generalized dynamo analyses, extends RNA velocities to multi-modal data and reveals quantitative nonlinear regulation relations between genes, virus and host cells, and different layers of gene regulation.


Figures

Extended Data Fig. 1.
Extended Data Fig. 1.. Refining RNA velocity from noisy simulation data or tradition splicing-based methods.
(a-c) Evaluation of on simulated scRNA-seq data under linear, cycling and bifurcating differentiation models with an increasing noise level in velocity vectors. (d) Heatmap of the correlation of cell speed calculated as the norm of velocity vector with respect to the full-dimensional RNA velocity and the norm of velocity vectors projected to PCA or UMAP space using GraphVelo, GraphVelo with cosine regularization, cosine kernel. (e) Boxplots of metric evaluations on GraphVelo correction to the original velocities estimated by scVelo, dynamo, and VeloVI. Box colors indicate the statistical test results for improvement relative to zero.
Extended Data Fig. 2.
Extended Data Fig. 2.. The visualization results of inferred cell fate transition directions in UMAP spaces.
Extended Data Fig. 3.
Extended Data Fig. 3.. Quantitative benchmarks on GraphVelo across diverse biological systems.
(a) The average CBC scores across five benchmark datasets using different RNA velocity estimation methods. (b) Pairwise comparisons before and after applying GraphVelo using the outputs of distinct RNA velocity algorithms across datasets. The Welch’s t-test is performed to demonstrate a significant improvement of applying GraphVelo against zero.
Extended Data Fig. 4.
Extended Data Fig. 4.. Benchmarking velocity consistency on FUCCI and endocrinogenesis dataset.
Extended Data Fig. 5.
Extended Data Fig. 5.. Quantitative evaluation of GraphVelo on two independent cell cycle datasets.
(a) Pairwise CBC scores between cell cycle phases (G1-S, S, G2-M, M, M-G1) using velocity vectors estimated by scVelo, dynamo, and their GraphVelo-refined outcomes. (b) Cell cycle speed comparison along FUCCI time. GraphVelo-refined velocities identify the peak region within M-G1 phase and show a better match to total UMI distribution, reflecting more accurate scaling of cell cycle dynamics. (c) Vector field reconstructed by GraphVelo on the A549 dataset, projected onto UMAP. Cells are colored by their cell cycle phases. (d) Cell cycle speed (top) and total UMI count changes (bottom) plotted along the cell cycle phase. Peaks in velocity magnitude coincide with result in FUCCI data, particularly in M-G1. (e) Polar plot of genes with peak RNA velocity, stratified by cell cycle phase, reflecting the cascade activation of phase marker genes.
Extended Data Fig. 6.
Extended Data Fig. 6.. RNA velocity inference on simulation results of splicing kinetics with constant or changed rates.
(a) Standard splicing kinetics along an induction trajectory in phase portrait and the reactions define how abundance levels of molecules change along simulation time. Right panel shows corresponding trajectories over time (same below). (b) Transcription burst along an induction trajectory in phase portrait. The transcription rate constant α was promoted at specific time point. (c) Standard splicing kinetics along a repression trajectory. (d) Rapid time-varying degradation kinetics along repression trajectory. External signal promotes synthesis of microRNA, which enhances degradation of target mRNA resulting in a microRNA - dependent varying degradation rate “constant” γ, and inhibits the target gene via a decreasing α.
Extended Data Fig. 7.
Extended Data Fig. 7.. GraphVelo extrapolation of RNA velocities of an extended list of gene set in mouse erythroid maturation dataset.
(a) Phase portrait with GraphVelo vectors, velocity estimated by scVelo, refined velocity by GraphVelo, and gene expression of mature mRNA of a selected set of genes. Cells were colored by cell type, corresponding velocity, and mature mRNA abundance, respectively, and visualized on the phase portrait and UMAP, respectively. (b) Velocities of MURK genes derived from GraphVelo and scVelo for gastrulation erythroid maturation cells projected to a predefined UMAP representation. Note that RNA velocity estimated by scVelo was in a reverse flow, possibly influenced by transcription burst events. (c) Cell speed distribution along the vector field pseudotime axis. Cells were colored by local density and red line indicates the fitted curve. (d) Receiver operating curve analyses of MURK gene prediction based on dynamo accelerations analysis using GraphVelo as input, in contrast to a random predictor. AUC, area under curve.
Extended Data Fig. 8.
Extended Data Fig. 8.. GraphVelo reveals potential MURK genes with larger peak velocity magnitude during erythroid maturation.
(a) Peak RNA velocity across pseudotime for highly variable genes. MURK genes (red) show significantly higher peak velocity magnitudes than other genes (gray), particularly in late-stage erythroid cells. Top peak velocity genes are annotated and Fth1, Car2, Hbb-bs are suspected as potential MURK genes and highlighted by star*. Density plots above and to the side illustrate the distributions of pseudotime and peak velocity, respectively. The heatmap below shows cell density along pseudotime by cell states. (b) Expression and corresponding velocities of Fth1, Car2, Hbb-bs along the vector field-based pseudotime in mouse erythroid data. (c) Phase portraits comparing velocity vectors estimated by GraphVelo, CellDancer, and DeepVelo for selected potential MURK genes. GraphVelo reveals well-directed and temporally aligned transcriptional dynamics, while alternative methods (particularly DeepVelo) fail to provide interpretable velocity fields for key genes with altered kinetics.
Extended Data Fig. 9.
Extended Data Fig. 9.. Regulatory cascades of driver TFs in mouse erythroid data.
(a) Expression and corresponding velocities of Gata2, Gata1, Klf1 along the vector field-based pseudotime in mouse erythroid data. (b) Gene expression of Gata2, Gata1, Klf1 on the UMAP space. (c) Molecular mechanisms of driver TFs underlying erythroid lineage commitment based on Jacobian analyses. (i) Gata2 activates Gata1. (ii) Repression of Gata2 by Gata1. (iii) Self-activation of Gata1. (iv) Gata1 activates Klf1. (d) In silico perturbation analyses on GraphVelo-based vector field to examine the role of Gata1 in gastrulation erythroid maturation.
Extended Data Fig. 10.
Extended Data Fig. 10.. RNA velocity estimated by scVelo and refined by GraphVelo from a hematopoiesis dataset.
(a) Velocities derived from scVelo in the hematopoiesis development and projected to a pre-defined TSNE embedding. (b) TSNE visualization of the RNA velocity estimated by scVelo of ANGPT1 and RBPMS genes. (c) Scatter plots of: i) phase portrait, ii) velocities estimated by scVelo, iii) refined velocities by GraphVelo, and iv) mature mRNA expression of transcription burst genes (e.g. CALR, KLF1 and AHSP). Cells were colored by cell type, corresponding velocity, and mature mRNA abundance, respectively, and visualized on the phase portrait and TSNE, respectively. (d) Cell-specific transcription rate constant α and degradation rate constant γ of rapid degradation genes ANGPT1 and RBPMS visualized on the TSNE space, which is consistent with simulation result in Extended Data Fig. 3d.
Extended Data Fig. 11.
Extended Data Fig. 11.. GraphVelo infers quantitative transcription rate from mouse coronal hemibrain spatial data.
(a) The spatial location of cells colored with annotation in the original research. (b) UMAP visualization of the RNA velocity estimated by GraphVelo. (c) The transcription speed inferred by GraphVelo (left panel) and dynamo (right panel). (d) Violin plot of cell-wise transcription speed grouped by cell state. (e) Spatial distribution of mature mRNA expression, velocities estimated by dynamo, and refined velocities by GraphVelo of spatial variable genes. Cells were colored by mature mRNA abundance and corresponding velocity, respectively, and visualized on spatial location.
Extended Data Fig. 12.
Extended Data Fig. 12.. Dynamic patterns of gene trajectories during HCMV infection.
(a) Gene expression of selected viral factors on the UMAP space. (b) Corresponding velocities inferred by GraphVelo for viral factors in (a). (c) Viral RNA velocities derived from GraphVelo for infected cells, projected to the UMAP representation only using viral genes. (d) Receiver operating curve (ROC) analyses of MacK scores when using all detected viral genes as the gold standard. (e) Viral infection speed versus viral load. Cells were colored by the percentage of viral RNA. (f) GO enrichment analyses of top host genes correlated with infection speed. (g) Shifts in cell proportions across different cell cycle phases along the viral phase trajectory. Cells were divided into bins according to viral RNA percentage. The result indicates a decreasing S phase population corresponding to infection-driven transcriptional alterations of the cell cycle.
Extended Data Fig. 13.
Extended Data Fig. 13.. GraphVelo infers multiple terminals driven by viral-host interactions.
(a) UMAP coordinates computed from all cell populations in the original study (left) and from the infected subpopulation alone (right). Cells belonging to cluster M are highlighted in purple. (b) Proportion of cluster M within all infected cell population. (c) Velocities derived from dynamo (left) and GraphVelo (right) in the infected cells and projected to UMAP embedding. Cells are colored by viral load. (d) Topological analyses of GraphVelo vector field identified initial position with low viral RNA load, saddle point with high viral load (as shown in panel c) and attractors residing in terminal states with high apoptosis activity. (e) Terminal states identified by CellRank using GraphVelo-corrected RNA velocity. (f) Fate probabilities toward the productive terminal state (left) and top 20 lineage-correlated genes identified (right) based on GraphVelo-based CellRank analysis. (g) GO enrichment analyses of top lineage-driver genes along two distinct cell death trajectories.
Extended Data Fig. 14.
Extended Data Fig. 14.. GraphVelo estimation of modality-consistent vector field based on multi-omics velocities.
(a) Velocity field projected to the pre-defined UMAP representation with different methods or gene sets: i) scVelo RNA velocity based on all velocity genes; ii) scVelo RNA velocity based on confident velocity genes filterred by dynamo criteria; iii) MultiVelo RNA velocity based on all velocity genes; iv) CellRank pseudotime kernel based on Palantir pseudotime. (b) Terminal states identified by CellRank using different representation and corresponding velocity: i) GraphVelo-corrected RNA velocity; ii) GraphVelo-computed chromatin velocity; iii) MultiVelo-computed RNA velocity; iv) MultiVelo-computed chromatin velocity; v) scVelo-computed RNA velocity; vi) Palantir-based pseudotime kernel.
Extended Data Fig. 15.
Extended Data Fig. 15.. Reconstructed lineage commitment during mouse hair follicle differentiation using GraphVelo velocities.
(a) Lineage commitment probablity of each terminal cell type on the UMAP vector field. (b-d) Gene expression distribution of markers for cuticle/cortex, medulla and IRS lineages on the UMAP vector field.
Extended Data Fig. 16.
Extended Data Fig. 16.. Novel root identified with multi-omic vector field from GraphVelo velocities.
(a) Dcn, Mt2 expression dynamics during anagen hair follicle keratinocytes. (b) Regions identified by topological analysis. Insert are ummarized cell-state transition vectors calculated by GraphVelo and MultiVelo along the path from the novel root to IRS and projected onto the UMAP representation. (c) Predicted developmental LAPs from expected root or novel root to to each of the terminal cell types in the UMAP embedding. Color of the node along the paths indicates the LAP transition time. (d) TF expression profiles along the LAP from novel root to IRS. Shh decays, alongside the induction of the Runx1 gene.
Extended Data Fig. 17.
Extended Data Fig. 17.. Genomic patterns of decoupled CCD genes.
(a) Chromatin activity of decoupled CCD genes. (b) Gene expression of decoupled CCD genes.
Extended Data Fig. 18.
Extended Data Fig. 18.. GraphVelo inferrence on epigenome and transcriptome decoupling dynamics in fetal human brain.
(a) GraphVelo velocity field colored by cell macrostates. (b) DTW distance between RNA velocity and chromatin velocity of individual genes as a measure of the coupling/decoupling status. CCD genes were colored in red. The dotted line indicates the elbow point, with the decoupled genes on its right. (c) GO enrichment of decoupled genes in (c). (d) Line plot of nomarlized RNA and chromatin velocity along dynamo vector field pseudotime for genes predicted by GraphVelo to have notable decoupling patterns. Chromatin velocity trends were colored in brown and RNA velocity trends were colored in green. (e) Chromatin activity of decoupled CCD genes. (f) Gene expression of decoupled CCD genes.
Extended Data Fig. 19.
Extended Data Fig. 19.. GraphVelo prediction on the regulatory mechanisms of Lef1-Hoxc13-Wnt3 circuit during mouse skin development.
(a) Distributions of Lef1 expression, Hoxc13 expression, Wnt3 chromatin openess/accessibility and Wnt3 expression, respectively, on the projected UMAP vector field. (b) Velocities of Lef1 RNA, Hoxc13 RNA, Wnt3 chromatin and Wnt3 RNA inferred by GraphVelo, visualized on the projected UMAP vector field. (c) Velocities of Lef1 RNA, Hoxc13 RNA, Wnt3 chromatin and Wnt3 RNA inferred by MultiVelo, visualized on the projected UMAP vector field. (d) Expression of Hoxc13 gene versus Lef1 expression. Lef1 expression primes the activation of Hoxc13. (e) Cell-wise Jacobian analyses of Lef1-Hoxc13 activation cascade. (f) Jacobian analyses of regulatory interactions between potential PTF Hoxc13 and i) Wnt3 chromatin accessibility or ii) transcription.. (g) Jacobian analyses of regulatory interactions between PTF Lef1 and i) Wnt3 chromatin accessibility or ii) transcription.
Extended Data Fig. 20.
Extended Data Fig. 20.. Sensitivity analysis of GraphVelo on simulated and mouse erythroid dataset.
(a) Runtime (left) and peak memory (right) consumption of GraphVelo with varying numbers of cells and genes on simulated data. (b) The speed correlation (left) against GraphVelo result reported in Figure. 3 and CBC score (right) with varying hyperparameters a and b.
Figure 1.
Figure 1.. Refining RNA velocity by tangent space projection and transforming between representations using GraphVelo.
(a) Workflow of RNA velocity-based analyses incoporating GraphVelo. Note GraphVelo takes any form of RNA velocity (i.e., not just splicing-based velocity) as input, and the kNN neighborhood is defined in the full state space (e.g., by both scRNAseq and scATACseq in multi-omics data). (b) Schematic of tangent space projection and velocity transformation between homeomophic manifolds. Left: RNA velocity vectors are projected onto the tangent space defined by the discretized local manifold of neighborhood cell samples. Right: GraphVelo allows for transformation of velocity vectors from a manifold embeded in a higher dimensional space () to that in a lower dimensional space (), and vice versa. (c) The process of minimizing the loss function of tangent space projection. Noisy velocity vectors (left) generated by adding random components orthogonal to those sampled from an analytical 2D manifold were projected back onto the 2D manifold, resulting in smooth velocity vectors that lie in the tangent space (right). (d) GraphVelo allows whole genome velocity inference based on the robustly estimated MacK genes (see also Figure 3). Velocities of genes undergoing variable kinetic rates, such as rapid degradation or transcription burst, are difficult to be correctly inferred by other methods, but can be inferred robustly with GraphVelo. (e) Virus infection dynamics and underlying host-virus interaction mechanisms uncovered by GraphVelo (see also Figure 4). Upper: pathways involved in host-virus interactions were identified using GraphVelo. Lower: GraphVelo predicted reversed trajectory of viral infection in response to in silico perturbations of viral factors. (f) GraphVelo provides a consistent view of epigenetic and transcription dynamics (see also Figure 5). Upper: GraphVelo analyses on multio-mics data revealed that most cell-cycle dependent genes showed decoupling between transcription dynamics and chromatin accessibility change dynamics. Lower: Effective dose-response curves reconstructed from multi-omics data revealed pioneer transcription factors increased chromatin accessibility then transcription of targe genes.
Figure 2.
Figure 2.. Testing graphVelo on simulated datasets.
(a) Velocity vectors of an analytical three variables bifurcating vector field constrained to a spherical surface. The data points were colored by simulation time. (b) Violinplots of: i) normal component of velocity vectors, ii) cosine similarity and iii) root mean square error (RMSE) between ground truth and velocity vectors projected by GraphVelo and cosine kernel, respectively. (c-e) Simulation of scRNA-seq data using dyngen under linear, cycling, and bifurcating differentiation models (left), and velocity fields projected on multidimensional scaling (MDS) coodinates (right) using GraphVelo-corrected velocities, respectively. Each simulation consists of 1,000 cell states and 100 genes. The cells in different states were colored by their simulation time along trajectory. (f-h) Boxplots of cosine similarity, and accuracy between the ground truth velocity vectors and dyngen simulated velocities after projection using GraphVelo TSP loss without cosine regularization, GraphVelo TSP loss with cosine regularization, cosine kernel, and random predictor, respectively.
Figure 3.
Figure 3.. Delineating transcriptome-wise progression with manifold-consistent kinetic genes using GraphVelo
(a) Schematitc of transcritional events mislead RNA velocity estimation in the phase portrait by standard approaches. Left: for genes exhibiting rapid degradation, the cells appear above the steady state line on the phase portrait, whereas the true velocity is negative. Right: For genes exhibiting transcription burst, the transcription rate abruptly increases at intermediate states, leading to a steady state line whose slope is overestimated. (b) Schematic of manifold-consistent score calculation for robustly estimated velocity genes. (c) The projected velocity field from GraphVelo are consistent with the erythroid differentiation by using all highly variable genes. (d) The correlation between GraphVelo vector field-based pseudotime and embryo time for erythroid lineage cells. Spearman correlation coefficients are shown. (e) GO enrichment analyses of top ranked MacK genes. (f) The phase portrait of two transcription burst genes (Smim1, Hba-x). (g) Scatter plots of: i) velocities estimated by scVelo, ii) refined velocities by GraphVelo, and iii) mature mRNA expression of transcription burst genes (Smim1, Hba-x). Cells were colored by corresponding velocity, and mature mRNA abundance, respectively, and visualized on the UMAP representation. (h) Gene regulatory cascade unraveled by GraphVelo-based vector field analyses that drives cell lineage commitment. (i) Activation of Gata1 inhibitor TF Spi1 lead to reversed velocity flows in gastrulation erythroid maturation investigated through in silico perturbation analyses on GraphVelo-based vector field. (j) Velocities derived from GraphVelo for the branching lineage in the hematopoiesis development and projected onto a pre-defined TSNE embedding. Directions of the projected cell velocities on TSNE are in agreement with the reported differentiation directions. (k) Terminal states identified by CellRank based on Markov chain formulation derived from GraphVelo velocities. (l) Phase portrait, velocity estimated by scVelo, refined velocity by GraphVelo, and gene expression of mature mRNA of identified rapid degradation genes (NPR3, ANGPT1). The cells were colored by the palantir pseudotime in the phase portrait. The box plots showed cell-specific γ for cells divided into bins according to pseudotime ordering in the phase protrait.
Figure 4.
Figure 4.. Using GraphVelo velocities to infer host-virus infection trajectory and identify host-pathogen interactions.
(a) Viral infection captured by the GraphVelo velocity field. Cells were colored by the percentage of viral RNA within a single cell. (b) Correlation between viral RNA percentage and pseudotime inferred by scVelo or GraphVelo. Spearman correlation coefficients and P values were shown. (c) Viral RNA velocities infered by GraphVelo along the viral RNA percentage axis. The black dot line highlights the zero velocity. (d) Boxplot summarizing the MacK scores of all viral genes calculated by GraphVelo, CellRank pseudotime kernel and random predictor. (e) Correlation between viral infection speed and RNA abundance. Genes were ranked by Spearman correlatioin coefficients. Host and viral genes that contribute to viral DNA synthesis were marked in the left side and those contribute to viral defense response were marked in the right side. Viral genes were highlighted in red. (f) UMAP representation of host and viral genes with distances defined by their dynamic expression patterns along the viral RNA percentage axis. (g) Example dynamic expression patterns within specific clusters (Leiden4, 5, 3, 6 from top to bottom) along the viral RNA percentage axis. Zero velocity was highlighted by black dot line. (h) GO enrichment of each cluster in (g). (i) Top host genes inhibited by each viral factor based on dynamo Jacobian analyses. Host effectors were organized by their involved pathways. (j) Dynamo prediction of total viral RNA change in response to in silico viral factor knockout. Viral factors were ranked by the mean of total viral RNA changes. (k) Vector field change resultant from infinitesmal inhibition of UL123 during the viral infection process.
Figure 5.
Figure 5.. Inferring epigenome and transcriptome consistent dynamics in mouse hair follicle development using GraphVelo multi-omics velocities.
(a) GraphVelo velocity fields of mouse hair follicle development. Cells were colored by cell macrostates. (b) Number of terminal states predicted by CellRank using velocities inferred with different methods. (c) Driver genes along multiple lineages identified through CellRank. (d) Topological analyses of GraphVelo vector field identified novel root cells and attractors residing in three terminal states(IRS, hair shaft-cuticle cortex, and medulla). (e) Expression levels of marker genes in novel root cells and expected root cells. Markers identified by Ma et al. were highlighted with stars and newly identified markers were highlighted in bold. (f) Regression results of MSD values along the transition path from the expected root or novel root to IRS. Two genes Runx1 and Shh genes with large MSD originating from the novel root were highlighted. (g) DTW distance between RNA velocity and chromatin velocity of individual genes. CCD genes were colored in red. The dotted line indicates the elbow point separating the decoupled genes from the rest. (h) GO enrichment of decoupled genes in (g). (i) Line plot of nomarlized RNA and chromatin velocity along pseudotime for genes predicted by GraphVelo to have notable decoupling patterns. Chromatin velocity trends were colored as brown and RNA velocity trends were colored as green. (j) Heatmaps of Jacobian element distribution along the axis of regulator RNA abundance of four regulator effector circuits: i) Lef1 versus Wnt3 chromatin accessibilities. ii) Hoxc13 versus Wnt3 chromatin accessibilities. iii) Lef1 versus Wnt3 transcription. iv) Hoxc13 versus Wnt3 transcription. (k) Effective dose-response curves obtained from integrating the averaged Jacobian elements over the corresponding normalized regulator mature mRNA regulator level in (j).

Similar articles

References

    1. La Manno G. et al. RNA velocity of single cells. Nature 560, 494–498 (2018). - PMC - PubMed
    1. Bergen V., Lange M., Peidli S., Wolf F.A. & Theis F.J. Generalizing RNA velocity to transient cell states through dynamical modeling. Nat Biotechnol 38, 1408–1414 (2020). - PubMed
    1. Li S. et al. A relay velocity model infers cell-dependent RNA velocity. Nat Biotechnol 42, 99–108 (2024). - PMC - PubMed
    1. Lederer A.R. et al. Statistical inference with a manifold-constrained RNA velocity model uncovers cell cycle speed modulations. Nat Methods (2024). - PMC - PubMed
    1. Gayoso A. et al. Deep generative modeling of transcriptional dynamics for RNA velocity analysis in single cells. Nat Methods 21, 50–59 (2024). - PMC - PubMed

Publication types

LinkOut - more resources