[Preprint]. 2024 Dec 6:2024.12.03.626640.
doi: 10.1101/2024.12.03.626640.

Mechanism of small heat shock protein client sequestration and induced polydispersity

Affiliations

Mechanism of small heat shock protein client sequestration and induced polydispersity

Adam P Miller et al. bioRxiv. .

Update in

Abstract

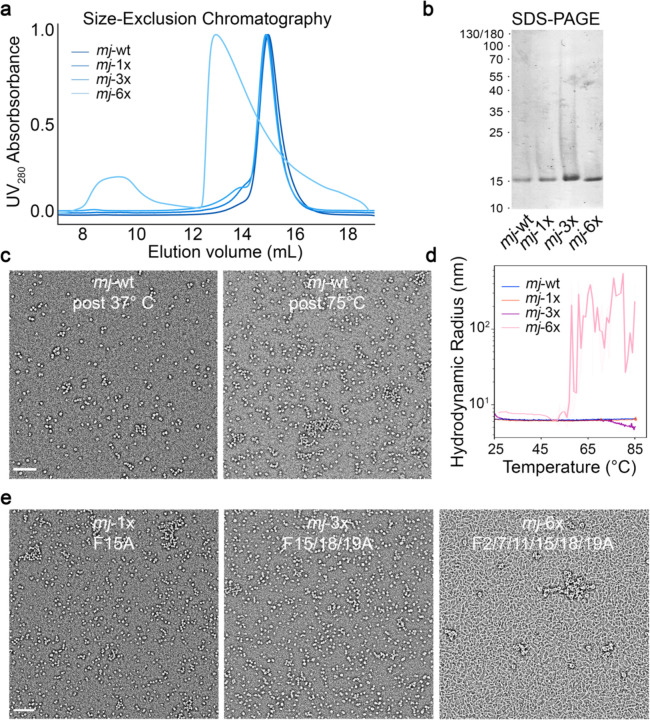
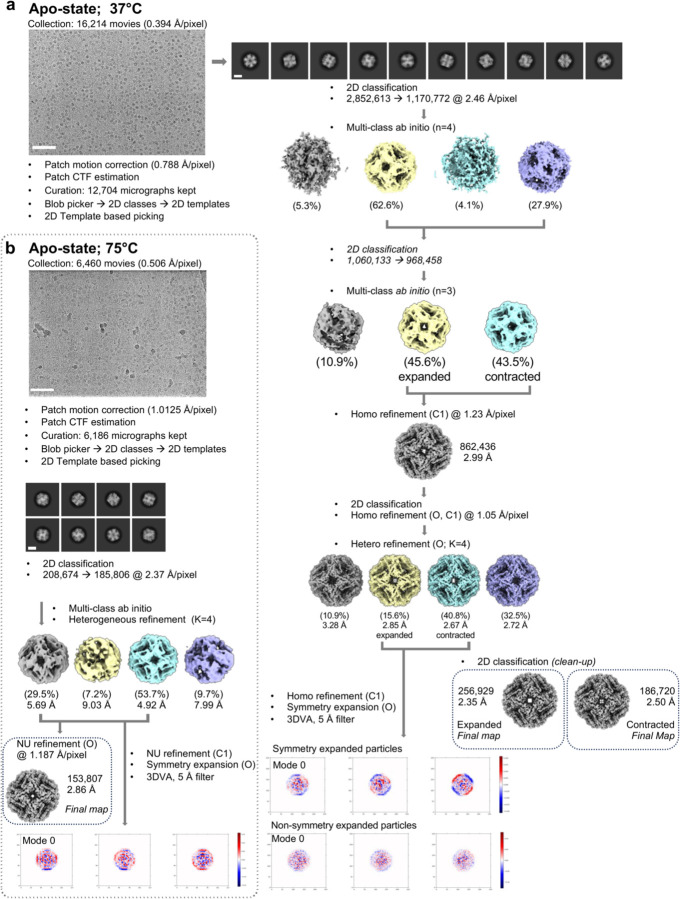
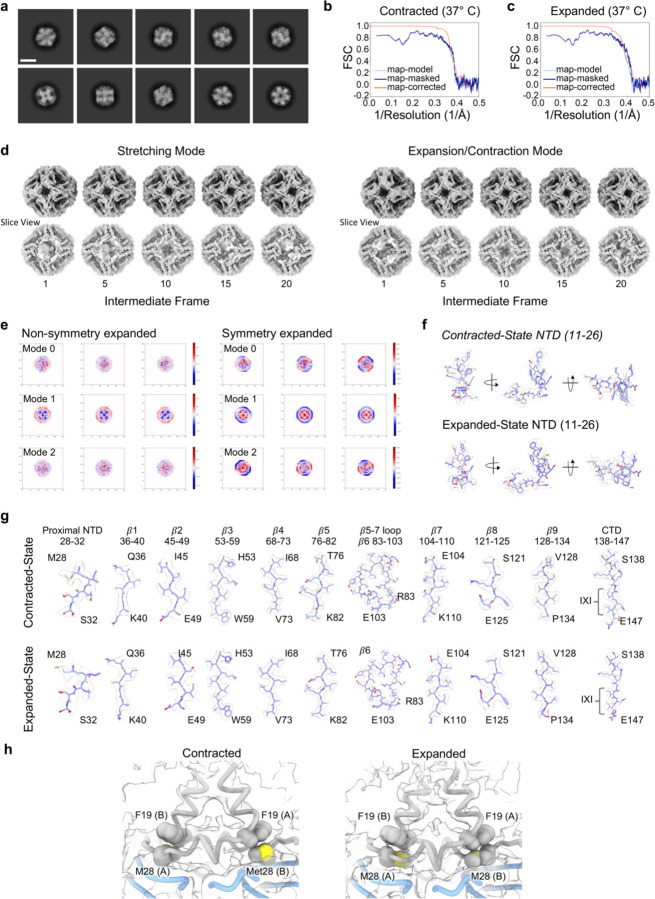
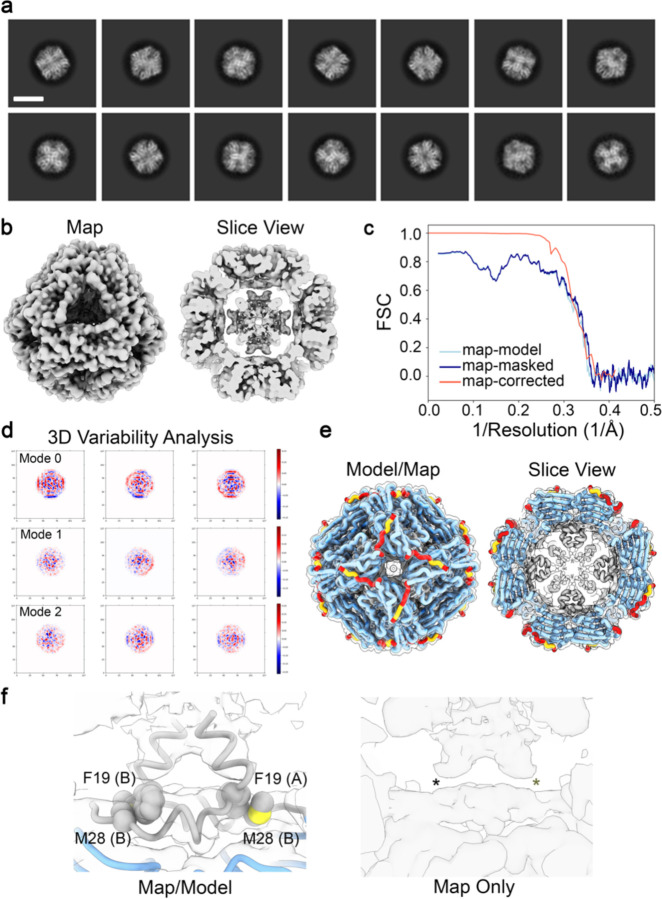
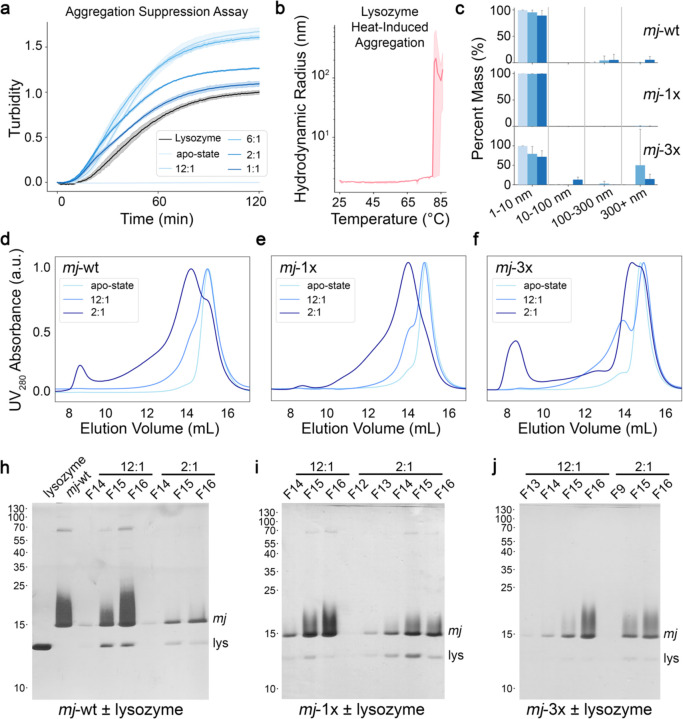
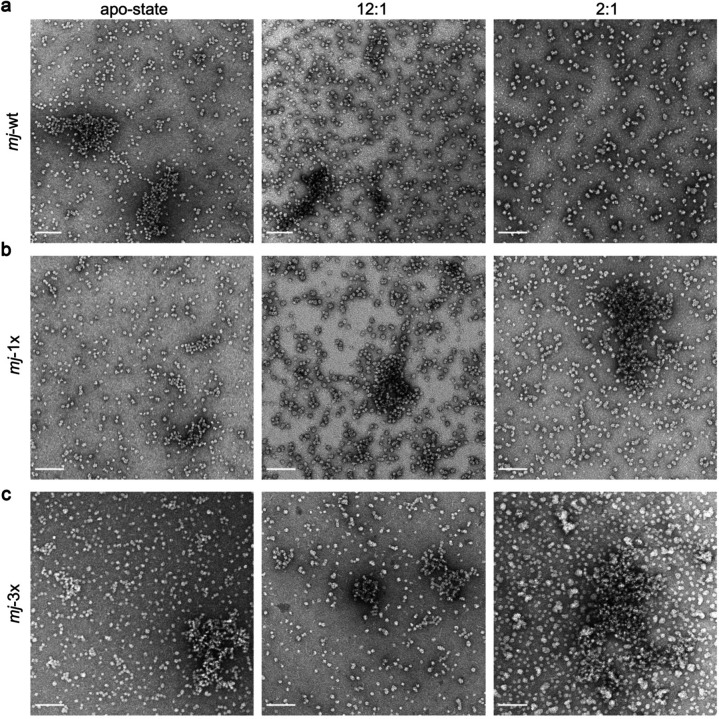
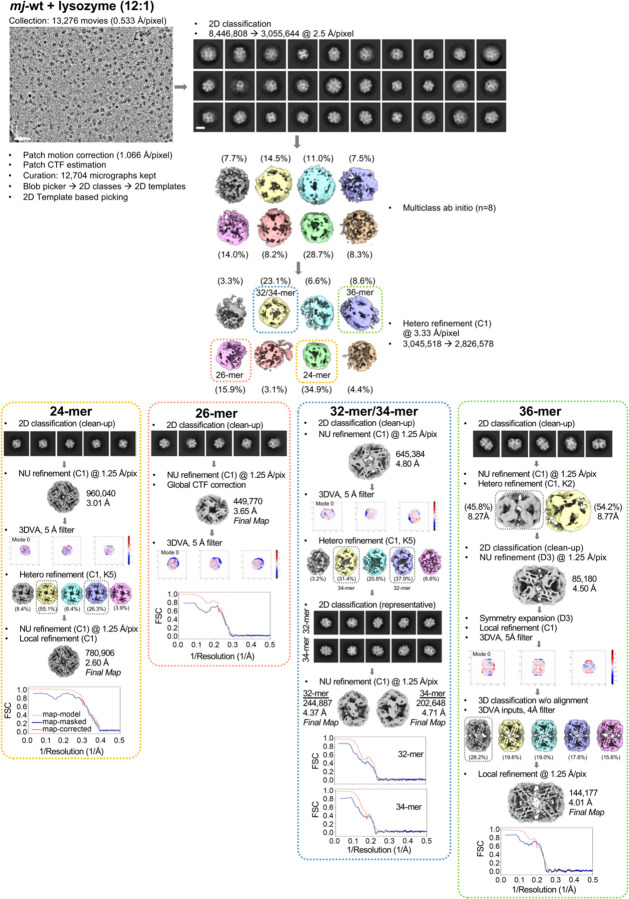
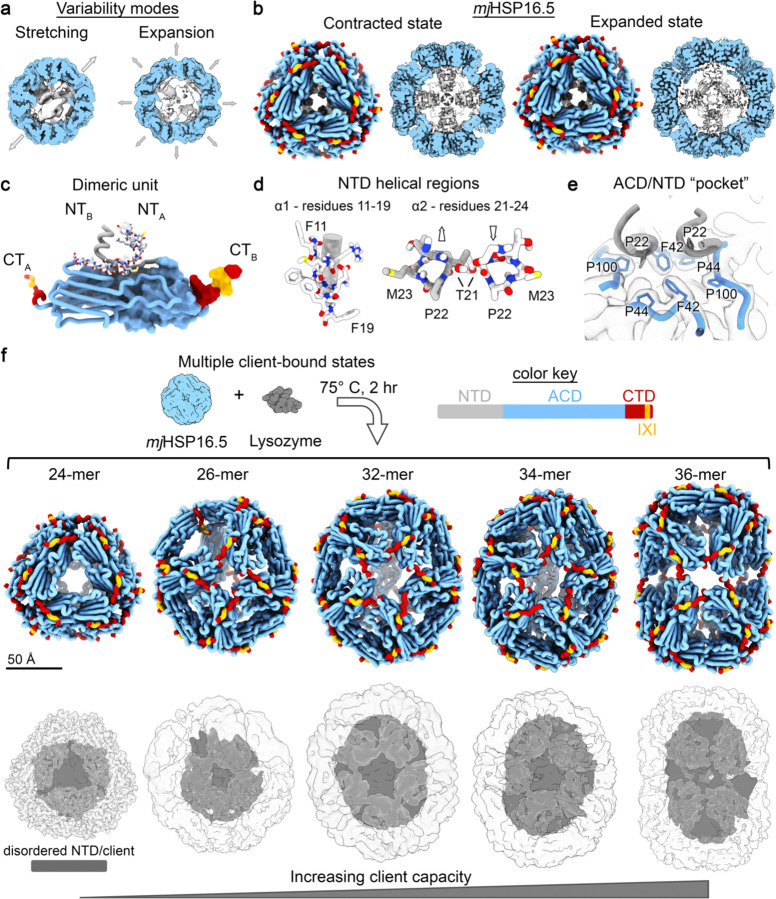
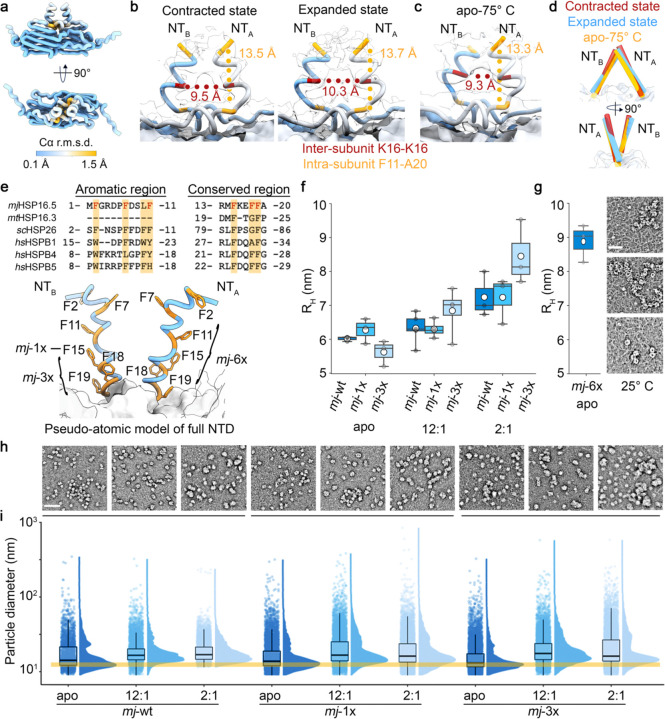
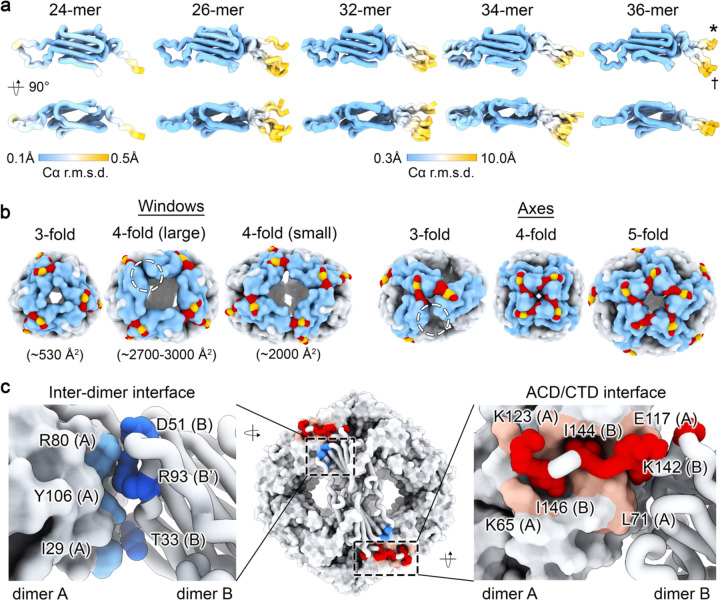
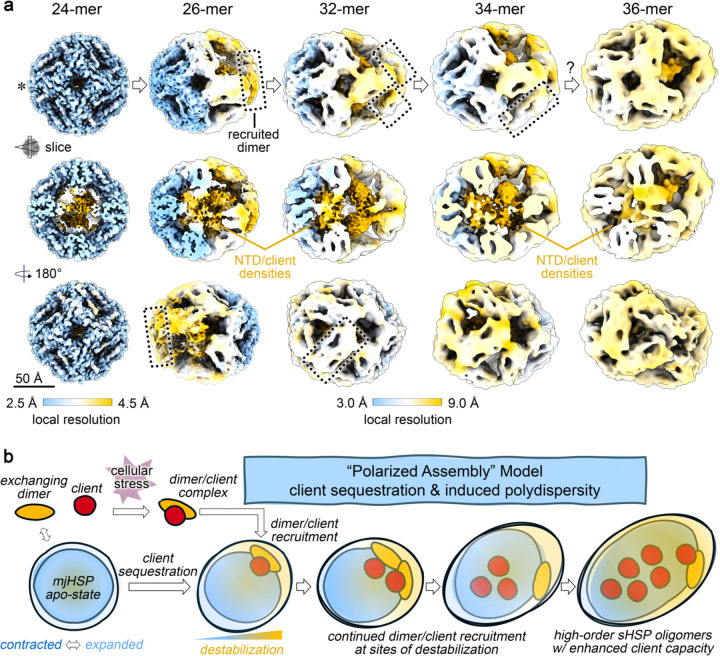
Small heat shock proteins (sHSPs) act as first responders during cellular stress by recognizing and sequestering destabilized proteins (clients), preventing their aggregation and facilitating downstream refolding or degradation1-3. This chaperone function is critically important to proteostasis, conserved across all kingdoms of life, and associated with various protein misfolding diseases in humans4,5. Mechanistic insights into how sHSPs sequester destabilized clients have been limited due to the extreme molecular plasticity and client-induced polydispersity of sHSP/client complexes6-8. Here, we present high-resolution cryo-EM structures of the sHSP from Methanocaldococcus jannaschii (mjHSP16.5) in both the apo-state and in an ensemble of client-bound states. The ensemble not only reveals key molecular mechanisms by which sHSPs respond to and sequester client proteins, but also provides insights into the cooperative nature of chaperone-client interactions. Engagement with destabilized client induces a polarization of stability across the mjHSP16.5 scaffold, proposed to facilitate higher-order assembly and enhance client sequestration capacity. Some higher-order sHSP oligomers appear to form through simple insertion of dimeric subunits into new geometrical features, while other higher-order states suggest multiple sHSP/client assembly pathways. Together, these results provide long-sought insights into the chaperone function of sHSPs and highlight the relationship between polydispersity and client sequestration under stress conditions.

Keywords: Chaperone; cryo-electron microscopy (cryo-EM); proteostasis; small heat shock protein (sHSP).


Conflict of interest statement

CONFLICT OF INTERESTS Authors declare no competing interests.

Figures

Extended Data Figure 1.
Extended Data Figure 1.. Purification, negative-stain EM and thermos-stability of mjSP16.5 constructs.
a, Size-exclusion chromatography traces for apo-states of mjHSP16.5 wildtype (mj-wt) and NTD variants (mj-1x, mj-3x, and mj-6x). b, SDS-PAGE visualized by silver staining of purified mj-wt, mj-1x, mj-3x, and mj-6x. c, Negative-stain electron microscopy (NS-EM) of apo-state mjHSP16.5 after heating at 37° C (~16 hours) and 75° C (2 hours). d, Temperature ramp from 25–85° C for mj-1x, mj-3x, and mj-6x and corresponding hydrodynamic radius showing mj-6x aggregation around 55–60° C. mj-wt and other variants were stable up to 85° C. e, NS-EM of apo-state mj-1x (75° C) and mj-3x (75° C) and mj-6x (25° C) mj-6x at two dilutions displayed background fibers (~2 nm wide) and circular assemblies. Micrograph scale bars = 100 nm.
Extended Data Figure 2.
Extended Data Figure 2.. Single-particle cryo-EM image processing workflows for the mjHSP16.5 apo-37 and apo-75 datasets.
Overview of preprocessing, 2D/3D classification, ab initio model generation, 3D refinement, and 3D variability analysis steps for a, apo-state 37° and b, apo-state 75° datasets. Particle count numbers, pixel sizes, symmetries, and resolutions are noted where appropriate. Scale bars for micrographs = 100 nm, and for 2D classes = 5 nm.
Extended Data Figure 3.
Extended Data Figure 3.. Resolution assessment and 3D variability analysis of the apo-37 cryo-EM dataset.
a, Representative 2D classes showing multiple views of the canonical 24-mer caged assembly. Scale bar = 10 nm. b-c, Fourier Shell Correlation (FSC) plots of the contracted and expanded states displaying the CryoSPARC generated FSC plot of the corrected map (red), the unmasked map to model FSC (light blue) and masked map to model FSC (dark blue) generated by Phenix. d, Intermediate reconstructions for the stretching and expansion principal component modes identified from 3D variability analysis in CryoSPARC, shown along 4-fold axis (top) and internal slice view (bottom). e, Principal component modes from 3D variability analysis with and without symmetry expansion of the consensus particle set, displayed as heat maps of density variability across each mode. f-g, Segmented views of the model-to-map fit for the contracted and expanded atomic models. h, Interaction of Phe19 and Met28 (shown as space-filling model) between dimeric protomers (A and B).
Extended Data Figure 4.
Extended Data Figure 4.. Resolution assessment and 3D variability analysis of the apo-75 cryo-EM dataset.
a, Representative 2D classes showing multiple views of the canonical 24mer caged assembly. Scale bar = 10 nm. b, Consensus 3D reconstruction of apo-75 with octahedral (O) symmetry imposed, shown from the canonical 3-fold axis of the 24-mer (left) and slice view displaying internal density (right) showing helical density from the NTD protruding toward the center of the cage. c, Fourier shell correlation (FSC) plot of apo-75 reconstruction show in (b), displayed for the corrected map (red) from CryoSPARC, the unmasked map to model FSC (light blue) and masked map to model FSC (dark blue) from Phenix. d, Principal component modes from 3D variability analysis displayed as heat maps of density variability across each mode. e, Atomic model for residues 11–147 fit into sharpened cryo-EM density map. f, Left, Map and model showing putative competition between Phe18 and Phe19 with Met28 between dimeric protomer chains (A and B). Right, Map without model showing weakened density at base of NTD helix α1, as compared to the apo-37 maps.
Extended Data Figure 5.
Extended Data Figure 5.. Chaperone-client binding assays for mjHSP16.5 wildtype (mj-wt) and NTD variants (mj-1x: F15A; mj-3x: F15/18/19A).
a, Overlay of turbidity traces obtained at 37° C for ratios of mj-wt to lysozyme (12:1, 6:1, 2:1, and 1:1), mj-wt alone (light blue), and lysozyme alone (gray). For these conditions, lysozyme unfolding was initiated with reducing agent. Trace shows average and s.d. of n=4 technical replicates. b, Bulk hydrodynamic radius of lysozyme, under non-reducing conditions, measured from 25°–85° C by dynamic light scattering showing heat-induced aggregation occurring at temperatures above ~80° C. Trace shows average and s.d. of n=3 replicates. c, Histograms showing binned hydrodynamic radii (1–10 nm, 10–100 nm, 100–300 nm, and 300+ nm bins) and associated percent mass for mj-wt, mj-1x, and mj-3x in the presence and absence of lysozyme, under non-reducing conditions, after incubation at 75° C for two hours. Error bars represent 95% confidence interval; n = 3–5 independent experiments. d-f, Representative size-exclusion chromatography (SEC) traces for mj-wt (d), mj-1x (e), and mj-3x (f) with lysozyme (12:1 and 2:1 chaperone:client ratios) and in the apo-state after incubation at 75° C for two hours. h-j, SDS-PAGE analysis of fractions collected from SEC runs of mj-wt, mj-1x, and mj-3x with lysozyme (12:1 and 2:1 ratios), respectively. Position of molecular weight markers indicated (left) and protein bands corresponding the mjHSP16.5 (mj) and lysozyme (lys) indicated (right).
Extended Data Figure 6.
Extended Data Figure 6.. NS-EM analysis of lysozyme chaperone assays.
Representative unfiltered NS-EM micrographs of a, mj-wt, b, mj-1x, and c, mj-3x in the apo-state (left), and for the 12:1 (middle) and 2:1 (right) chaperone:client ratios. Scale bar = 100 nm.
Extended Data Figure 7.
Extended Data Figure 7.. Single-particle cryo-EM processing workflow for the mjHSP16.5/lysozyme dataset.
Overview of preprocessing, 2D/3D classification, ab initio model generation, 3D refinement, and 3D variability analysis steps. Particle count numbers, pixel sizes, symmetries, and resolutions are noted were appropriate. Outlined boxes are color coded to match ab initio models and corresponding downstream processing for each oligomeric state. Final maps used for model building are noted along with the corresponding CryoSPARC generated Fourier Shell Correlation (FSC) plot for the corrected map (red), and unmasked map to model FSC (light blue) and masked map to model FSC (dark blue) generated by Phenix. Scale bars for micrograph = 100 nm, and for 2D classes = 10 nm.
Figure 1.
Figure 1.. Single-particle cryo-EM analysis of mjHSP16.5 in the absence and presence of destabilized client.
a, mjHSP16.5 apo-state displayed conformational dynamics, described by principal component modes of stretching (left) and expansion (right) identified by cryo-EM 3D variability analysis. Asymmetric cryo-EM density maps are displayed in slice view to show the central cavity, with ACDs colored in blue and internal density belonging to the NTD colored in gray. b, Resolved contracted (left) and expanded (right) states of mjHSP16.5 apo-state (37° C). (left) Atomic models depicted in cartoon representation (ACD:blue, CTD:red, CT-IXI motif:yellow). (right) Central slice of the corresponding cryo-EM density map, colored as in (a). c, sHSP dimeric unit of the expanded state with NTD region colored as in (b) and throughout Fig.1 (see color key). d, Atomic models of NTD helical regions α1 (residues 11–19, left) and α2 (residues 21–24, right) with various residues labeled for orientation purposes. e, Atomic model and cryo-EM map (semi-transparent) showing the ACD/NTD pocket pertaining to ACD residues (Phe42, Pro44, and Pro100) and Pro22 region of the NTD that fits into the ACD ‘pocket’. f, Atomic models (top) and cryo-EM density maps (bottom) of the 24-mer, 26-mer, 32-mer, 34-mer, and 36-mer states of mjHSP16.5 obtained in the presence of destabilized lysozyme (75° C incubation for 2 hours). Cryo-EM density maps for the ACD/CTD scaffold shown in transparency, with internal density corresponding to disordered NTD/client shown in gray.
Figure 2.
Figure 2.. Conserved Phe residues within the NTD are critical to sHSP assembly, stability and chaperone function.
a, Cα root-mean square standard deviation (r.m.s.d., colored) comparison between the contracted and expanded states of the apo-37 dataset. b-c, Distance measurements between NTDs from neighboring chains within a dimer (NTA and NTB) for the contracted and expanded states of apo-37 (b) and apo-75 (c). Measurements made between Cα atoms of Lys16 of each chain, and between Phe11 with Ala20 within a chain. d, Views of α1 helical region of the contracted (red) and expanded (blue) states of apo-37 and apo-75 (yellow). e, Sequence alignment (top) of ‘aromatic’ and ‘conserved’ regions within the NTD of various small heat shock proteins (mjHSP16.5, M. tuberculosis mtHSP16.3, S. cerevisiae scHSP26, and human hsHSPB1 (HSP27), hsHSPB4 (αA-crystallin), and hsHSPB5 (αB-crystallin). Phe residues of mjHSP16.5 mutated in this study are highlighted. Pseudo-atomic model (bottom) of full mjHSP16.5 NTDs within a dimer (NTA and NTB) with each Phe residue labeled. f, Hydrodynamic radii of major populations detected by DLS for mjHSP16.5 wildtype (mj-wt) and NTD variants (F15A;mj-1x and F15/18/19A;mj-3x) in the absence (apo) or presence of lysozyme (12:1 and 2:1, chaperone:client ratios) after incubation at 75° C for 2 hours (n = 3–5 independent experiments). g, Hydrodynamic radius (n = 3 independent experiments) and representative NS-EM micrographs of the mj-6x variant (at 25° C) in the apo-state (scale bar = 50 nm). h-i, NS-EM micrographs (scale bar = 50 nm) and associated Feret diameters obtained from single-particle measurements for mj-wt and the mj-1x and mj-3x variants in the absence (apo) and presence (12:1 and 2:1) of lysozyme after incubation at 75°C for 2 hours displayed as rain cloud plots. Yellow bar indicates the Feret diameter for the major population of particles in the mj-wt apo-state dataset. Box plots (panels f,g) show the central 50% of the data, spanning from the first quartile (Q1) to the third quartile (Q3), with a line at the median. Whiskers extend to the minimum and maximum values.
Figure 3.
Figure 3.. Flexible CTD interactions facilitate multiple oligomeric states that correlate with adopted non-canonical geometrical features.
a, Comparison of Cα r.m.s.d. values for protomers within each oligomer state obtained in the presence of lysozyme (24-mer, 26-mer, 32-mer, 34-mer, and 36-mer shown left to right). Color keys show range of r.m.s.d. values for the 24-mer (left) and other higher-order oligomers (center). b, Windows and axes adopted by the 24-mer (canonical 3-fold window/4-fold axis), and non-canonical states formed by the 26-mer (4-fold window/3-fold axis), 32- and 34-mer (4-fold window/5-fold axis), and 36-mer (4-fold window/4-fold axis). sHSP models displayed as low-pass filtered surfaces with subunits colored to highlight the specified features. Circled areas highlight unresolved/unmodeled CTD regions, presumably reflecting intrinsic flexibility. c, Interfaces corresponding to the inter-dimer interfaces formed between ACDs (blue/left) and ACD/CTD interaction (red, right). Zoom views, depict residues involved in these interfaces.
Figure 4.
Figure 4.. Polarized destabilization induced by client sequestration correlates with sites of recruited dimers to form higher-order sHSP oligomers.
a, Asymmetric cryo-EM density maps of mjHSP16.5/lysozyme oligomeric state depicted along a 4-fold axis (top), an internal slice view (middle) showing NTD/client densities, and a 180° rotation (bottom). Map densities colored according to local resolution. Color keys show range of resolution values for the 24-mer (left) and the other higher-order oligomers (center). Asterisk indicates site of common axis for alignment. Dotted rectangles indicate sites of dimer recruitment to form higher-order oligomers. Scale bar = 50 Å. b, Illustration summarizing the proposed “polarized assembly” model of sHSP client sequestration and induced polydispersity, as described in the main text.

Similar articles

References

    1. Jakob U., Gaestel M., Engel K. & Buchner J. Small heat shock proteins are molecular chaperones. J. Biol. Chem. 268, 1517–1520 (1993). - PubMed
    1. Horwitz J. Alpha-crystallin can function as a molecular chaperone. Proc Natl Acad Sci U A 89, 10449–53 (1992). - PMC - PubMed
    1. Ungelenk S. et al. Small heat shock proteins sequester misfolding proteins in near-native conformation for cellular protection and efficient refolding. Nat. Commun. 7, 13673 (2016). - PMC - PubMed
    1. Caspers G.-J., Leunissen J. A. M. & de Jong W. W. The expanding small heat-shock protein family, and structure predictions of the conserved “α-crystallin domain”. J. Mol. Evol. 40, 238–248 (1995). - PubMed
    1. Kampinga H. H. & Garrido C. HSPBs: small proteins with big implications in human disease. Int J Biochem Cell Biol 44, 1706–10 (2012). - PubMed

Publication types

LinkOut - more resources