[Preprint]. 2024 Dec 5:2024.11.29.625709.
doi: 10.1101/2024.11.29.625709.

Macropinocytosis controls metabolic stress-driven CAF subtype identity in pancreatic cancer

Affiliations

Macropinocytosis controls metabolic stress-driven CAF subtype identity in pancreatic cancer

Yijuan Zhang et al. bioRxiv. .

Update in

Abstract

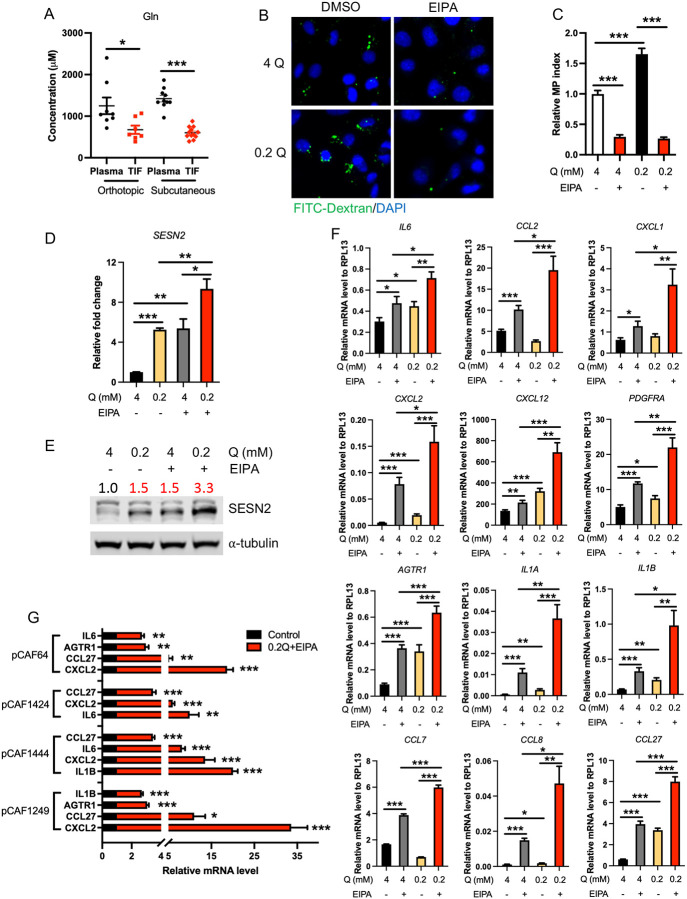
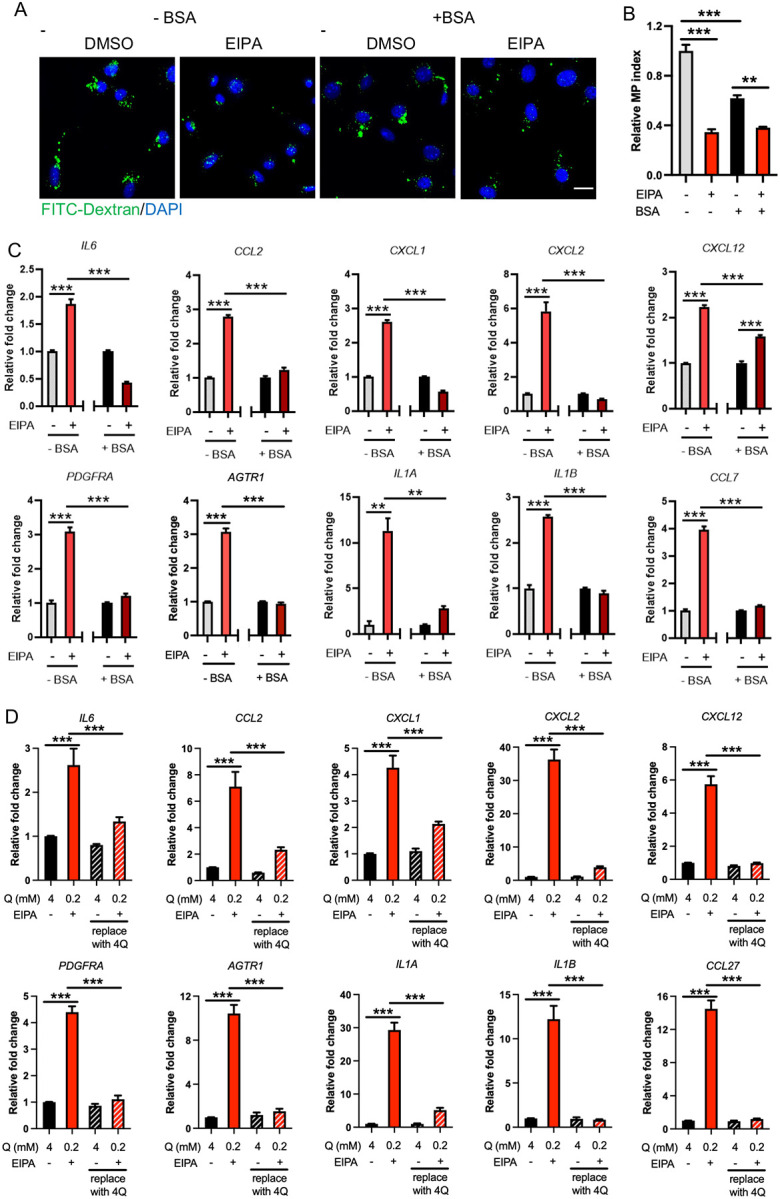
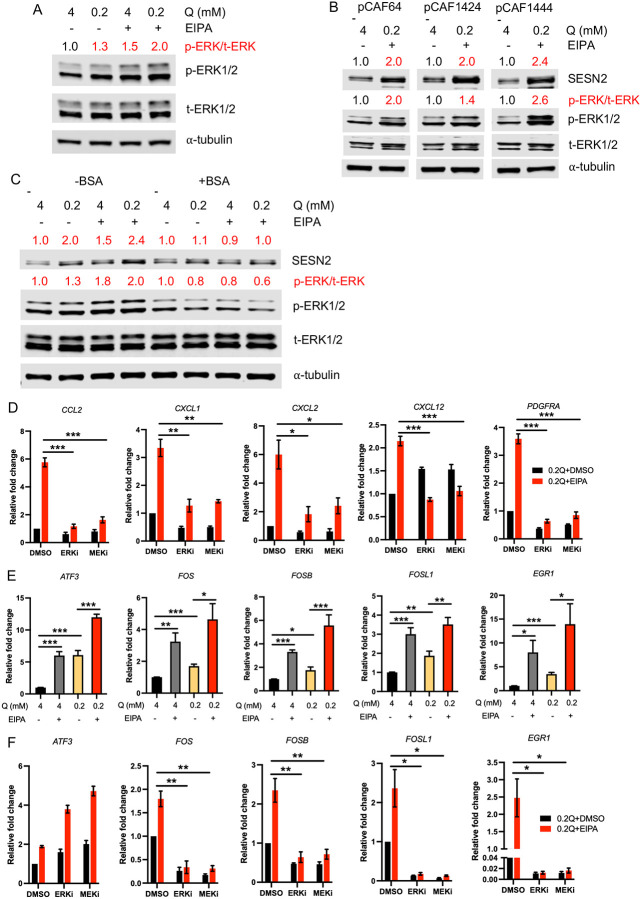
Pancreatic ductal adenocarcinoma (PDAC) tumors are deficient in glutamine, an amino acid that tumor cells and CAFs use to sustain their fitness. In PDAC, both cell types stimulate macropinocytosis as an adaptive response to glutamine depletion. CAFs play a critical role in sculpting the tumor microenvironment, yet how adaptations to metabolic stress impact the stromal architecture remains elusive. In this study, we find that macropinocytosis functions to control CAF subtype identity when glutamine is limiting. Our data demonstrate that metabolic stress leads to an intrinsic inflammatory CAF (iCAF) program driven by MEK/ERK signaling. Utilizing in vivo models, we find that blocking macropinocytosis alters CAF subtypes and reorganizes the tumor stroma. Importantly, these changes in stromal architecture can be exploited to sensitize PDAC to immunotherapy and chemotherapy. Our findings demonstrate that metabolic stress plays a role in shaping the tumor microenvironment, and that this attribute can be harnessed for therapeutic impact.

Keywords: CAF heterogeneity; Metabolic stress; drug delivery; macropinocytosis; pancreatic cancer; stromal architecture; tumor microenvironment.


Conflict of interest statement

Conflict of interest statement: C.C. is an inventor on a U.S. patent titled “Cancer diagnostics, therapeutics, and drug discovery associated with macropinocytosis,” Patent number: US-11209420-B2. Declaration of interests C.C. is an inventor on a U.S. patent titled “Cancer diagnostics, therapeutics, and drug discovery associated with macropinocytosis,” Patent number: US-11209420-B2.

Figures

Figure 1.
Figure 1.. Glutamine deprivation and macropinocytosis cooperate to control metabolic stress and CAF subtype identity.
(A) Quantitation of glutamine levels in plasma and tumor interstitial fluid (TIF) that were isolated from orthotopic or subcutaneous KPC tumors. Data are shown as mean ± SEM, unpaired t-test. *p<0.05, ***p<0.001. (B and C) Representative images (B) and quantification (C) of macropinocytic uptake of FITC-labeled dextran in CAFs treated with 4 mM or 0.2 mM glutamine (Q) with or without the presence of 25 μM EIPA for 24 hours. Representative data of three independent experiments are shown as mean ± SEM, unpaired t-test. ***p<0.001. Scale bar: 20 μm. (D and E) Mouse CAFs were treated with 4 mM or 0.2 mM glutamine (Q) with or without the presence of 25 μM EIPA for 2 or 4 hours. The mRNA (D) and protein (E) levels of sestrin2 (SESN2) were analyzed by qPCR and western blot, respectively. Data are shown as mean ± SEM, one-way ANOVA. *p<0.05, **p<0.01, ***p<0.001. (F) Mouse CAFs were treated with 4 mM or 0.2 mM Q with or without the presence of 25 μM EIPA for 32 hours. The mRNA levels of iCAF-related markers were analyzed by qPCR and normalized to RPL13. Data are shown as mean ± SEM, one-way ANOVA and unpaired t-test. *p<0.05, **p<0.01, ***p<0.001. (G) Four primary PDAC patient-derived CAFs (pCAF) were treated with 0.2 mM Q with 25 μM EIPA or vehicle control for 48 hours. The mRNA levels of iCAF-related markers were analyzed by qPCR. Data are shown as mean ± SEM, unpaired t-test. *p<0.05, **p<0.01, ***p<0.001.
Figure 2.
Figure 2.. Induction of CAF inflammatory markers by metabolic stress is rescued by serum albumin supplementation and is reversible.
(A and B) Representative images (A) and quantification (B) of macropinocytic uptake of FITC-labeled dextran in mouse CAFs treated with 0.2 mM Q with DMSO or EIPA with or without the presence of 40 mg/mL BSA. Representative data of three independent experiments are shown as mean ± SEM, One-way ANOVA. **p<0.01, ***p<0.001. Scale bar: 20 μm. (C) Mouse CAFs were treated with 0.2 mM Q with DMSO or EIPA with or without the presence of 4% BSA for 24 hours. The mRNA levels of iCAF-related markers were analyzed by qPCR. Data are shown as mean ± SEM, unpaired t-test. *p<0.05, **p<0.01, ***p<0.001. (D) Mouse CAFs were treated with 4 mM Q plus vehicle or 0.2 mM Q plus EIPA. 32 hours post treatment, one set of samples were collected as baseline and another set were washed with PBS and cultured with 4 mM Q medium for an additional 24 hours. Data are shown as mean ± SEM, unpaired t-test. ***p<0.001.
Figure 3.
Figure 3.. Metabolic stress-induced iCAF phenotype requires MEK/ERK signaling.
(A) Mouse CAFs were treated with 4 mM or 0.2 mM Q with or without the presence of 25 μM EIPA for 4 hours. The protein levels of phospho-ERK1/2 (p-ERK1/2) and total-ERK1/2 (t-ERK1/2) were analyzed by western blots. (B) Human pCAFs were treated with 4 mM Q plus DMSO or 0.2 mM Q plus 25 μM EIPA for 24 hours. The protein levels of SESN2, p-ERK1/2 and t-ERK1/2) were analyzed by western blots. (C) Mouse CAFs were treated with 0.2 mM Q with DMSO or EIPA with or without the presence of 4% BSA for 4 hours. The protein levels of SESN2, p-ERK1/2 and t-ERK1/2) were analyzed by western blots. (D) Mouse CAFs were pre-treated with ERK inhibitor (ERKi) or MEK inhibitor (MEKi) for 1 hour and then treated with 4 mM or 0.2 mM Q with or without the presence of 25 μM EIPA for 24 hours. The mRNA levels of iCAF-related markers were analyzed by qPCR. Data are shown as mean ± SEM, unpaired t-test. *p<0.05, **p<0.01, ***p<0.001. (E) Mouse CAFs were treated with 4 mM or 0.2 mM Q with or without the presence of 25 μM EIPA for 4 hours. The mRNA levels of the transcription factors were analyzed by qPCR. Data are shown as mean ± SEM, one-way ANOVA and unpaired t-test. *p<0.05, **p<0.01, ***p<0.001. (F) Mouse CAFs were pre-treated with ERKi or MEKi for 1 hour and then treated with 4 mM or 0.2 mM Q with or without the presence of 25 μM EIPA for 6 hours. The mRNA levels of the transcription factors were analyzed by qPCR. Data are shown as mean ± SEM, unpaired t-test. *p<0.05, **p<0.01, ***p<0.001.
Figure 4.
Figure 4.. Macropinocytosis inhibition suppresses PDAC tumor growth and modulates CAF heterogeneity in vivo.
(A and B) Representative images (A) and total tumor weights (B) of KPC orthotopic tumors treated with DMSO (vehicle, n=14) or EIPA (n=13) at 10 mg/kg for two weeks. Tumors are outlined with white dashed lines. Data are shown as mean ± SEM, unpaired t-test. *p<0.05. (C-E) Ex-vivo macropinocytic uptake of TMR-labeled dextran was performed on KPC orthotopic tumors treated with DMSO or EIPA. Tumor cells and myCAFs were labeled with CK-19 (green) or α-SMA (magenta), respectively (C). The relative macropinocytic (MP) index was calculated by the average particle intensity per area of the tumor cells (D) or the myCAFs (E), and normalized to the control. Data are shown as mean ± SEM, n(DMSO)=4; n(EIPA)=5. Unpaired t-test. *p<0.05, **p<0.01. Scale bar: 20 μm. (F) Heatmap depicting expression of iCAF-related genes in DMSO (n=5) or EIPA (n=5)-treated PDAC tumors using nanoString nCounter mouse PanCancer Immune Profiling Panel. Fold change in mRNA levels is shown for each gene. (G and H) EIPA-treated PDAC tumors were dissociated and stained with a panel of markers for CAF characterization, followed by flow cytometry analysis. From CD45CD31EpCAMPDPN+ total CAFs, three CAF subtypes were identified using the markers Ly6C and MHC-II, as indicated. Representative flow cytometric results of tumors with or without EIPA treatments were shown (G). The population distribution for each CAF subtype was determined (H). Data are shown as mean ± SEM, n=5. Unpaired t-test. *p<0.05. (I and J) Representative images (I) and quantification (J) of anti-TAGLN staining in KPC orthotopic tumors treated with DMSO or EIPA. ~35 fields (20x) from 6 tumors for each group were analyzed. Data are shown as mean ± SD, unpaired t-test. ***p<0.001. Scale bar: 50 μm. (K and L) Representative images (K) and quantification (L) of anti-PDGFRα staining in KPC orthotopic tumors treated with DMSO or EIPA. ~35 fields (20x) from 6 tumors for each group were analyzed. Data are shown as mean ± SD, unpaired t-test. **p<0.01. Scale bar: 50 μm. (M and N) Representative images (M) and quantification (N) of anti-p-ERK1/2 staining in KPC orthotopic tumors treated with DMSO or EIPA. ~80 fields (40x) from 5 tumors for each group were analyzed. Data are shown as mean ± SEM. Unpaired t-test. ***p<0.001. Scale bar: 50 μm.
Figure 5.
Figure 5.. Macropinocytosis inhibition combined with immune checkpoint blockade suppresses PDAC progression.
(A and B) Representative images (A) and quantification (B) of anti-CD4 staining in KPC orthotopic tumors treated with DMSO or EIPA. ~70 fields (20x) from 6 DMSO-treated tumors and ~50 fields (20x) from 6 EIPA-treated tumors were analyzed. Data are shown as mean ± SD, unpaired t-test. ***p<0.001. Scale bar: 100 μm. (C and D) Representative images (C) and quantification (D) of anti-CD8 staining in KPC orthotopic tumors treated with DMSO or EIPA. ~70 fields (20x) from 6 DMSO-treated tumors and ~50 fields (20x) from 6 EIPA-treated tumors were analyzed. Data are shown as mean ± SD, unpaired t-test. ***p<0.001. Scale bar: 100 μm. (E) Mice bearing orthotopic PDAC tumors were treated with EIPA and/or anti-PD-1 antibody. 27 days post-implantation, tumors were harvested and weighed. Data are shown as mean ± SEM; n(DMSO+IgG2a)=13; n(DMSO+a-PD-1)=11; n(EIPA+IgG2a)=13; n(EIPA+a-PD-1)=9. One-way ANOVA. *p<0.05, ***p<0.001. (F) Mice bearing orthotopic PDAC tumors were treated with EIPA+anti-PD-1 antibody or vehicle+isotype antibody. Overall survival was analyzed using Kaplan-Meier curves with the log-rank test. n(DMSO+IgG2a)=11; n(EIPA+a-PD-1)=8. (G and H) Representative images (G) and quantification (H) of anti-cleaved caspase-3 staining in KPC orthotopic tumors after treatment. Images were analyzed: DMSO+IgG2a, 54 fields (20x) from 4 tumors; EIPA+IgG2a, 39 fields (20x) from 5 tumors; DMSO+a-PD-1, 43 fields (20x) from 5 tumors; EIPA+a-PD-1, 32 fields (20x) from 4 tumors. Data are shown as mean ± SD, One-way ANOVA. **p<0.01, ***p<0.001. Scale bar: 50 μm. (I and J) Representative images of intestinal macrometastases (I), and the quantification of average number of nodules per length of intestine (J). Unpaired t-test. *p<0.05. (K and L) Representative images (K) and quantification (L) of anti-p53 staining in the lungs. 25 fields (20x) from 5 lungs for each group were analyzed. Data are shown as mean ± SD, One-way ANOVA. ***p<0.001. Scale bar: 50 μm.
Figure 6.
Figure 6.. Macropinocytosis inhibition enhances drug delivery and therapeutic response to gemcitabine.
(A and B) Representative images (A) and quantification (B) of collagen via trichrome staining in KPC orthotopic tumors treated with DMSO or EIPA. 28 fields (10x) from 5 DMSO-treated tumors and 25 fields (10x) from 5 EIPA-treated tumors were analyzed. Data are shown as mean ± SD, unpaired t-test. ***p<0.001. Scale bar: 100 μm. (C) Representative images of anti-CD31 staining in KPC orthotopic tumors treated with DMSO or EIPA. Red arrows indicate CD31-labeled blood vessels. Scale bar: 50 μm. (D and E) Representative images (B) and quantification (C) of doxorubicin (DOX) delivery in KPC orthotopic tumors treated with DMSO or EIPA. Nuclei were co-stained with DAPI. Data are shown as mean ± SEM (n=3). Unpaired t-test. ***p<0.001. Scale bar: 20 μm. (F) Schematic depicting the treatment protocol for EIPA pre-treatment and gemcitabine administration. (G) Mice with orthotopic PDAC tumors were treated with EIPA and/or gemcitabine. 27 days post-implantation, tumors were harvested and weighed. Data are shown as mean ± SEM; n(DMSO)=5; n(EIPA)=6; n(DMSO+Gem)=6; n(EIPA+Gem)=6. One-way ANOVA. **p<0.01, n.s., not significant. CI: combination index. (H and I) Representative images (H) and quantification (I) of anti-cleaved caspase-3 staining in KPC orthotopic tumors after treatment. Images were analyzed: DMSO, 56 fields (20x) from 5 tumors; EIPA, 67 fields (20x) from 6 tumors; DMSO+Gem, 57 fields (20x) from 5 tumors; EIPA+Gem, 70 fields (20x) from 6 tumors. Data are shown as mean ± SD, One-way ANOVA. ***p<0.001, n.s., not significant. Scale bar: 30 μm. (J and K) Representative images (J) and quantification (K) of anti-p53 staining in lungs. 25–30 fields (20x) for each group were analyzed. Data are shown as mean ± SD, One-way ANOVA. *p<0.05, ***p<0.001, n.s., not significant. Scale bar: 50 μm.

References

    1. Sahai E., Astsaturov I., Cukierman E., DeNardo D.G., Egeblad M., Evans R.M., Fearon D., Greten F.R., Hingorani S.R., Hunter T., et al. (2020). A framework for advancing our understanding of cancer-associated fibroblasts. Nature reviews. Cancer 20, 174–186. 10.1038/s41568-019-0238-1. - DOI - PMC - PubMed
    1. LeBleu V.S., and Kalluri R. (2018). A peek into cancer-associated fibroblasts: origins, functions and translational impact. Dis Model Mech 11. ARTN dmm02944710.1242/dmm.029447. - PMC - PubMed
    1. Caligiuri G., and Tuveson D.A. (2023). Activated fibroblasts in cancer: Perspectives and challenges. Cancer cell 41, 434–449. 10.1016/j.ccell.2023.02.015. - DOI - PMC - PubMed
    1. Biffi G., and Tuveson D.A. (2021). Diversity and Biology of Cancer-Associated Fibroblasts. Physiological reviews 101, 147–176. 10.1152/physrev.00048.2019. - DOI - PMC - PubMed
    1. Sherman M.H., and Beatty G.L. (2023). Tumor Microenvironment in Pancreatic Cancer Pathogenesis and Therapeutic Resistance. Annual review of pathology 18, 123–148. 10.1146/annurev-pathmechdis-031621-024600. - DOI - PMC - PubMed

Publication types

LinkOut - more resources