[Preprint]. 2025 Mar 17:2023.10.29.564555.
doi: 10.1101/2023.10.29.564555.

Co-regulator activity of Mediator of DNA Damage Checkpoint 1 (MDC1) is associated with DNA repair dysfunction and PARP inhibitor sensitivity in lobular carcinoma of the breast

Affiliations

Co-regulator activity of Mediator of DNA Damage Checkpoint 1 (MDC1) is associated with DNA repair dysfunction and PARP inhibitor sensitivity in lobular carcinoma of the breast

Joseph L Sottnik et al. bioRxiv. .

Abstract

Invasive lobular carcinoma of the breast (ILC) is typically estrogen receptor α (ER)-positive and presents with biomarkers of anti-estrogen sensitive disease, yet patients with ILC face particularly poor long-term outcomes with increased recurrence risk, suggesting endocrine response and ER function are unique in ILC. ER is co-regulated by the DNA repair protein Mediator of DNA Damage Checkpoint 1 (MDC1) specifically in ILC cells, driving distinct ER activity. However, this novel MDC1 activity is associated with dysfunctional canonical DNA repair activity by MDC1, but without typical features of DNA repair deficiency. To understand reciprocal activities of MDC1, we profiled the MDC1 interactome and found MDC1-associated proteins in ILC cells mirror a "BRCA-like" state lacking key homologous recombination (HR) proteins, consistent with HR dysfunction but distinct from classic "BRCAness". HR dysfunction in ILC cells is supported by single-cell transcriptome and DNA repair activity analyses, with DNA repair signaling and functional data, showing dysfunctional induction and resolution of HR. In parallel, ILC tumor data are consistent with a distinct form of HR dysfunction via impaired HR resolution, lacking BRCA-like genomic scarring but showing elevated signatures of PARP inhibitor sensitivity. We demonstrate this HR dysfunction can be exploited using PARP inhibition, and found that talazoparib treatment produced a durable growth suppression both in vitro and in multiple ILC xenografts in vivo. ILC-specific ER:MDC1 activity creates a new context for ER and MDC1 function in ILC, at the cost of a DNA repair dysfunction, which may be therapeutically targetable.

Keywords: DNA damage response; DNA repair; Invasive lobular carcinoma; MDC1; PARP inhibitors; breast cancer; estrogen receptor.


Figures
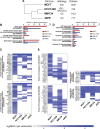
Figure 1.
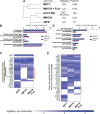
Figure 1.. MDC1 interactome in ILC cells mirrors a BRCA-mutant state.
(A) Hierarchical clustering (Pearson) of MDC1 associated proteins after filtering of RNA-processing related proteins. (B,D) Gene set enrichment against GO Biological Processes. Dashed line: adj. p = 0.05. (C,E) Mean IgG-subtracted intensity of duplicate IP/MS samples for proteins in indicated ontology groups.
Figure 2.
Figure 2.. ER inhibition with fulvestrant shifts MDC1 interactome toward a non-BCRA-mutant state.
(A) Hierarchical clustering (Pearson) of MDC1 associated proteins as in Figure 1A, with inclusion of MM134+Fulvestrant samples. (B,D) Gene set enrichment against GO Biological Processes. Dashed line: adj. p = 0.05. (C,E) Mean IgG-subtracted intensity of duplicate IP/MS samples for proteins in indicated ontology groups. Orange bar identifies IP/MS hits putative remodeled by fulvestrant treatment discussed in text.
Figure 3.
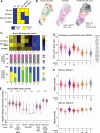
Figure 3.. Single cell transcriptome + Haircut data identifies reciprocal MDC1 co-regulator activity versus DNA repair activity.
(A) Schematic for predicted ER target gene expression based on dependence on MDC1, FOXA1, or neither factor. Based on RNAseq data from Sottnik & Bordeaux et al, 2021. (B) UMAP plot showing Seurat clusters (left), sample/treatment (center), and predicted cell cycle state (right). (C) Top, ER target gene scores in each of the 8 Seurat clusters. Single cell scores are a z-score of the relative expression of estrogen-induced and estrogen-repressed genes (see Supplemental File 2). Middle, per cluster fraction of cells from the –E2 vs +E2 samples. Bottom, per cluster distribution of predicted cell cycle state. Points represent individual cells. (D) Expression of homologous recombination genes (https://www.genome.jp/entry/hsa03440) from targeted capture panel. *, ANOVA adj.p <0.05 versus Cluster 1. Points represent individual cells. (E) Haircut assay from hairpin DNA repair substrates that require activity of the indicated enzymes for editing and sequence readout. ****, ANOVA adj.p <0.0001, –E2 vs +E2. Points represent individual cells. (F) Repair of the Abasic hairpin yields two outcomes; APE1-mediated incision at an abasic site is followed by processing by either Polβ (short-patch repair, Abasic.1 - top) or Polδ/β and FEN1 (long-patch repair, Abasic.2 - bottom). *, ANOVA adj.p <0.05 versus Cluster 5. Points represent individual cells.
Figure 4.
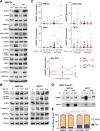
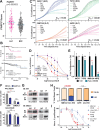
Figure 4.. Activation of HR is limited and delayed in MM134 (ILC) versus MCF7 (IDC) cells.
(A) MM134 cells treated with 10µM etoposide for 4 or 24 hours were analyzed by western blot for canonical interactors of MDC1 (yH2AX, ATM, and MRN) and down-stream mediators of canonical MDC1 signaling (CHK1/2, 53BP1, RAD51, and DNAPKcs). (B) Western blot comparison of MM134 (ILC) and MCF7 (IDC) for MDC1 interaction of downstream NHEJ (53BP1 and DNAPKcs) vs HR (Rad51) was performed. Increased turnover of RAD51 in MCF7 is suggestive of HR being used to repair etoposide induced double strand breaks. (C) Breast cancer cells were treated with a 4hr pulse of 10μM etoposide, or 4Gy ionizing radiation, and allowed to recover for 4 or 24hr prior to assessing RAD51 foci formation by immunofluorescence. Points represent foci counts in individual nuclei, read line represent median per condition. (D) Immunoprecipitation of MDC1 in MM134 and MCF7 cells treated with 10µM etoposide. Increased co-IP of RAD51 is observed in MCF7 but not MM134. (E) Traffic Light DNA repair reporter output from breast cancer cells. Bars represent mean ± SD form n=5 biological replicates. Red bar represents ANOVA p<0.05 for indicated comparison.
Figure 5.
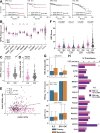
Figure 5.. Protein array data are consistent with DNA repair dysfunction in ILC tumors and cell lines.
mRNA, protein, and associated clinical data downloaded from cBio Portal (78), TCGA PanCan dataset; HRD feature data from (40). (A) Disease-free survival (DFS) and Overall Survival (OS) for Luminal A tumors with available RPPA data. Hi/Lo defined by total RPPA signal sum cutoff of 1. ILC RPPA Hi: DFS n=42, OS n=49; ILC RPPA Lo: DFS n=46, OS n=50; IDC RPPA Hi: DFS n=98, OS n=111; IDC RPPA Lo: DFS n=112, OS n=139. Log-rank test p-value shown. IDC curves are ended at 180mo but no survival events occurred >180mo. (B) Normalized RPPA signal shown per target. ILC n=99, IDC n=251. Blue line = median. *, Mann-Whitney with FDR < 5% (adj.p < 0.05). (C) RAD51 RPPA data, as in (B). (D) RAD51 mRNA expression. Mann-Whitney T-test p-value shown. (E) RPPA vs mRNA data from (C-D); Spearman correlation statistics shown. (F) Homologous recombination deficiency (HRD) scores, representative of other trends for DNA damage response signatures observed in Luminal A tumors in (40). ILC n=134; IDC n=315. Blue line = median. Mann-Whitney T-test p-value shown. (G) Tumor mutation analyses from Foundation Medicine cohort, details in text. ILC: primary, n=1653; metastatic, n-1535. ER+IDC: primary n=1087; metastatic, n=439. TMB and gLOH scores compared for ILC v IDC (combining primary + metastasis), Mann-Whitney U-test. HRDsig, by prevalence of HRDsig-positive status, compared by Fisher exact test, odds ratio for HRDsig-positive in ILC shown. (H) Prevalence of mutational signatures among ILC, per TMB status. TMB-high, n=459; TMB-low, n=2625; not assessable, n=351. *, Fisher exact test adj.p < 0.05.
Figure 6.
Figure 6.. ILC cells in vitro are sensitive to PARP inhibitor talazoparib.
(A) PARPi7 score from TCGA PanCancer analysis (40). ILC n=134; IDC n=315. Blue line = median. Mann-Whitney T-test p-value shown. (B) DFS from samples with PARPi7 score and survival data. ILC PARPi7 Hi, n=57; ILC PARPi7 Lo, n=62; IDC PARPi7 Hi, n=82; IDC PARPi7 Lo, n=188. Log-rank test p-value shown. IDC curves are ended at 180mo but no survival events occurred >180mo. (C) Representative growth curves via confluence in live cell imaging (Incucyte) for ILC vs IDC cells with increasing concentrations of talazoparib. IC50 calculated using percent confluence at 144hr post-treatment. Line represents mean confluence of 6 replicates ± SD. (D) Proliferation at 7d (168hr) as assessed by dsDNA quantification, shown as normalized % proliferation vs max/min. Points represent mean of 6 replicates ± SD. (E) Proliferation at 7d post drug washout (14d after initial treatment) by dsDNA quantification. Bars represent mean of 6 replicates ± SD. *, ANOVA, Ctrl v Tala p<0.05. (F) Proliferation at 7d as in (D-E) after siRNA transfection or indicated treatment. /A and /E designations indicate representative LTED sub-lines used in studies herein, from (51). (G) Reciprocal co-immunoprecipitation of MDC1 versus ERα (ER). Red boxes highlight ‘target’ co-IPs confirming ER:MDC1 association in 44:LTED/A, which is not enriched versus IgG control in 134:LTED/E. (H) Traffic Light reporter as in Figure 4E, data for parental cells replicated from Figure 4E for clarity. ANOVA p-value shown. (I) Proliferation at 7d with increasing talazoparib concentration, as above. Dose-response curves for parental cells from Figure 6B shown for clarity. *, IC50 comparison p<0.05.
Figure 7.
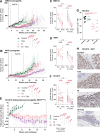
Figure 7.. Talazoparib causes sustained growth suppression in ILC xenograft tumors.
(A-B) Bold lines/symbols show mean tumor size ± SEM; individual tumor size shown as matching faded lines. Bold lines ended at first tumor size human endpoint reached per arm. Two-way ANOVA treatment effect p-values shown. (C-D) Tumor volume at treatment initiation vs completion for studies in (A-B). Red lines = tumor non-palpable at treatment completion; Black lines = increased tumor volume at treatment completion vs initiation. Paired ANOVA p-values shown. (E) Tumor growth shown as fold-change in tumor size versus treatment initiation. Bold/faded lines as above; two-way ANOVA includes all 20 tumors per treatment arm together. n.p. = non-palpable at measurement timepoint (volume = 0 for ANOVA). (F) Change in tumor volume for HCI-013 as in (C-D). (G) Ki67 quantification from tumors in (E,F); control and tala-treated tumors were collected asynchronously at humane tumor size endpoints. AI and AI+Tala-treated tumors represent the dashed-line cohort from (E); open symbol in AI+Tala was 0% Ki67+ but had <10 evaluable tumor cells in available sections, and is excluded from statistical comparisons. Non-parametric ANOVA shown; black line, p>0.05; red lines, p<0.05. (H) Representative Ki67 immunohistochemistry from tumors in (E,F,G), scale bar = 200μm; also see Supplemental Figure 9.

References

    1. Sikora MJ, Jankowitz RC, Dabbs DJ, Oesterreich S. Invasive lobular carcinoma of the breast: patient response to systemic endocrine therapy and hormone response in model systems. Steroids. 2013. Jun;78(6):568–575. - PubMed
    1. Mouabbi JA, Hassan A, Lim B, Hortobagyi GN, Tripathy D, Layman RM. Invasive lobular carcinoma: an understudied emergent subtype of breast cancer. Breast Cancer Res Treat. 2022. Jun;193(2):253–264. - PubMed
    1. McCart Reed AE, Kalinowski L, Simpson PT, Lakhani SR. Invasive lobular carcinoma of the breast: the increasing importance of this special subtype. Breast Cancer Res BCR. 2021. Jan 7;23(1):6. - PMC - PubMed
    1. Ciriello G, Gatza ML, Beck AH, Wilkerson MD, Rhie SK, Pastore A, et al. Comprehensive Molecular Portraits of Invasive Lobular Breast Cancer. Cell. 2015. Oct 8;163(2):506–519. - PMC - PubMed
    1. Rakha EA, El-Sayed ME, Powe DG, Green AR, Habashy H, Grainge MJ, et al. Invasive lobular carcinoma of the breast: response to hormonal therapy and outcomes. Eur J Cancer Oxf Engl 1990. 2008. Jan;44(1):73–83. - PubMed

Publication types