[Preprint]. 2024 Dec 2:2024.12.01.626286.
doi: 10.1101/2024.12.01.626286.

Optogenetically Induced Microtubule Acetylation Unveils the Molecular Dynamics of Actin-Microtubule Crosstalk in Directed Cell Migration

Affiliations

Optogenetically Induced Microtubule Acetylation Unveils the Molecular Dynamics of Actin-Microtubule Crosstalk in Directed Cell Migration

Abhijit Deb Roy et al. bioRxiv. .

Abstract

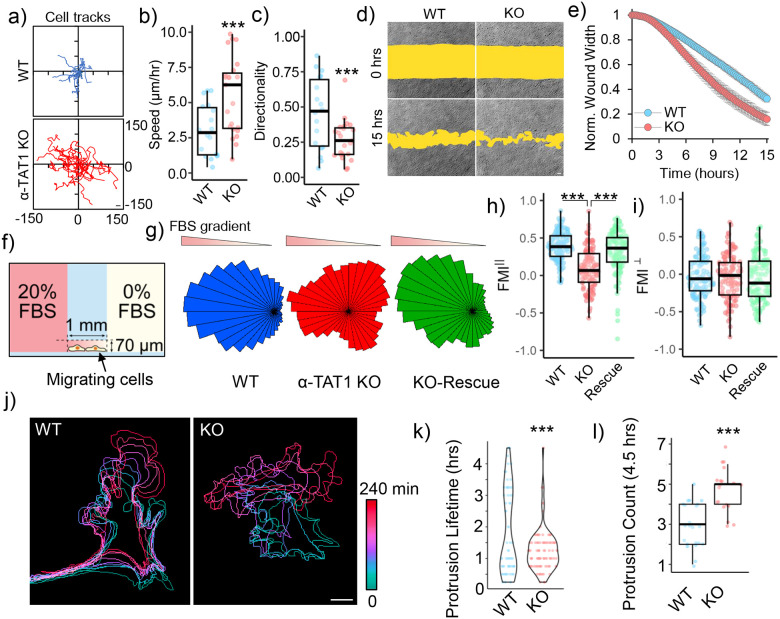
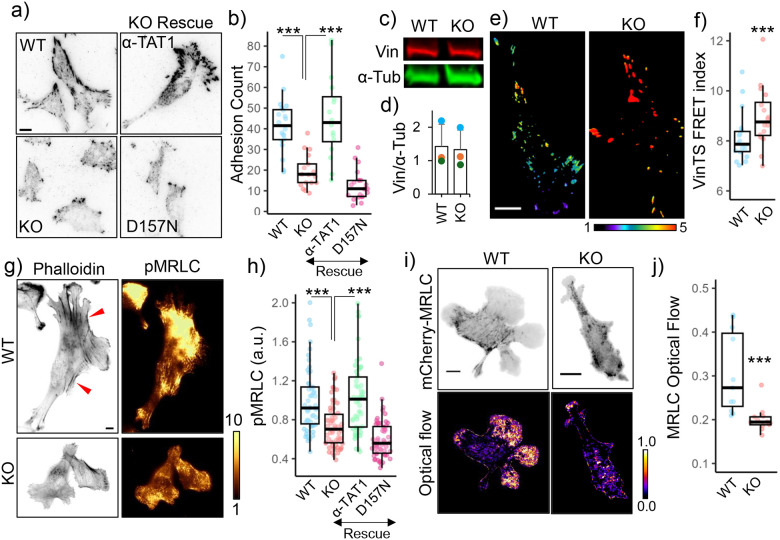
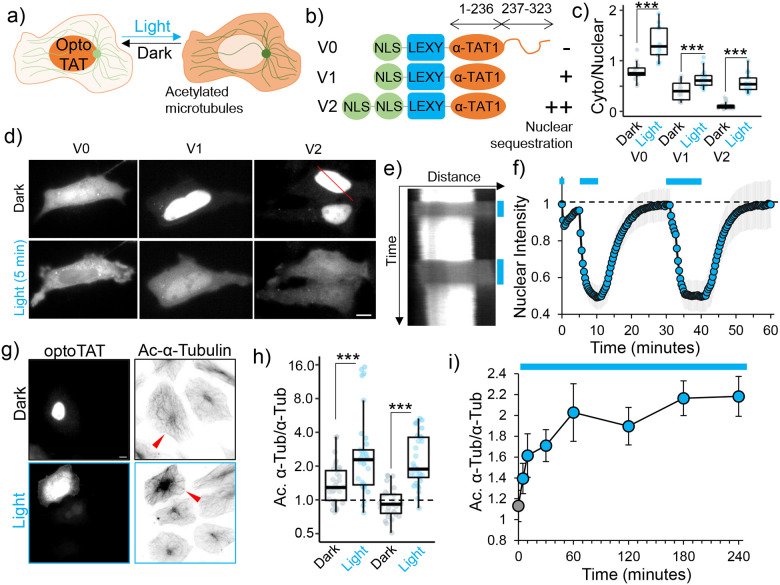
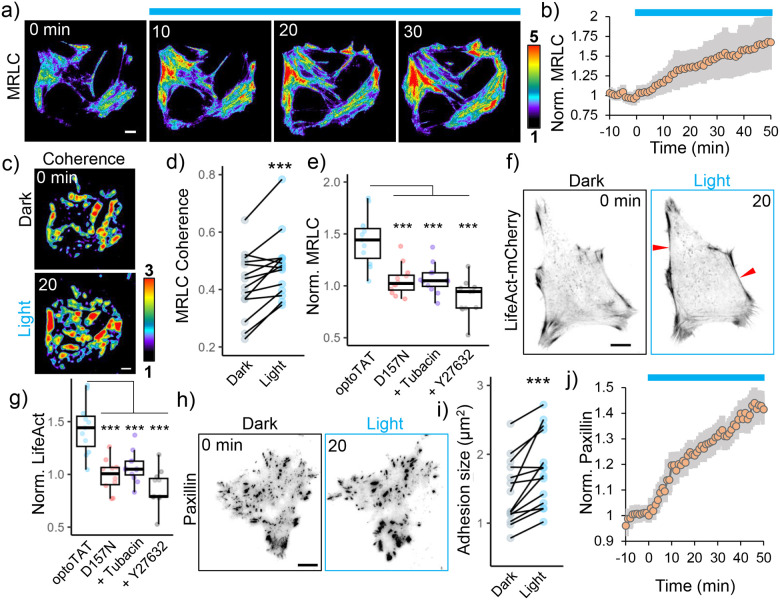
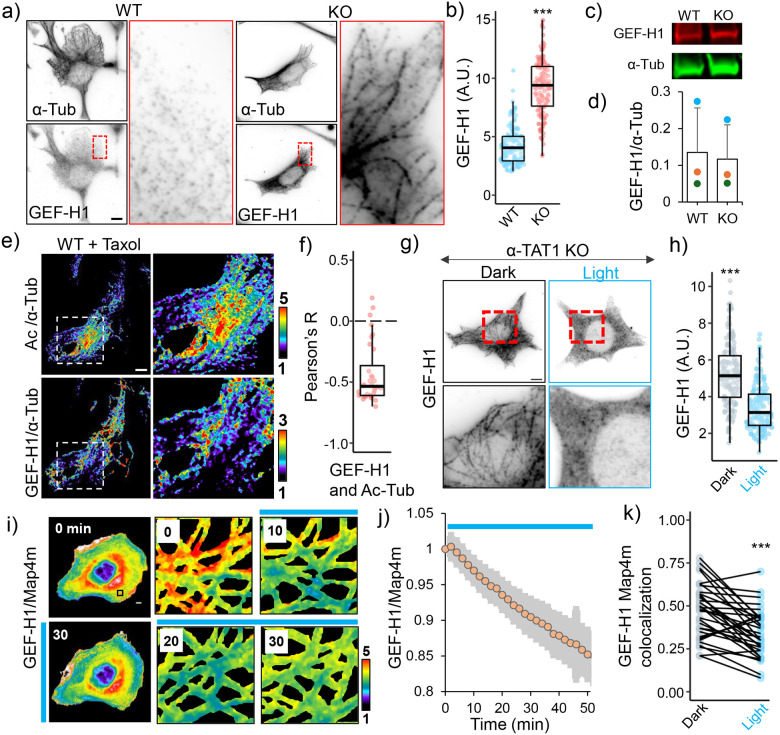
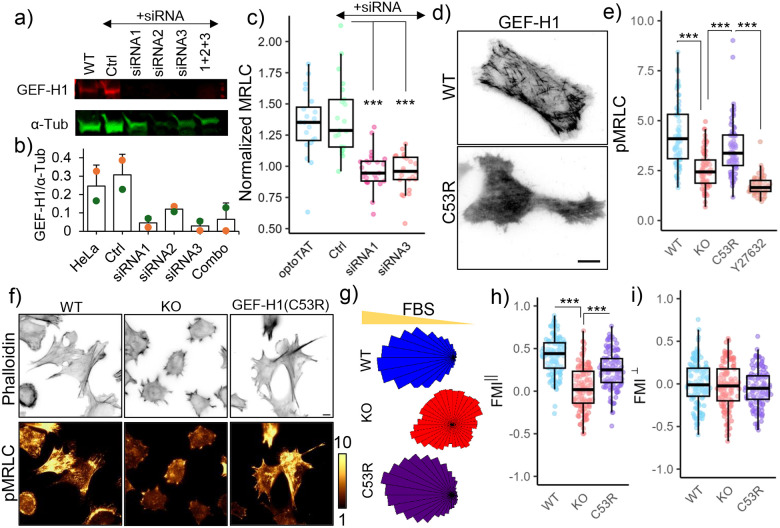
Microtubule acetylation is implicated in regulating cell motility, yet its physiological role in directional migration and the underlying molecular mechanisms have remained unclear. This knowledge gap has persisted primarily due to a lack of tools capable of rapidly manipulating microtubule acetylation in actively migrating cells. To overcome this limitation and elucidate the causal relationship between microtubule acetylation and cell migration, we developed a novel optogenetic actuator, optoTAT, which enables precise and rapid induction of microtubule acetylation within minutes in live cells. Using optoTAT, we observed striking and rapid responses at both molecular and cellular level. First, microtubule acetylation triggers release of the RhoA activator GEF-H1 from sequestration on microtubules. This release subsequently enhances actomyosin contractility and drives focal adhesion maturation. These subcellular processes collectively promote sustained directional cell migration. Our findings position GEF-H1 as a critical molecular responder to microtubule acetylation in the regulation of directed cell migration, revealing a dynamic crosstalk between the actin and microtubule cytoskeletal networks.


Conflict of interest statement

Competing Interests The authors declare that there is a pending patent application related to optoTAT.

Figures

Figure 1.
Figure 1.. α-TAT1 modulates directional cell migration.
a) Tracks, b) Speed (μm/hr) and c) Directionality of WT and α-TAT1 KO MEFs in a random migration assay, WT: 18, KO: 23 cells, scale bar: 10 μm; d), e) Temporal changes in wound width in a wound healing assay with WT and α-TAT1 KO MEFs, n = 12 wound regions from 3 independent experiments, mean ± 95% C.I.; f) Schematic for chemotaxis assay (adapted from Ibidi); g) Rose plots of WT, α-TAT1 KO or KO-rescue MEFs migrating in a chemotactic gradient, h) Forward migration indices along the chemotactic gradient and i) Forward migration indices perpendicular to the chemotactic gradient for WT, α-TAT1 KO or KO-rescue MEFs, n = 120 cells (40 each from three independent experiments); j) Temporal changes in morphology of WT or α-TAT1 KO MEFs undergoing random migration, scale bar: 10 μm; k) Persistence of protrusions, l) Frequency of new protrusion formations in randomly migrating WT or α-TAT1 KO MEFs, WT: 23 and KO: 19 cells. ***: p<0.001
Figure 2.
Figure 2.. Microtubule acetylation promotes focal adhesion maturation and actomyosin contractility.
a) Vinculin distribution in WT, α-TAT1 KO MEFs, and KO-rescue with mVenus-α-TAT1 or catalytic dead mVenus-α-TAT1(D157N) as indicated; b) Number of adhesions per cell (WT:20, KO: 17, rescue-WT: 16, rescue-D157N: 22 cells); c) western blot showing Vinculin and α-Tubulin expression in WT and α-TAT1 KO MEFs; d) Normalized Vinculin expression levels in WT and α-TAT1 KO MEFs by Western blots (3 independent experiments, error bar: standard deviation); e) VinTS FRET index in WT and α-TAT1 KO MEFs, f) Average VinTS FRET index in WT and α-TAT1 KO MEFs (WT:: 18, KO: 16 cells); g) Phalloidin and phospho-MRLC distribution in WT and α-TAT1 KO MEFs, red arrowheads indicate bundled actin; h) Phospho-MRLC levels in WT, α-TAT1 KO, rescue-WT and rescue-D157N MEFs (WT: 54, KO: 64, rescue-WT: 53 and rescue-D157N: 55 cells); i) mCherry-MRLC distribution and optical flow levels of mCherry-MRLC in WT and α-TAT1 KO MEFs; j) Mean mCherry-MRLC optical flow levels in WT and α-TAT1 KO MEFs (WT: 11, KO: 12 cells). Scale bar: 10 μm. ***: p<0.001
Figure 3.
Figure 3.. Developing an optogenetic actuator to induce microtubule acetylation.
a) OptoTAT design principle; b) OptoTAT versions; c) Ratio of cytoplasmic over nuclear signal for different versions of optoTAT in dark and on 10 min blue light stimulation (V0: 14, V1: 17 and V2: 21 cells); d) Changes in intracellular distribution of mCherry-optoTAT V0, V1 and V2 in dark and on blue light stimulation; e) Kymograph showing mCherry-optoTAT V2 response to blue light, reference for kymograph is the red line in top panel of (d); f) Temporal changes in average nuclear intensity of mCherry-optoTAT V2 on blue light stimulation indicated by blue lines, means ± 95% C.I. are shown, n= 21 cells; g) Microtubule acetylation levels in HeLa cells exogenously expressing mCherry-optoTAT V2, kept in dark or exposed to blue light for 2 hours, red arrowheads indicate transfected cells; h) Acetylated microtubule levels (normalized against total α-Tubulin) in HeLa cells expressing mCherry-optoTAT V1 or V2 in dark or exposed to 2 hours blue light, values were normalized against non-transfected cells in the same dish (V1 dark: 30, V1 light: 34, V2 dark: 27, V2 light: 33 cells); i) Temporal changes in levels of acetylated microtubules (normalized against total α-Tubulin) in HeLa cells stably expressing mVenus-optoTAT and continuously exposed to blue light stimulation for the duration indicated (0 min: 54, 5 min: 50, 10 min: 61, 30 min: 66, 60 min: 61, 120 min: 62, 180 min: 60 and 240 min: 61 cells), means ± 95% C.I. are shown. Scale bar: 10 μm.
Figure 4.
Figure 4.. OptoTAT stimulation rapidly induces actomyosin contractility.
a) TIRF images showing temporal changes in mCherry-MRLC distribution on miRFP703-optoTAT stimulation in HeLa cells; b) Changes in mCherry-MRLC intensity on miRFP703-optoTAT stimulation, mean ± 95% C.I. are shown, n = 14 cells, c), d) Changes in MRLC distribution isotropy on miRFP703-optoTAT stimulation, n = 14 cells; e) Changes in mCherry-MRLC intensity in TIRF plane on 30 min blue light stimulation of miRFP703-optoTAT (14 cells), catalytically dead miRFP703-optoTAT(D157N) (12 cells), miRFP703-optoTAT and pre-treatment with 2 μM Tubacin (12 cells) or 10 μM Y27632 (12 cells); f) Changes in LifeAct-mCherry on miRFP703-optoTAT stimulation, red arrowheads indicate bundled actin; g) Changes in LifeAct-mCherry intensity in TIRF plane on 30 min blue light stimulation of miRFP703-optoTAT (12 cells), catalytically dead miRFP703-optoTAT(D157N) (12 cells), miRFP703-optoTAT and pre-treatment with 2 μM Tubacin (12 cells) or 10 μM Y27632 (10 cells), h) Changes in mCherry-Paxillin on miRFP703-optoTAT stimulation, i) Changes in average focal adhesion sizes and j) changes in average mCherry-Paxillin intensity on 30 min miRFP703-optoTAT stimulation, mean ± 95% C.I. are shown, n = 14 cells. Scale bar: 10 μm. ***: p<0.001. Blue line: Blue light stimulation.
Figure 5.
Figure 5.. Microtubule acetylation releases GEF-H1 sequestration.
a) α-Tubulin and GEF-H1 localization in WT and α-TAT1 KO MEFs, inset for GEF-H1 is magnified on right; b) linear density of GEF-H1 along microtubules in WT and α-TAT1 KO MEFs (5 microtubules from 30 cells each, total 150); c), d) GEF-H1 expression levels in WT and α-TAT1 KO MEFs measured using western blots (3 independent experiments, error bar: standard deviation); e) Relative distributions of acetylated microtubules (top panel) and microtubule-bound GEF-H1 (bottom panel) in overnight 100 nM Taxol treated WT MEFs, inset magnified on the right panels; f) Pearson’s R value for spatial colocalization of acetylated microtubules and microtubule-bound GEF-H1 in Taxol treated WT MEFs, n = 33 cells; g) GEF-H1 localization in α-TAT1 KO MEFs stably expressing mVenus-optoTAT kept in dark or with 30 min blue light stimulation; h) linear density of GEF-H1 along microtubules in α-TAT1 KO MEFs stably expressing mVenus-optoTAT kept in dark or exposed to 30 min blue light stimulation (5 microtubules from 30 cells each, total 150); i) Changes in mCherry-GEF-H1/mVenus-MAP4m signal in HeLa cells expressing miRFP703-optoTAT on blue light stimulation, inset is magnified in the right panels; j) Temporal changes in mCherry-GEF-H1/mVenus-MAP4m on miRFP703-optoTAT stimulation, mean ± 95% C.I. are shown, n = 33 cells; k) Changes in colocalization of mCherry-GEF-H1 and mVenus-Map4m on miRFP703-optoTAT stimulation for 30 min, n = 33 cells. Scale bar: 10 μm. ***: p<0.001
Figure 6.
Figure 6.. GEF-H1 mediates microtubule acetylation dependent actomyosin contractility.
a), b) GEF-H1 knock-down in HeLa cells by siRNA; c) Changes in mCherry-MRLC intensity on miRFP703-optoTAT stimulation in HeLa cells with optoTAT (20 cells), scramble siRNA (21 cells), siRNA1 (25 cells) and siRNA3 (22 cells) against GEF-H1; d) TIRF images of HeLa cells expressing GFP-GEF-H1 (top panel) and mCherry-GEF-H1(C53R); e) Phospho-MRLC levels in WT (67 cells), α-TAT1 KO (69 cells), α-TAT1 KO MEFs expressing mCherry-GEF-H1(C53R) (67 cells) and same cells treated with 10 μM Y-27632 (60 cells); f) Phalloidin and phospho-MRLC distribution in WT, α-TAT1 KO MEFs and α-TAT1 KO MEFs expressing mCherry-GEF-H1(C53R); g) Rose plots of WT, α-TAT1 KO and KO-GEF-H1(C53R) MEFs migrating in a chemotactic gradient; g) Forward migration indices along the chemotactic gradient and h) Forward migration indices perpendicular to the chemotactic gradient for WT, α-TAT1 KO and KO-GEF-H1(C53R) MEFs, n = 120 cells (40 each from three independent experiments). Scale bar: 10 μm. ***: p<0.001

References

    1. Janke C. & Magiera M. M. The tubulin code and its role in controlling microtubule properties and functions. Nat. Rev. Mol. Cell Biol. 21, 307–326 (2020). - PubMed
    1. L’Hernault S. W. & Rosenbaum J. L. Chlamydomonas alpha-tubulin is posttranslationally modified by acetylation on the epsilon-amino group of a lysine. Biochemistry 24, 473–478 (1985). - PubMed
    1. Piperno G. & Fuller M. T. Monoclonal antibodies specific for an acetylated form of alpha-tubulin recognize the antigen in cilia and flagella from a variety of organisms. J. Cell Biol. 101, 2085–2094 (1985). - PMC - PubMed
    1. LeDizet M. & Piperno G. Identification of an acetylation site of Chlamydomonas alpha-tubulin. Proc. Natl. Acad. Sci. U. S. A. 84, 5720–5724 (1987). - PMC - PubMed
    1. Diggins M. A. & Dove W. F. Distribution of acetylated alpha-tubulin in Physarum polycephalum. J. Cell Biol. 104, 303–309 (1987). - PMC - PubMed

Publication types

LinkOut - more resources