[Preprint]. 2024 Dec 6:2023.11.23.568398.
doi: 10.1101/2023.11.23.568398.

Identification of potential riboswitch elements in Homo Sapiens mRNA 5'UTR sequences using Positive-Unlabeled machine learning

Affiliations

Identification of potential riboswitch elements in Homo Sapiens mRNA 5'UTR sequences using Positive-Unlabeled machine learning

William S Raymond et al. bioRxiv. .

Update in

Abstract

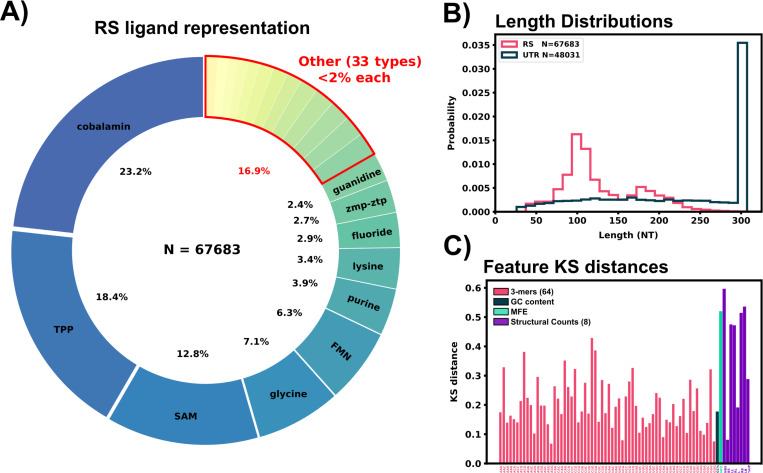
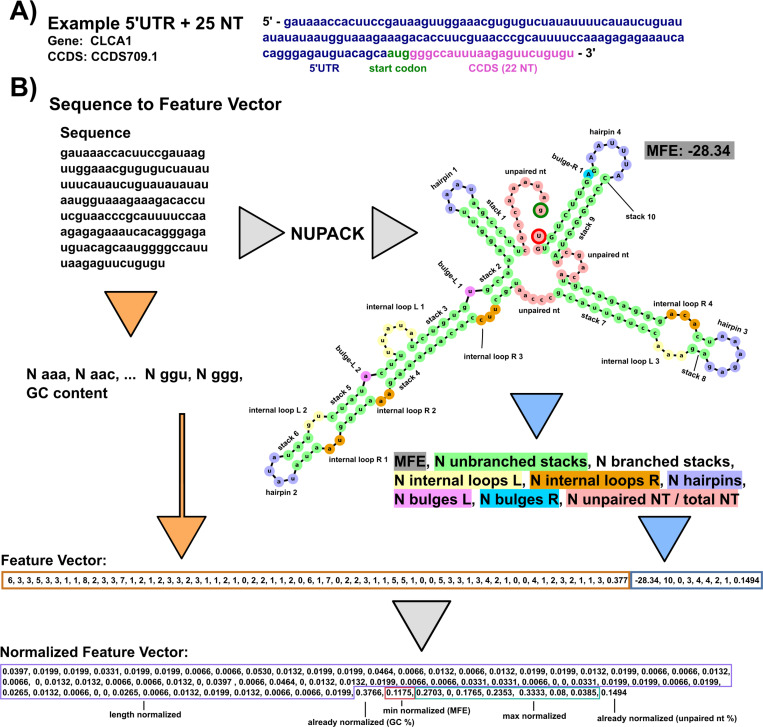
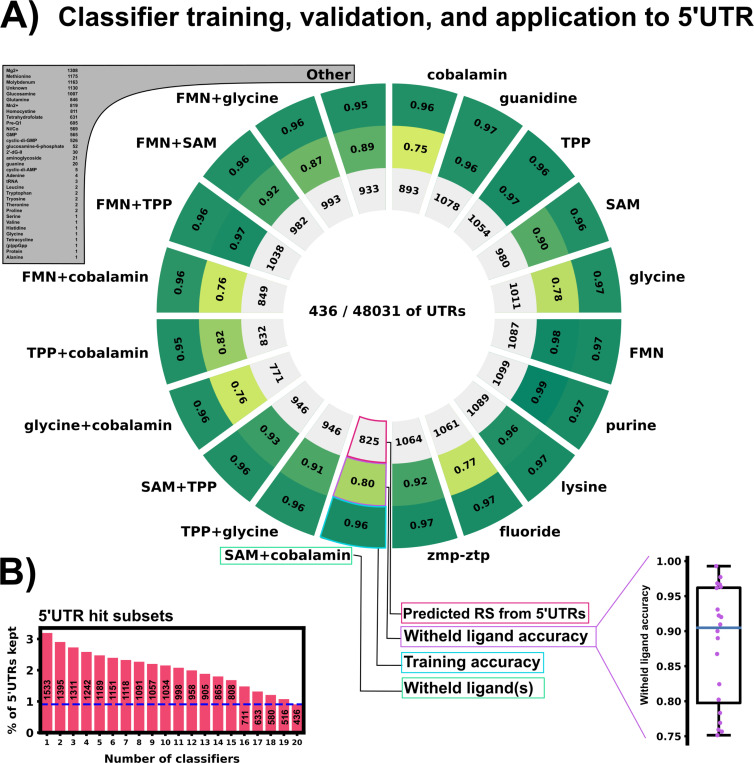
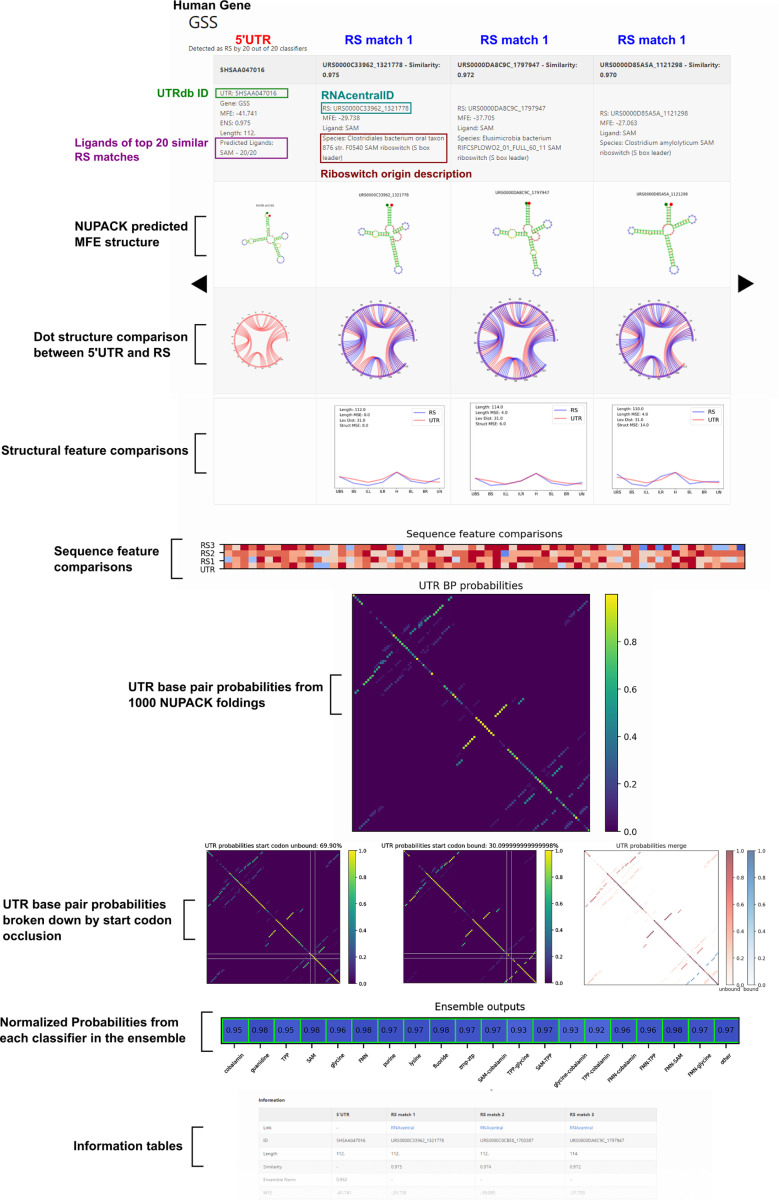
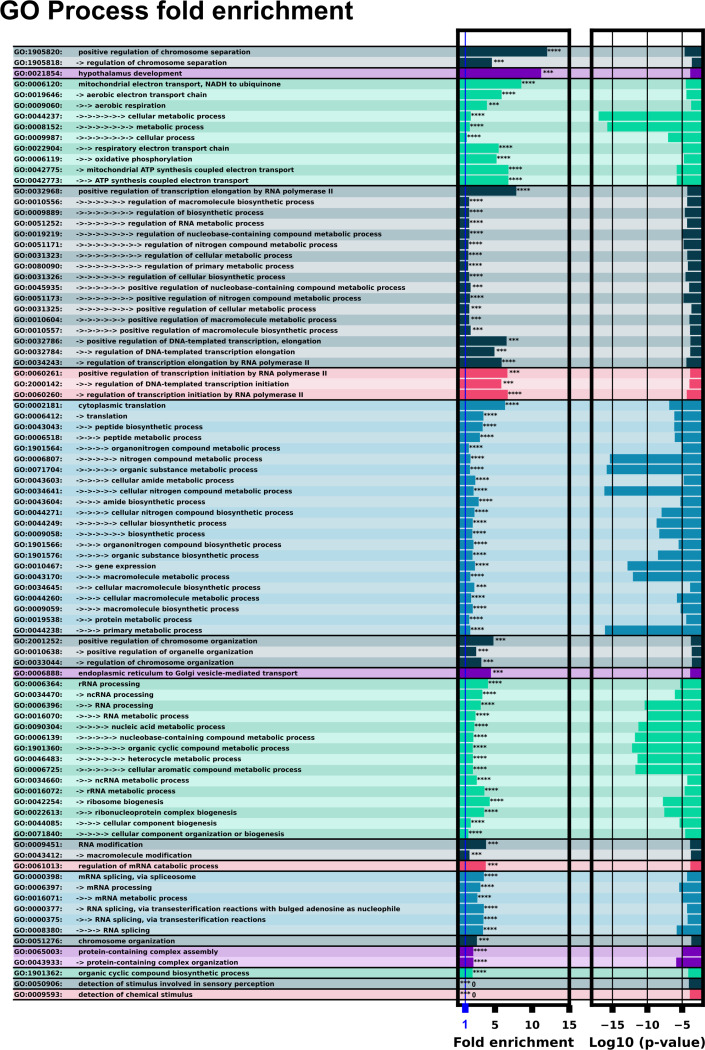
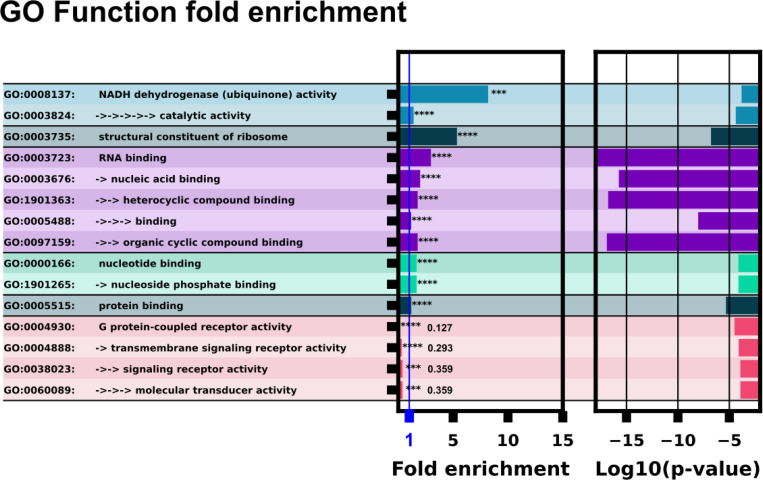
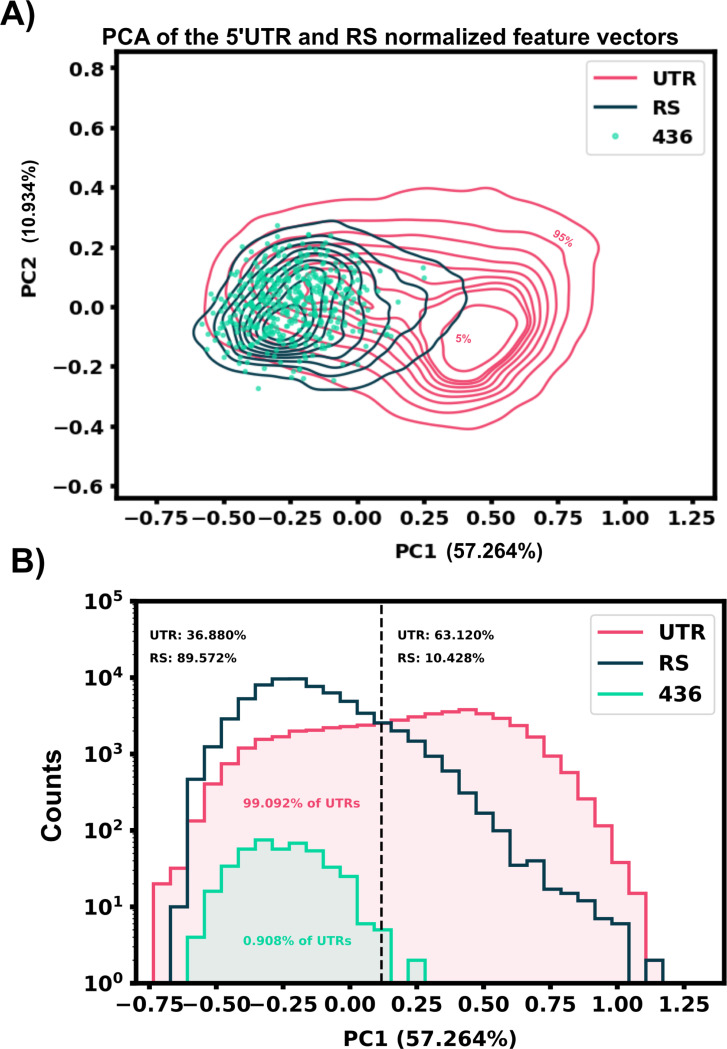
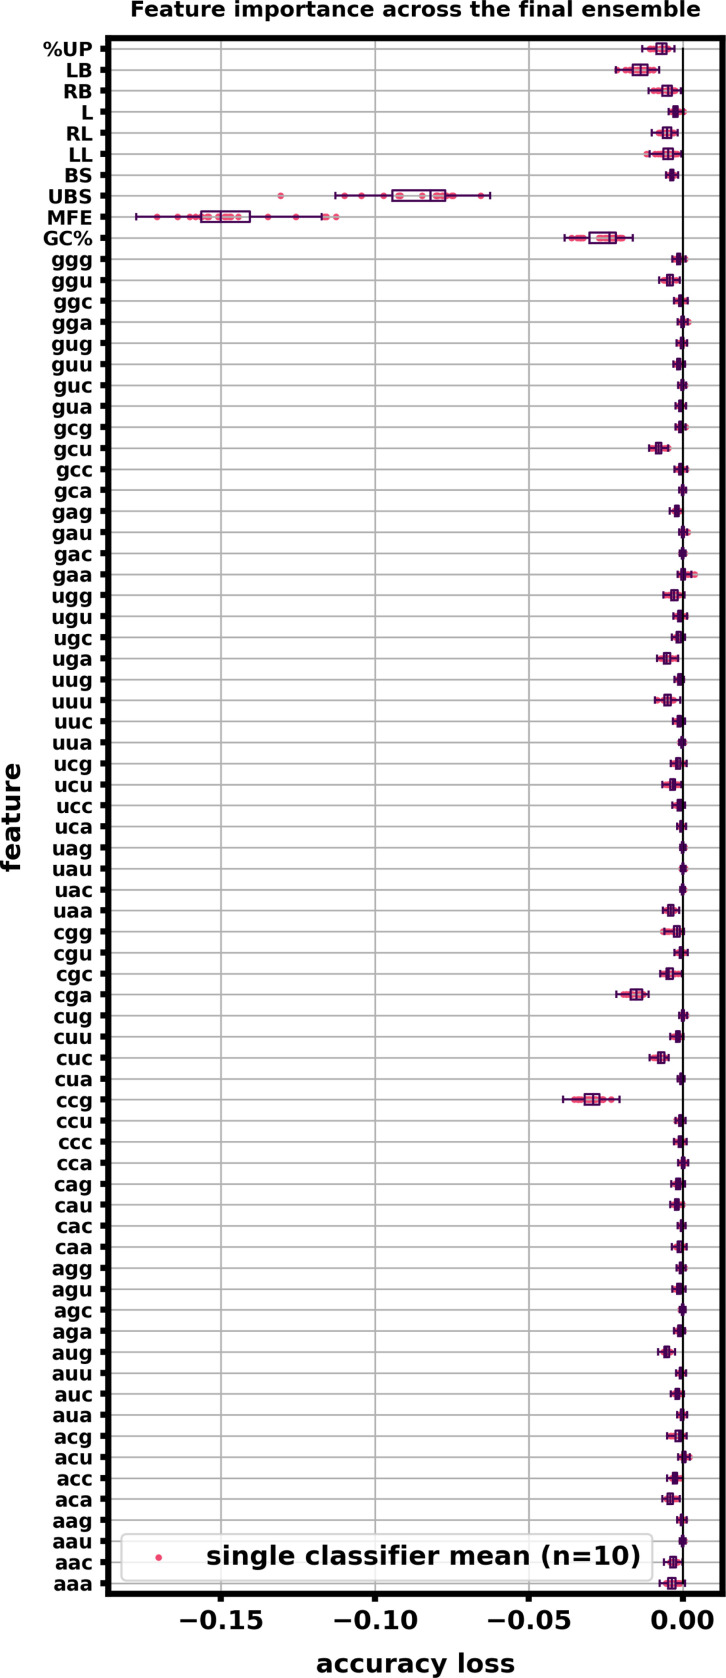
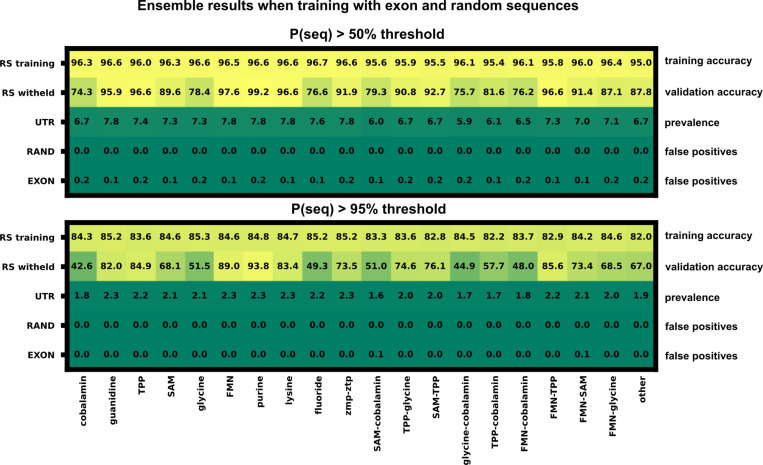
Riboswitches are a class of noncoding RNA structures that interact with target ligands to cause a conformational change that can then execute some regulatory purpose within the cell. Riboswitches are ubiquitous and well characterized in bacteria and prokaryotes, with additional examples also being found in fungi, plants, and yeast. To date, no purely RNA-small molecule riboswitch has been discovered in Homo Sapiens. Several analogous riboswitch-like mechanisms have been described within the H. Sapiens translatome within the past decade, prompting the question: Is there a H. Sapiens riboswitch dependent on only small molecule ligands? In this work, we set out to train positive unlabeled machine learning classifiers on known riboswitch sequences and apply the classifiers to H. Sapiens mRNA 5'UTR sequences found in the 5'UTR database, UTRdb, in the hope of identifying a set of mRNAs to investigate for riboswitch functionality. 67,683 riboswitch sequences were obtained from RNAcentral and sorted for ligand type and used as positive examples and 48,031 5'UTR sequences were used as unlabeled, unknown examples. Positive examples were sorted by ligand, and 20 positive-unlabeled classifiers were trained on sequence and secondary structure features while withholding one or two ligand classes. Cross validation was then performed on the withheld ligand sets to obtain a validation accuracy range of 75%-99%. The joint sets of 5'UTRs identified as potential riboswitches by the 20 classifiers were then analyzed. 15333 sequences were identified as a riboswitch by one or more classifier(s) and 436 of the H. Sapiens 5'UTRs were labeled as harboring potential riboswitch elements by all 20 classifiers. These 436 sequences were mapped back to the most similar riboswitches within the positive data and examined. An online database of identified and ranked 5'UTRs, their features, and their most similar matches to known riboswitches, is provided to guide future experimental efforts to identify H. Sapiens riboswitches.


Conflict of interest statement

Conflict of Interest Statement The authors declare the absence of any commercial or financial relationships that could be construed as a conflict of interest for this research.

Figures

Figure 1:
Figure 1:. Riboswitch ligand representation, training data comparisons, and feature extraction of sequence data.
A: Ligand representation within the riboswitch training data (RS). 43 different ligands are represented with 10 ligands having greater than 2% representation in the data set. B: Length distributions for the sanitized 5’UTR and RS data set. C: KS distances between the 5’UTR and RS data set for all extracted features are shown in the bottom panel.
Figure 2:
Figure 2:. Example feature extraction of sequence data.
A: Example 5’UTR sequence from the data set containing the start codon and 22 downstream nucleotides (25 total). B: Annotated example of taking an RNA sequence and converting it to a normalized feature vector for our positive-unlabeled learning. For sequence-based features, the sequence is converted into a 3-mer frequency and GC content is calculated. 3-mer frequency is normalized by the number of 3-mer subsets in the sequence (sequence length - 2). Secondary structure based features are generated by passing the sequence through NUPACK. MFE and structural features are extracted from the dot structure. Counts of hairpins, internal loops, bulges, and contiguous stacks (with and without branches) are extracted and max normalized across all the entire data set. Left (L) and right (R) designation corresponds to the 5’ to 3’ direction and 5’ to 3’ direction within a base pair stack respectively. MFEs are min-normalized across the data set. The final structural feature considered for learning is the percentage of unpaired nucleotides in the structure. The final output is a vector of length 74 normalized from 0–1.
Figure 3:
Figure 3:. Training and validation results of 20 PU classifiers.
A: Training and validation results. Each slice represents one PUlearn Elkanoto-classifier trained on a data set withholding one or two ligand-specific riboswitches. The outer ring shows the training accuracy on only positive examples (RS). The middle ring is the validation accuracy on the withheld riboswitch(es) of a particular ligand(s) class. The inner ring shows number of the predicted positive labeled 5’UTR sequences out of the 48,031 5’UTR sequences. The sub-panel on the bottom right shows the withheld validation accuracy (rounded to 2 digits) in a box plot. 436 5’UTRs were selected by all 20 classifiers as positive labeled – potentially harboring riboswitch-like features. B: 5’UTR hit subsets detected by varying numbers of classifiers (1 – 20, full sequences).
Figure 4:
Figure 4:. Ensemble training results when retrained with length normalized Homo Sapiens exon sequences and random nucleotide sequences.
The blue highlighted box represents the sequences labeled as riboswitches with an output threshold of 0.5, the red box displays a stricter threshold of 0.95. Percentages reported are the average percentage across the 20 classifiers inside the ensemble.
Figure 5:
Figure 5:. 5’UTR Sub-sequence exploration.
A: For each 5’UTR sequence, 20 evenly-spaced sub-sequences were generated after the first 30 nucleotides in the 3’−5’ direction, ensuring the start codon is in all sub-sequences. The relative size of each sub-sequence as a bar chart below the x-axis. For all 5’UTRs in the data set, variable-length sub-sequences were passed through the ensemble classifier to obtain the riboswitch probability. The riboswitch ensemble probability is plotted for each 5’UTR sub-sequence vs. the fraction of the sub-sequence to total 5’UTR length (thin blue lines). The thick dark blue line represents the average ensemble probability for that particular sub-sequence bin. C: Same as A, but only for the 5’UTRs whose full sequences were classified as ≥95% riboswitch by the ensemble. Many 5’UTR sequences such as AUH are classified as a riboswitch until almost 80% of the original sequence is removed. In contrast, some sequences such as ATF1 are no longer considered a riboswitch once 10% of the sequence is removed from the 5’ end. Once again the thick dark line represents the average probability of each sub-sequence bin. C: To find sub-sequences not included in the 436 hits, 5’UTR sequences not detected as a riboswitch by the full sequence but were detected as ≥95% riboswitch in 5 or more sub-sequence bins were selected. These 1210 5’UTR sequences and their sub-sequence ensemble probabilities are plotted vs sub-sequence fraction. 1210 sequences could be included as potential riboswitch hits by removing some amount of 5’ end nucleotides.
Figure 6:
Figure 6:. Example 5’UTR hit display from the website
The display website (https://will-raymond.github.io/human_riboswitch_hits_gallery/_mds/GSS/) provides information on a given 5’UTR detected by the ensemble as a potential riboswitch. Alongside each 5’UTR sequence, information on the top three riboswitch JSim matches to the 5’UTR are displayed in each column. First row provides information on a given sequence, UTRdb or RS id, source species, and MFE of the predicted structure. The next row displays the NUPACK predicted MFE secondary structure for each sequence. Below that are chord plots representing the bonded base pairs for each RS sequence overlapping the 5’UTR chord plot. The next row shows the normalized structural feature vector comparison for structure counts for the 5’UTR and a given RS. JSim is reported in these plots. UTR base pair probabilities from 1000 NUPACK foldings of the 5’UTR sequence are shown as a heat map to show multiple potential structures or conformers. Ensemble outputs of each of the 20 classifiers are shown as the last graph before the information tables. Additional information such as the dot structure, origin sequence, and counts of structural features are presented in the information tables below the comparison plots.
Figure 7:
Figure 7:. GO process analysis with ID’s and terms.
The left column lists the GO ID and term. Multiple arrows indicate GO term sub-levels. The left bar chart shows fold enrichment for that GO term with significance indicator. The second bar chart shows the log space of P-value significance for each enrichment.
Figure 8:
Figure 8:. GO function analysis with ID’s and terms.
The left column lists the GO ID and term. Multiple arrows and indents indicate GO term sub-levels. The left bar chart column shows fold enrichment for that GO term with significance indicator. The second bar chart shows the log space of p-value significance for each GO term.
Figure 9:
Figure 9:. Principal component analysis results of our extracted features do not separate easily.
A) The selected 5’UTR hits (436) heavily overlap with the riboswitch data set principal components. B) Histogram view of the PCA of both data sets along principal component 1.
Figure 10:
Figure 10:. Feature importances averaged across the ensemble indicate that specific nucleotide triplets and structural features are key for classification accuracy.
5000 random 5’UTR examples and 5000 random RS examples were used to compute feature importances by scrambling each feature randomly 10 times and calculating the accuracy loss. Features were scrambled one at a time. This calculation was done using sklearn’s permutation_importance function. Box plots of the accuracy loss across the entire ensemble were constructed with the entire output results (10 runs by 20 classifiers by 74 features). Individual dots represent the average accuracy loss of one of the twenty classifiers across its 10 scrambled runs. Mean Free Energy (MFE) and Unbranched stacks (UBS) as well as GC% had a marked decrease in ensemble performance when scrambled; Structural features also tended to be considered more important that most of the sequence features. Certain sequence triplets such as CCG, CGA, GGU, and CUC also were shown to be important nucleotide triplets to our ensemble.
Figure 11:
Figure 11:. Ensemble training with exon and random sequences broken down by classifier.
A secondary ensemble was trained using presumed riboswitch negative sequences (random and exon). The false positive rate for each of the 20 classifiers is shown for two output selection thresholds, 0.5 and 0.95.

Similar articles

References

    1. Abreu-Goodger C. and Merino E.. RibEx: a web server for locating riboswitches and other conserved bacterial regulatory elements. Nucleic Acids Research, 33:W690, July 2005. URL: https://www.ncbi.nlm.nih.gov/pmc/articles/PMC1160206/, doi:10.1093/NAR/GKI445. - DOI - PMC - PubMed
    1. Ali S. D., Tayara H., and Chong K. T.. Identification of piRNA disease associations using deep learning. Computational and Structural Biotechnology Journal, 20:1208–1217, January 2022. doi:10.1016/J.CSBJ.2022.02.026. - DOI - PMC - PubMed
    1. Amin N., McGrath A., and Chen Y. P. P.. Evaluation of deep learning in non-coding RNA classification. Nature Machine Intelligence, 1:246–256, May 2019. URL: https://www.nature.com/articles/s42256-019-0051-2, doi:10.1038/s42256-019-0051-2. - DOI
    1. Antunes D., Jorge N. A., Caffarena E. R., and Passetti F.. Using RNA sequence and structure for the prediction of riboswitch aptamer: A comprehensive review of available software and tools. Frontiers in Genetics, 8:231, January 2018. doi:10.3389/FGENE.2017.00231/BIBTEX. - DOI - PMC - PubMed
    1. Ashburner M., Ball C. A., Blake J. A., Botstein D., Butler H., Cherry J. M., Davis A. P., Dolinski K., Dwight S. S., Eppig J. T., Harris M. A., Hill D. P., Issel-Tarver L., Kasarskis A., Lewis S., Matese J. C., Richardson J. E., Ringwald M., Rubin G. M., and Sherlock G.. Gene Ontology: tool for the unification of biology NIH public access author manuscript. Nature Genetics, 25:25–29, May 2000. doi:10.1038/75556. - DOI - PMC - PubMed

Publication types

LinkOut - more resources