[Preprint]. 2025 May 9:2024.12.03.626590.
doi: 10.1101/2024.12.03.626590.

RNA-programmable cell type monitoring and manipulation in the human cortex with CellREADR

Affiliations

RNA-programmable cell type monitoring and manipulation in the human cortex with CellREADR

Elizabeth A Matthews et al. bioRxiv. .

Update in

Abstract

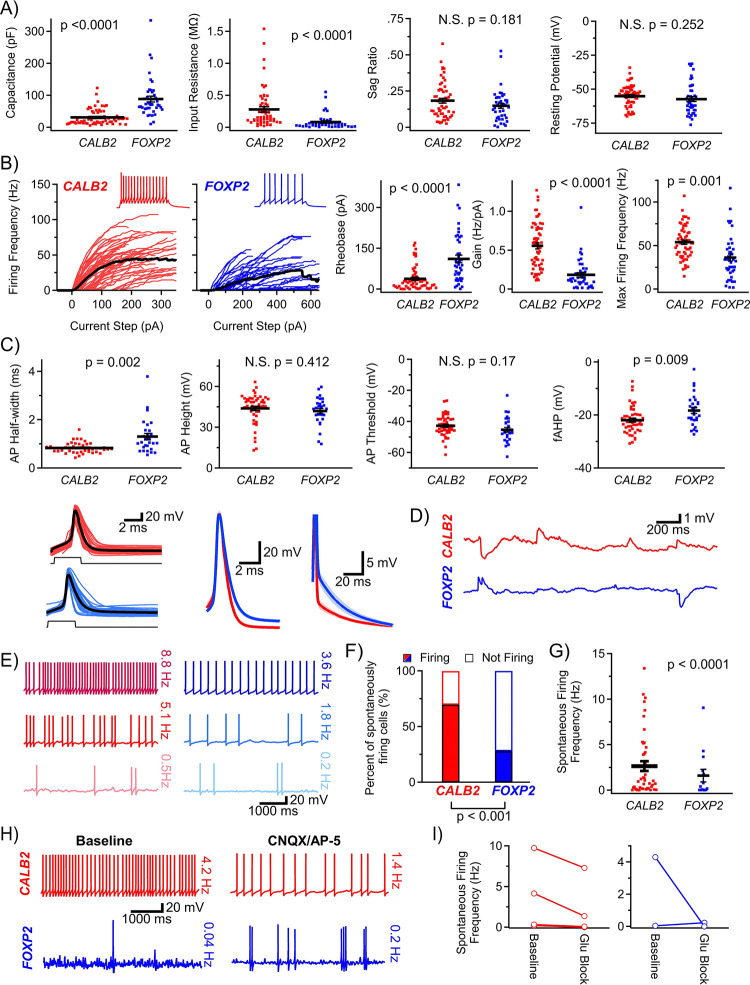
Reliable and systematic access to diverse cell types is necessary for understanding the organization, function, and pathophysiology of human neural circuits. Methods for targeting human neural populations are scarce and currently center on identifying transcriptional enhancers and engineering viral capsids. Here we demonstrate the utility of CellREADR, a programmable RNA sensor-effector technology that couples cellular RNA sensing to effector protein translation, for accessing, monitoring, and manipulating specific neuron types in human cortex, ex vivo. We designed CellREADRs to target two subpopulations, CALB2 GABAergic interneurons and FOXP2 glutamatergic projection neurons, then validated targeting specificity using histological, electrophysiological, and transcriptomic methods. CellREADR expression of channelrhodopsin and GCamp enabled the manipulation and monitoring of these populations in live cortical microcircuits. By demonstrating specific, reliable, and programmable experimental access to human neuronal subpopulations, our results highlight CellREADR's potential for studying neural circuits and treating brain disorders.

Keywords: Human neuroscience; PatchSeq; RNA sensor; calcium imaging; cellular access; cortex; excitatory neuron; interneuron; optogenetics; organotypic slice culture.


Conflict of interest statement

DECLARATION OF INTERESTS Z.J.H. has filed patents for CellREADR (US patent #: PCT/US22/79004 & PCT/US22/7900). Z.J.H is a co-founder of Doppler Bio. All other authors have no conflicts of interest to declare.

Figures

Figure 1.
Figure 1.. Deploying CellREADR to target RNA-defined cell types in ex vivo human cortex
(A) Human organotypic slice model. Human neocortical tissue specimens (here, middle and inferior temporal gyri; left) were sectioned into 350 μm slices and cultured on semi-permeable membranes for up to 16 days in vitro (DIV; right). CellREADR AAV vectors were directly applied to slices on DIV 0. Orientation: A, anterior; D, dorsal; P, posterior; V, ventral. (B) Schematic of CellREADR design. In the single virus design (left), binding of the sensor RNA sequence to the target leads to ADAR-mediated editing of a stop codon positioned between the sensor and the effector, leading to expression of the downstream effector (here, mNeon). The binary system (right) uses a CellREADR virus (top right) to drive expression of tTA2 (Tet-Advanced transactivator) in the target cell. A reporter virus, designed to conditionally express a selected effector molecule (e.g. mNeon, ChIEF, GCamp7f, depending on experiment) under control of the Tet-Responsive Element (TRE), is co-applied. (C) CellREADR targeting of diverse neuronal populations. Binary CellREADRs (mNeonGreen reporter) designed against Somatostatin (SST), Unc-5 netrin receptor B (UNC5B), Parvalbumin (PVALB), Forkhead box protein P2 (FOXP2), and Calretinin (CALB2) were applied to slices of human neocortex from at least 3 donors. Slices were immunostained for mNeon at 7 DIV. The CellREADR binary system led to robust expression of mNeon in differing laminar distributions and in cells of various morphologies. Dashed red boxes highlight the area depicted in the accompanying magnified image; pia and white matter (WM) are illustrated with dotted lines. Scale bars: 200 μm in large image and 50 μm in magnified image (D) Histological analysis of binary FOXP2 and CALB2 CellREADR targeting. CellREADR mNeon distribution (green, left) and protein expression of target (purple, middle) are depicted at DIV 7. The fluorescence intensity profile to the far left of each image set reveals the distribution of cells targeted by the CellREADR. Dashed red boxes indicate areas depicted in (F); pia and white matter (WM) are illustrated with dotted lines. Scale bars: 200 μm (E) Localization of CellREADR-targeted cells. CellREADR mNeon fluorescence intensity profiles measured across the depth of the cortex (0% depth = pial surface, 100% depth = white matter boundary) averaged from 6 slices (tissues from 3 donors). The solid line shows the mean and the shaded area shows the SEM. FOXP2-mNeon was relatively uniform throughout cortical layers, while CALB2-mNeon was more restricted to outer layers. (F) Immunohistochemical characterization of CellREADR specificity. Representative images showing colocalization of CellREADR-mNeon with the corresponding target. Scale bars: 50um (G) Quantification of CellREADR specificities, as measured by immunostaining. Each point denotes the specificity of labeling measured from an individual donor’s tissue (FOXP2 n=5 donors; Binary CALB2 n=7, Singular CALB2 n=3). Horizontal bars indicate mean specificity values for each CellREADR. Throughout figures, data are presented as mean ± SEM. (H) Benchmarking of CellREADR efficiency with a human interneuron enhancer virus DLX2.0-YFP. CALB2 CellREADR and DLX2.0-YFP viruses (rAAV2-retro) were applied to slices cut sequentially from the same neocortical tissue specimen. Tissue was fixed at 7 DIV and immunostained against mNeon or YFP. Slice boundaries are indicated by the solid white line, and the white matter is demarcated by a dashed white line; boxes mark the inset images below. Scale bars: upper images 1 mm, lower images 200 μm (I) Localization of DLX2.0-YFP expression. Representative image illustrating the efficiency and distribution of cellular labeling achieved with a DLX2.0-YFP virus (left), with fluorescence intensity profile (right; averages are from tissues collected from 3 donors) illustrating distribution of cells labeled by the virus. As compared to CALB2 CellREADR labeling (Figures 1D and 1H), DLX2.0-YFP+ cells were less concentrated in the outer cortex, as would be expected for pan-interneuron targeting by DLX2.0. Scale bar: 250 μm (J) DLX2.0-YFP targeting of the CALB2 population. Quantification of colocalization of DLX2.0-YFP expression and CALB2, as measured by immunostaining (images not shown); note inter-subject variability in targeting of CALB2 cells (n=7 donors). (K) Efficiency of binary and singular CALB2 CellREADRs compared to DLX2.0-YFP enhancer virus. Quantification of cells labeled at DIV 7, per unit area (Binary CALB2, n=6 donors, Singular CALB2, n=3, DLX2.0-YFP, n=3). Note, although the CellREADRs were designed to target only CALB2 interneurons, rather than multiple subclasses interneurons (as expected for DLX2.0), they labeled more cells (1-way ANOVA with Tukey’s post hoc).
Figure 2:
Figure 2:. PatchSeq validation of CALB2 CellREADR targeting
(A) Reference gene expression profiles of human MTG interneurons described in a prior study. CALB2 expression is largely restricted to VIP subclass interneurons, indicating that CALB2 READR is expected to primarily target VIP interneurons. Of the 19 CALB2 READR-targeted cells studied by PatchSeq here, all but 1 cell mapped transcriptomically to the VIP subclass (the transcriptomic types of the 19 cells are listed at right; number indicates count of cells mapped to that type) according to the classification scheme adapted from Tasic et al. and Hodge et al.. (B) Expression of selected genes in CALB2 READR cells. CALB2 transcripts were detected in all but 1 cell, which was mapped onto the SST subclass (SST KLDHC8A). READR-targeted cells rarely expressed canonical markers of interneuron subclasses other than VIP (e.g., LAMP5, SST, PVALB). Interestingly, 5 of the 6 cells that mapped to the PAX6 SYT6 type expressed the SLC17A7 (vesicular glutamate transporter 1), which is expressed widely across human MTG glutamatergic populations (Supplemental Figure 2A); these cells also expressed the GABAergic marker, GAD1. (C) PatchSeq electrophysiological measures of CALB2 READR-targeted neurons. Input-output curves illustrate the variation in rheobase, gain, and maximum firing frequency across the sampled population. The interrelationship between gene expression and physiological properties is further illustrated in Supplemental Figure 3. (D) Variation in electrophysiological properties across and within interneuron transcriptomic types. Membrane responses to depolarizing and hyperpolarizing currents from cells that were mapped to the same transcriptomic types. Cells that mapped to the PAX6 SYT6 type exhibited variation in the frequency and accommodation of action potential firing and also exhibited varying responses to hyperpolarization. Scale bars: 20 mV, 200 ms (E) Morphologies of CALB2 READR-targeted cells from the PatchSeq subset. The positions (within cortical mantle) of reconstructed neurons are illustrated at top. Blue circles indicate locations of the cell somata (not to scale), black profiles indicate the vertical and horizontal densities of cell dendrites, and red profiles indicate the vertical and horizontal densities of cell axons. Cortical depth is indicated on the left vertical axis; average cortical layer boundaries are shown on the right vertical axis. Complete cell tracings are shown at bottom. Supplemental Figure 5 shows the morphologies of additional CALB2- and FOXP2-targeted cells. Scale bars: 200 μm
Figure 3:
Figure 3:. CALB2- and FOXP2-targeted neurons exhibit distinct physiological profiles and spontaneous activities
(A) Passive membrane properties of cells targeted by CALB2 (n=60 cells) and FOXP2 CellREADRs (n=43). Membrane capacitance and input resistance, but not hyperpolarizing sag ratio or resting membrane potential, differed statistically between the two target populations. Black bars indicate mean and SEM (Mann-Whitney U-test for non-normal distributions, t-test for normal distributions). (B) Active properties of cells targeted by CALB2 (n=60 cells) and FOXP2 CellREADRs (n=43). Firing responses of cells in response to current injections, with frequency plotted against current step. Insets show action potentials elicited by current injections at 2X rheobase; these examples were selected to represent the mean input-output curves for each cell type (black). The rheobase (current that initiated firing), gain (initial slope), and max firing frequency all differed statistically between CALB2 and FOXP2-targeted populations (Mann-Whitney U-test for non-normal distributions, t-test for normal distributions). (C) Action potential (AP) properties of cells targeted by CALB2 (n=60 cells) and FOXP2 CellREADRs (n=43 cells). Action potentials were elicited with a 2ms current step. Action potential properties from different stimulation regimes are presented in Supplemental Figure 4. Action potential half-width was measured at 50% of peak voltage (height) and was found to be smaller in CALB2-targeted cells. Action potential height and threshold did not vary between target cell groups. The fast afterhyperpolarization (fAHP) following the AP was larger in CALB2-targeted cells. Action potentials were aligned on their rising phase to compare AP waveforms between target cell groups (lower panel). Group means are illustrated by the black lines. CALB2-targeted cells exhibited a shorter AP duration and a smaller afterdepolarization than FOXP2-targeted cells (Mann-Whitney U-test for non-normal distributions, t-test for normal distributions). Scales bars: left 20 mV, 2 ms; center 20 mV, 2 ms; right 5 mV, 20 ms (D) Subthreshold synaptic activity and suprathreshold firing were observed in targeted cells (held at resting membrane potential with 0 pA current). Excitatory and inhibitory postsynaptic potentials (EPSPs and IPSPs, respectively) were detected in both CALB2- and FOXP2-targeted populations. Representative traces demonstrating EPSPs and IPSPs in cells of both populations are shown. Scale bars: 1 mV, 200 ms (E) Recorded cells exhibited spontaneous firing from their resting potentials. Examples of spontaneous firing activity observed in CALB2- (red, n=3 cells) and FOXP2-targeted cells (blue, n=3) are illustrated, with average firing frequencies (observed over a 3-minute period) indicated to the right of the traces. Scale bars: 20 mV, 1000 ms (F) CALB2-targeted cells (n= 66 cells) were more likely than FOXP2-targeted cells (n=50) to exhibit spontaneous firing in the slice preparation (Chi-squared test). (G) Spontaneous activity, measured as the frequency of spontaneous action potential firing, differed between CALB2- and FOXP2-targeted populations (Mann-Whitney U test). (H) Traces demonstrating spontaneous action potential firing from CALB2- (red) and FOXP2-targeted cells (blue) in either baseline conditions (left) or in the presence of glutamatergic blockers (right). Scale bars: 20 mV, 1000 ms (I) Glutamatergic blockers (CNQX/AP-5) reduced spontaneous firing frequency in most cells (CALB2, n=6 cells; FOXP2, n=2), but did not eliminate firing in every cell.
Figure 4:
Figure 4:. Cell type-specific optical manipulation of human neurons with CellREADR
(A) CellREADR expression of an optogenetic effector, ChIEF, enables optogenetic control of action potential firing in CALB2- but not FOXP2-targeted cells. CALB2-ChIEF neurons fired action potentials (APs) in response to 100 ms, 642 nm light pulses (left) or trains of 2 ms pulses (6/6 cells fired action potentials in response to both stimuli, with some failures at the 4th stimulus). Light stimuli depolarized FOXP2-ChIEF, but did not drive AP firing (0/10 cells fired action potentials in response to stimuli; grey traces, individual trials from a single cells, black traces, averages). Scale bars: 20mV, 20ms, 50ms (B) Representative targeting scheme for optical interrogation of CALB2 synaptic connectivity. Putative postsynaptic cells were labeled with a DLX2.0-YFP virus (left top, green). A binary CellREADR vector driving CALB2-ChIEF-tdTomato was used to activate presynaptic cells (right top, red). During optical stimulation of the ChIEF-tdTomato+ population, patch clamp recordings were made from YFP+/ChIEF-tdTomato cells; at the end of recordings, biocytin-filled patched cells were recovered (right bottom, purple, SAV). Scale bar: 50 μm (C) Postsynaptic currents elicited by CALB2-ChIEF activation. Left, voltage clamp recordings (average of 10 trials in all cases) made from a DLX2.0-YFP+/ChIEF-tdTomato neuron during optical stimulation of the CALB2-ChIEF population. Stimulation elicited optical postsynaptic currents (oPSCs), which were present at the glutamate reversal potential (Vrev(Glu)) but absent at the GABA reversal potential (Vrev(GABA)), indicating that they were mediated by synaptically released GABA. Bicuculline was applied to verify observed oIPSCs were GABAergic. In DLX2.0-YFP+/ChIEF-tdTomato cells, oPSCs were never observed at Vrev(GABA). Right, averaged traces recorded from a hSyn-mCherry+ pyramidal neuron during optical stimulation of the CALB2-ChIEF population. In the recording shown here, oPSCs were detected at Vrev(GABA), but not Vrev(Glu), indicating the cell received glutamatergic inputs from CALB2-ChIEF cells. These inputs were not blocked by bicuculline. No cell exhibited oPSCs at both Vrev(GABA) and Vrev(Glu). Scale bar: left 0.2 pA, 50 ms; 2 pA, 50ms (D) Failure rate of optically triggered synaptic currents. To illustrate trial-to-trial variability in oPSC responses, 10 trials from a DLX2.0-YFP+/ChIEF-tdTomato cell are shown at Vrev(Glu). The first light pulse had a failure rate of 10% (1/10), while the fourth light pulse had a failure rate of 40% (4/10; averaged response, black). Scale bar: 2 pA, 50 ms (E) Waveforms of optically-evoked postsynaptic responses. Optical PSCs measured at Vrev(Glu) from DLX2.0-YFP+/ChIEF-tdTomato interneurons and hSyn-mCherry+ pyramidal neurons were aligned to the light pulse and overlaid to illustrate the variability in amplitudes (left). All oPSCs were normalized to the peak current (right). The monophasic rise time and small jitter relative to the 2 ms light stimulus indicate that PSCs were monosynaptic events directly triggered by the optical pulse (averaged response, black). Scale bar: left 2 pA, 10 ms; 0.2, 5 ms. (F) Quantification of postsynaptic responses to CALB2-ChIEF activation. Recordings were made from DLX2.0-YFP+/CALB2-ChIEF interneurons during CALB2-ChIEF activation. Optical inhibitory PSCs (oIPSCs, oPSCs detected at Vrev(Glu)) were observed in 6/16 cells (37.5%), and optical excitatory PSCs (oEPSCs, oPSCs detected at Vrev(GABA)) were not detected. Recordings were also made from hSyn-tdTomato+ pyramidal neurons during CALB2-ChIEF activation. Optical IPSCs were detected in 3/14 cells (21.4%), and oEPSCs were detected in 2/14 cells (14.3%).
Figure 5:
Figure 5:. Cell type-specific monitoring of population activity with CellREADR
(A) Correlation between action potential firing and GCamp7f signals. Action potentials (black) were elicited by current injections in single cells expressing either CALB2-GCamp7f (n=4 cells) or FOXP2-GCamp7f (n=4; top left, current injection is represented by gray box; the upper inset shows the voltage trace at an expanded time scale to show the individual action potentials (APs)). Calcium transients (green) were concurrently imaged at the cell soma and proximal dendritic compartment. Traces show 6 APs and resultant GCaMP ΔF/F signal measured from a CALB2-GCamp7f cell. The relationship between the baseline-subtracted change in fluorescence and AP firing (right) was established by varying the current injection, counting APs, and fitting the ΔF/F to action potential counts with a linear function (CALB2: R2 = 0.84; FOXP2: R2 = 0.93). Scale bar: inset 20 mV, 100 ms; 20 mV, 2000 ms (B) Calcium imaging detects subthreshold events as well as action potentials. Recording of a CALB2-GCaMP7f demonstrating three evoked action potentials (black trace, at grey box) followed by a spontaneous subthreshold depolarization then a single spontaneous action potential. The calcium transient for these three events (green) is depicted; the rise times for each event were as follows: Tau3AP = 390 ms, TauDepolarization = 1760 ms, Tau1AP = 202 ms. Scale bars: inset 20 mV, 100 ms; 20 mV, 2000 ms (C) Maximum projection of CALB2-GCamp7f (left, red) and FOXP2-GCamp7f (right, blue) neurons measured in baseline conditions (standard artificial cerebrospinal fluid). Background-subtracted fluorescent profiles of cell somata were collected from 90 s video stacks (red and blue traces). CellREADR typically labeled 10–50 cells within a field of view. Scale bars: 50 μm, 20 s (D) Color maps depicting population calcium signal dynamics. Calcium signals from slices labeled with CALB2-GCamp7f (left, red; n=6 slices) or FOXP2-GCamp7f cells (right, blue n=7) are represented by a color map (intensity scale at bottom; each map represents a recording performed on a single slice, slices were collected from 4 donors). Spontaneous activity levels varied between slices. Calcium signal traces from selected individual cells are depicted to the right of the color maps; most transients were small-amplitude, fast-rising events, similar to the transients produced by APs in (A). Large-amplitude, slow-rising transients (marked with asterisks) similar to the subthreshold events in (B), were also observed. Scale bars: population maps 20 s, individual traces 10 s (E) Correlated calcium events in slice populations. The correlation of cellular CALB2-GCaMP7f (n=6 slices) or FOXP2-GCaMP7f (n=7) calcium signals was measured within each slice and then compared between groups (CALB2- and FOXP2-targeted populations). Calcium signals were more strongly correlated in the FOXP2-targeted population (Unpaired t-test). (F) Calcium signal responses to nicotinic acetylcholine receptor activation. Nicotine (300 μM) was applied to a subset of slices following imaging of baseline activity. Each panel represents a ROI in a single slice labeled with either CALB2-GCaMP7f (left, red; n=3 slices) and FOXP2-GCaMP7f (right, blue; n=3). Scale bar: 20 s (G) Nicotine application did not change the proportion of active cells within the labeled populations (CALB2, p=0.08; FOXP2, p=0.999 by Fisher exact test). However, nicotine application increased the area of measured calcium events, normalized to baseline areas in CALB2-targeted cells (p = 0.045 by 2-way ANOVA with Fisher’s LSD post-hoc). Dashed line on both graphs represents unity.

References

    1. Zeng H., and Sanes J.R. (2017). Neuronal cell-type classification: challenges, opportunities and the path forward. Nat. Rev. Neurosci. 18, 530–546. - PubMed
    1. Konopka G., and Bhaduri A. (2023). Functional genomics and systems biology in human neuroscience. Nature 623, 274–282. - PMC - PubMed
    1. Jorstad N.L., Song J.H.T., Exposito-Alonso D., Suresh H., Castro-Pacheco N., Krienen F.M., Yanny A.M., Close J., Gelfand E., Long B., et al. (2023). Comparative transcriptomics reveals human-specific cortical features. Science 382, eade9516. - PMC - PubMed
    1. Siletti K., Hodge R., Mossi Albiach A., Lee K.W., Ding S.-L., Hu L., Lönnerberg P., Bakken T., Casper T., Clark M., et al. (2023). Transcriptomic diversity of cell types across the adult human brain. Science 382, eadd7046. - PubMed
    1. Jorstad N.L., Close J., Johansen N., Yanny A.M., Barkan E.R., Travaglini K.J., Bertagnolli D., Campos J., Casper T., Crichton K., et al. (2023). Transcriptomic cytoarchitecture reveals principles of human neocortex organization. Science 382, eadf6812. - PMC - PubMed

Publication types

LinkOut - more resources