. 2024 Nov 29:15:1477174.
doi: 10.3389/fneur.2024.1477174. eCollection 2024.

Ephaptic conduction in tonic-clonic seizures

Affiliations

Ephaptic conduction in tonic-clonic seizures

Avinoam Rabinovitch et al. Front Neurol. .

Abstract

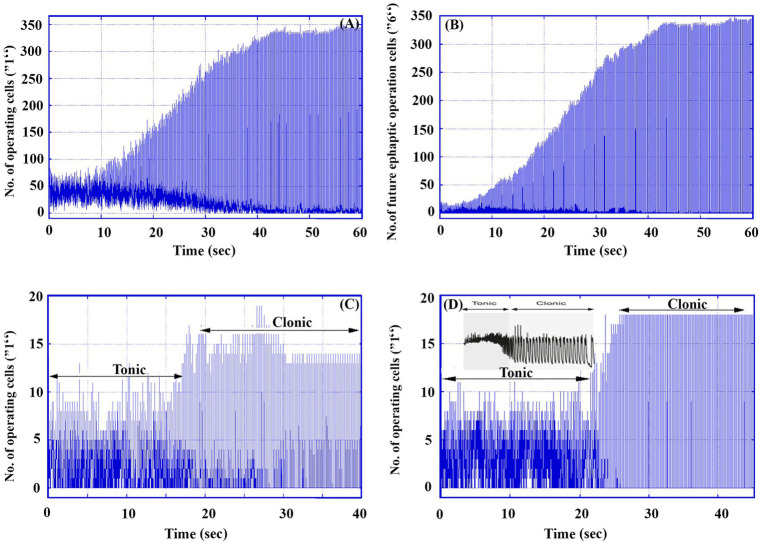
Objectives: Electroencephalograms (EEGs) or multi-unit activities (MUAs) of tonic-clonic seizures typically exhibit a distinct structure. After a preliminary phase (DC shift, spikes), the tonic phase is characterized by synchronized activity of numerous neurons, followed by the clonic phase, marked by a periodic sequence of spikes. However, the mechanisms underlying the transition from tonic to clonic phases remain poorly understood.

Methods: We employ a simple two-dimensional cellular automaton model to simulate seizure activity, specifically focusing on replicating the tonic-clonic transition. This model effectively illustrates the physical processes during the ictal phase and, more importantly, differentiates the roles of neurons' activity, identifying their origin as either synaptic or ephaptic.

Results: Our model reveals an intriguing interaction between the synaptic and ephaptic modes of action potential wave conduction. By replicating the EEG and multi-unit activity (MUA) structure of a tonic-clonic seizure and comparing it with real MUA data, we validate the model's underlying assumption: the transition from tonic to clonic phases is driven by a shift in dominance from synaptic to ephaptic conduction. During synaptic-mode control, neural conduction occurs through synaptic transmission involving chemical substances, while in the ephaptic mode, information transfer occurs through direct Ohmic conduction.

Significance: Gaining a deeper understanding of the neuronal electrical conduction transitions during tonic-clonic seizures is crucial for improving the treatment of this debilitating condition.

Keywords: EEG; cellular automaton (CA); ephaptic; seizures; tonic–clonic.


Conflict of interest statement

The authors declare that the research was conducted in the absence of any commercial or financial relationships that could be construed as a potential conflict of interest.

Figures

Figure 1
Figure 1
Model excitability curve. In our model, excitability is related to the percent probability p of inducing a cell to operate if the conditions of the adjoining cells are ripe (Equation 1). It is measured by the final number of operating cells in the matrix, starting with 20 operating ones. Figure indicates the brain conditions: no function (p < ~0.6); regular functioning (~0.65 < p < ~0.8), and epileptic functioning (p > ~0.9).
Figure 2
Figure 2
Disruption of a target wave under synaptic conduction by 10 and 20% inhibitory neurons. A 2 × 2 unit of operating cells is introduced into a matrix under pure synaptic conduction. (A) Only excitatory cells. (B) Randomly distributed 10% of inhibitory cells. (C) Randomly distributed 20% of inhibitory cells. The drawings follow the time propagation of the ensuing waves.
Figure 3
Figure 3
An example of a tonic–clonic seizure in a 30 × 30 matrix under high excitability (p = 1). (A) The number of total operating cells (labeled “1”) in the whole matrix as a function of time. (B) The number of future ephaptic mode operating neurons (labeled “6”) in the whole matrix as a function of time. (B) Total operating cells in an electrode of 6 × 6 cells located at (7, 7). (D) Total operating cells in an electrode of 6 × 6 cells located at (20, 20). (D) Inset. An example of a single neuron response in a real tonic–clonic seizure [Figure 1 in Raimondo JV, Burman RJ, Katz AA, and Akerman CJ Ion dynamics during seizures. Front. Cell. Neurosci. 9, 419, (2015). doi: 10.3389/fncel.2015.0041].
Figure 4
Figure 4
Ratio of the ephaptic mode out of the total activity. Smoothed values (moving averaged by 0.1 s) of part 3B (6′ s) divided by those of the total operating numbers (part 3A, 1′s).
Figure 5
Figure 5
FFT of the domination transfer of the system from synaptic conduction to an ephaptic conduction one. Left: FFT of 0–1 s of Figure 3 A (synaptic domination region). Zero amplitude after 2 Hz. Right: FFT of 49–50 s (ephaptic domination region). One harmonic is shown.

References

    1. Lothman EW. The neurobiology of epileptiform discharges. Am J EEG Technol. (1993) 33:93–112. doi: 10.1080/00029238.1993.11080438 - DOI
    1. Kandel ER, Koester JD, Mack SH, Siegelbaum SA, eds. Principles of neural science, sixth edition. NY: Mc Graw Hill (2021). p. 1457.
    1. Beverlin B, Kakalios J, Nykamp D, Netoff TI. Dynamical changes in neurons during seizures determine tonic to clonic shift. J Comput Neurosci. (2012) 33:41–51. doi: 10.1007/s10827-011-0373-5, PMID: - DOI - PubMed
    1. Womble M, Moises HC. Muscarinic modulation of conductances underlying the afterhyperpolarization in neurons of the rat basolateral amygdala. Brain Res. (1993) 621:87–96. doi: 10.1016/0006-8993(93)90301-3, PMID: - DOI - PubMed
    1. Lytton WW, Omurtag A. Tonic-clonic transitions in computer simulation. J Clin Neurophysiol. (2007) 24:175–81. doi: 10.1097/WNP.0b013e3180336fc0, PMID: - DOI - PMC - PubMed

LinkOut - more resources